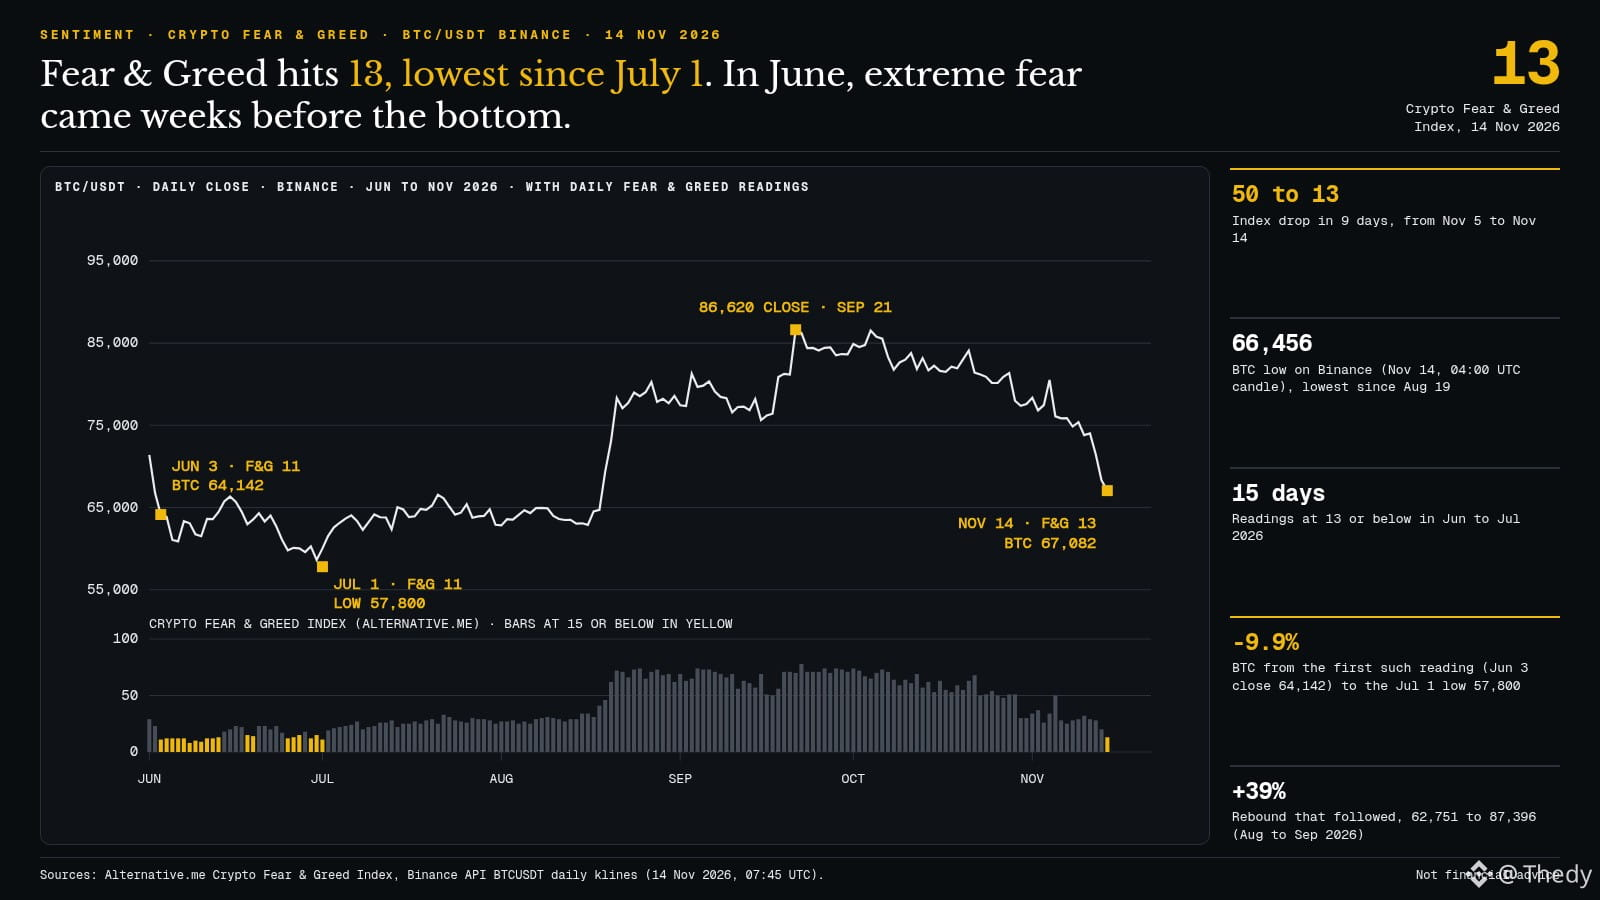
The Crypto Fear & Greed Index (Alternative.me) fell to 13 this Saturday, November 14. That's its lowest level since July 1, and it was still at 50 on November 5. The question that keeps coming up: does extreme fear mark the bottom of $BTC ?
This summer's precedent offers a nuanced answer. On June 3, the index fell to 11, with BTC closing at $64,142 on Binance. The price nevertheless continued to slide for four weeks, reaching $57,800 on July 1 (-9.9%), when the index was still at 11. Between June and July, there were 15 sessions at 13 or below. The rebound came only after this period of saturation: from $62,751 to $87,396 between August and September (+39%).
My take: an extreme fear reading mainly tells us that the more impatient sellers have already sold a good portion of their holdings. It doesn't tell us when the reversal will happen. The signal becomes more useful when fear persists for several days without the price making a new low.
As for the market, BTC touched $66,456 on the 04:00 UTC candle, its lowest level since August 19, with $161 million traded on the spot market during the 02:00 UTC hour alone (compared with around $30 million during quieter hours). At 07:42 UTC, it was trading at $67,082. $ETH remains below $1,900, and $SOL has lost 6.3% in 24 hours.
Two scenarios to watch:
- The index stays below 15 for several days while BTC holds above $66,456, which would resemble late June;
- A daily close below $64,166 (the August 19 low) would reopen the $62,000–$64,000 zone where the price spent July and August.
Are you counting on this reading of 13 as a buy signal, or are you waiting for the price to stop making new lows?
#Bitcoin #FearAndGreed
Sources: Alternative.me (Crypto Fear & Greed Index), Binance BTCUSDT API (daily and hourly klines), 14/11, 07:45 UTC. Not financial advice.
This summer's precedent offers a nuanced answer. On June 3, the index fell to 11, with BTC closing at $64,142 on Binance. The price nevertheless continued to slide for four weeks, reaching $57,800 on July 1 (-9.9%), when the index was still at 11. Between June and July, there were 15 sessions at 13 or below. The rebound came only after this period of saturation: from $62,751 to $87,396 between August and September (+39%).
My take: an extreme fear reading mainly tells us that the more impatient sellers have already sold a good portion of their holdings. It doesn't tell us when the reversal will happen. The signal becomes more useful when fear persists for several days without the price making a new low.
As for the market, BTC touched $66,456 on the 04:00 UTC candle, its lowest level since August 19, with $161 million traded on the spot market during the 02:00 UTC hour alone (compared with around $30 million during quieter hours). At 07:42 UTC, it was trading at $67,082. $ETH remains below $1,900, and $SOL has lost 6.3% in 24 hours.
Two scenarios to watch:
- The index stays below 15 for several days while BTC holds above $66,456, which would resemble late June;
- A daily close below $64,166 (the August 19 low) would reopen the $62,000–$64,000 zone where the price spent July and August.
Are you counting on this reading of 13 as a buy signal, or are you waiting for the price to stop making new lows?
#Bitcoin #FearAndGreed
Sources: Alternative.me (Crypto Fear & Greed Index), Binance BTCUSDT API (daily and hourly klines), 14/11, 07:45 UTC. Not financial advice.