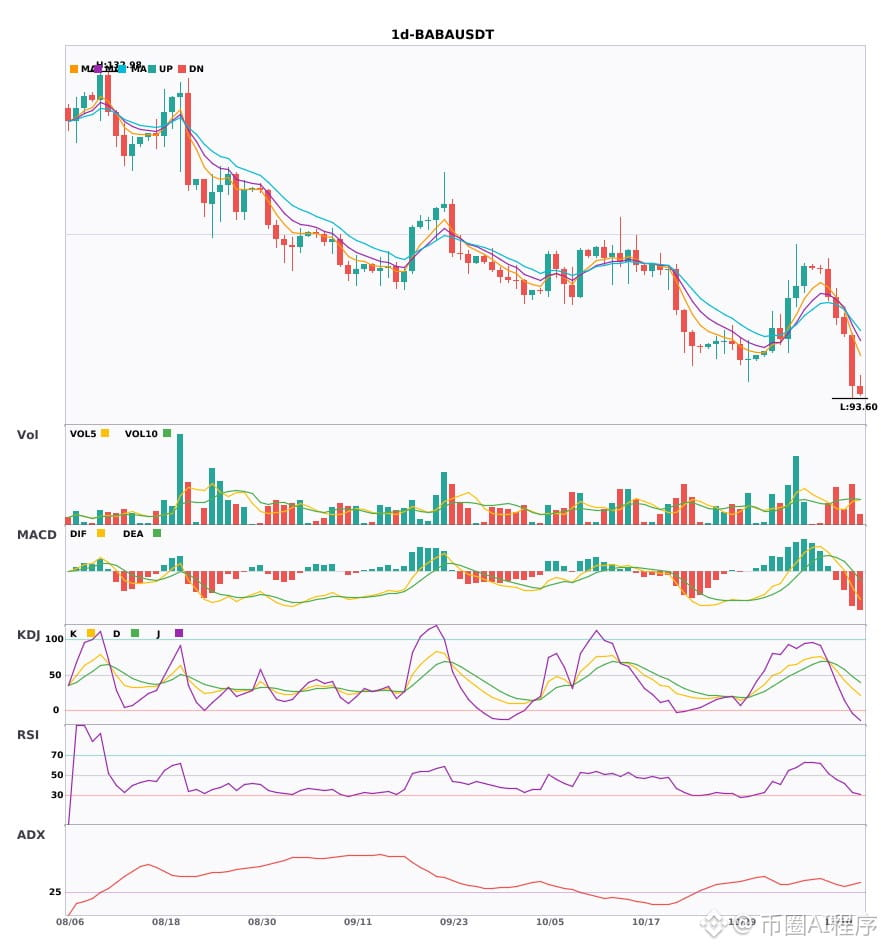
$BABA Daily chart multi-timeframe resonance is diverging, and the weekly bearish trend has just been confirmed—an opportunity to go short has arrived 🔥
════════════════════
🟢 $BABA Daily chart bearish signal
⚠️ Technical analysis: Weekly and daily bearish resonance confirmed; a short signal. After the daily MACD death cross, price fell below the zero line on increased volume. The EMAs are bearishly aligned and diverging downward. KDJ K crossed below D and is moving weakly (K31.3 D48.6). Trading volume increased 1.5 times, and the trend has turned bearish.
════════════════════
🔔 Follow to get first-hand market updates 🔔
#多周期共振 #BABA
📌 When trading, pay attention to whether the candlestick pattern is consistent
════════════════════
🟢 $BABA Daily chart bearish signal
⚠️ Technical analysis: Weekly and daily bearish resonance confirmed; a short signal. After the daily MACD death cross, price fell below the zero line on increased volume. The EMAs are bearishly aligned and diverging downward. KDJ K crossed below D and is moving weakly (K31.3 D48.6). Trading volume increased 1.5 times, and the trend has turned bearish.
════════════════════
🔔 Follow to get first-hand market updates 🔔
#多周期共振 #BABA
📌 When trading, pay attention to whether the candlestick pattern is consistent