

A Volatility Indicator is a technical analysis tool used to measure the extent of fluctuations or the rate of price changes of an asset over a specific period of time.
Here is a complete explanation of the function, how it works, its probability, and why this indicator is so popular among traders:
1. Function of the Volatility Indicator
Measuring the Level of Risk: Helps traders determine how wildly prices are moving in the market so they can adjust their position sizing.
Setting Stop-Loss and Take-Profit Levels: High volatility requires a wider stop-loss distance to avoid being triggered by market noise, and vice versa.
Detecting Potential Breakouts or Trend Reversals: Narrowing volatility is often an early sign that the market is about to move aggressively (a price explosion).
2. How Volatility Indicators Work
Most volatility indicators (such as Bollinger Bands, Average True Range (ATR), or Standard Deviation) work by comparing the current price with its historical price range or average:
During High Volatility: The distance between indicator lines (such as the Bollinger Bands) widens, indicating that the market is active, panicked, or experiencing a strong trend impulse.
During Low Volatility: Indicator lines narrow or contract (squeeze), signaling that the market is quiet, consolidating, or waiting for a major news catalyst.
3. Probability in the Use of Volatility Indicators
Statistically and probabilistically, volatility indicators are based on the normal distribution law:
Mean Reversion: For example, with Bollinger Bands, around 95% of historical price movements are statistically within the upper and lower bands (a range of 2 standard deviations).
Breakout Probability: When the indicator bands become extremely narrow (a squeeze), the probability of a sharp price movement (breakout) increases significantly, although the exact direction (up or down) must be confirmed using other analysis tools.
Volatility indicators do not predict price direction (whether it will rise or fall); instead, they measure the intensity of the movement.
4. Why Do Many Traders Use These Indicators?
Better Risk Management: Professional traders know that surviving in the market is far more important than simply making a profit. Volatility indicators are key to setting risk limits objectively.
Avoiding Market Traps (False Breakouts): By observing volatility conditions, traders can identify whether a price movement is valid or merely a false fluctuation in a sideways market.
Adapting to Market Conditions: Crypto and stock markets are always changing, shifting from calm to extremely volatile. Volatility indicators allow traders to adapt dynamically without getting stuck with rigid indicator settings.
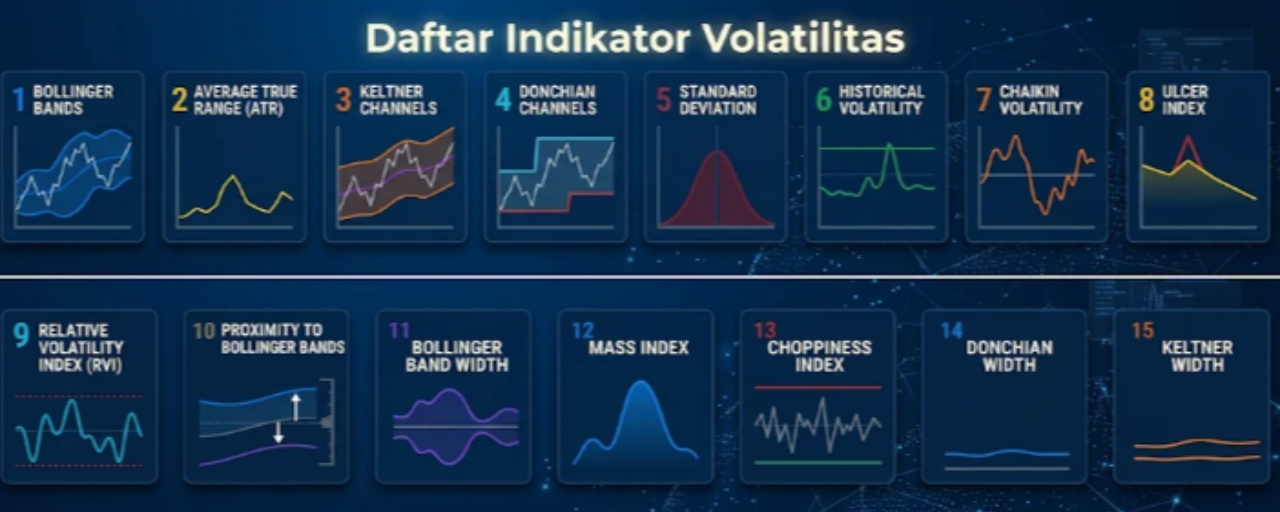
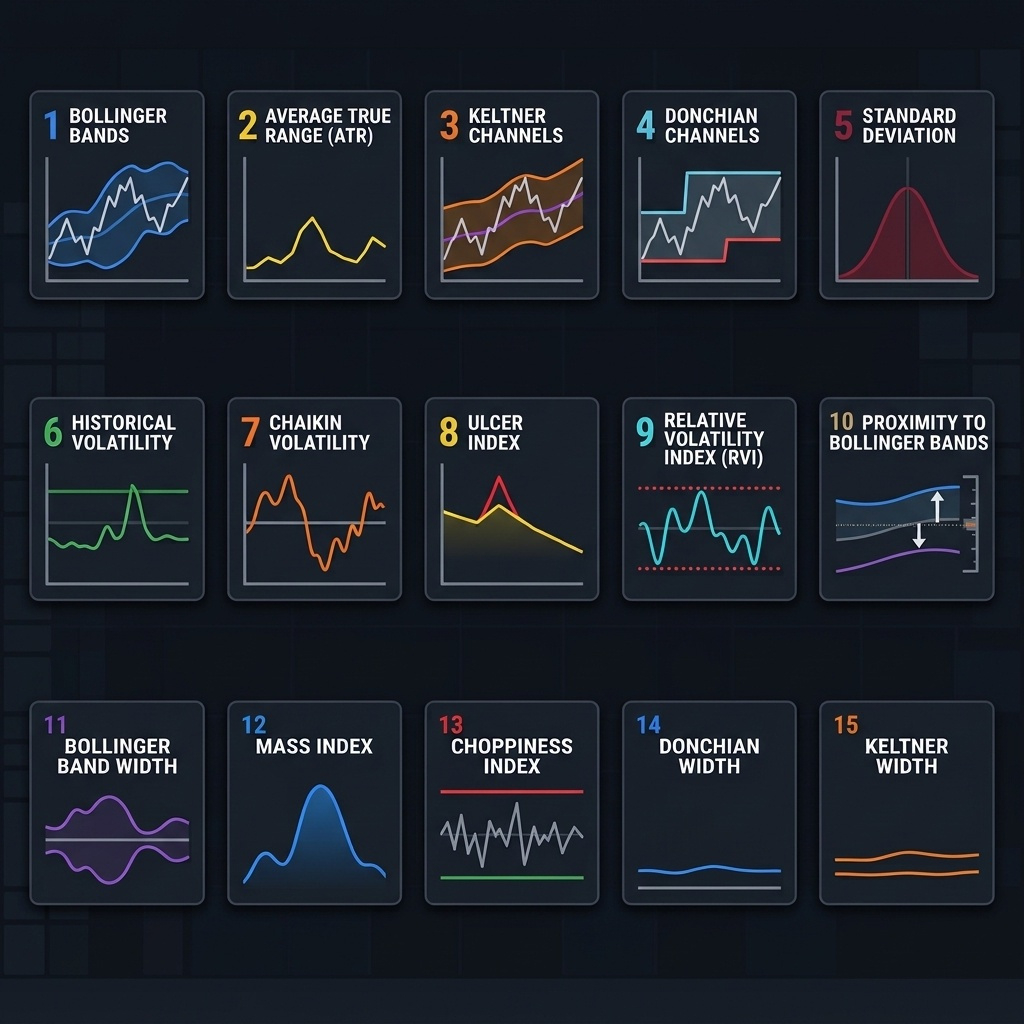
List of Volatility Indicators
Helps measure the extent of price fluctuations in the market.
Bollinger Bands
Average True Range (ATR)
Keltner Channels
Donchian Channels
Standard Deviation
Historical Volatility
Chaikin Volatility
Ulcer Index
Relative Volatility Index (RVI)
Proximity to Bollinger Bands
Bollinger Band Width
Mass Index
Choppiness Index
Donchian Width
Keltner Width