Today's one-line summary: All 4 coins are in bearish daily structures; all are also bearish on the 1H, so the short-term and broader trends are aligned. Volatility is normal today (each coin's intraday range is 78%–81% of its usual level).
EMA Structure Daily Report | 2026-11-09 21:00 Beijing Time
Binance USDT perpetuals | Based on the structure panel formula
Structure observation only, not a complete engine entry signal.
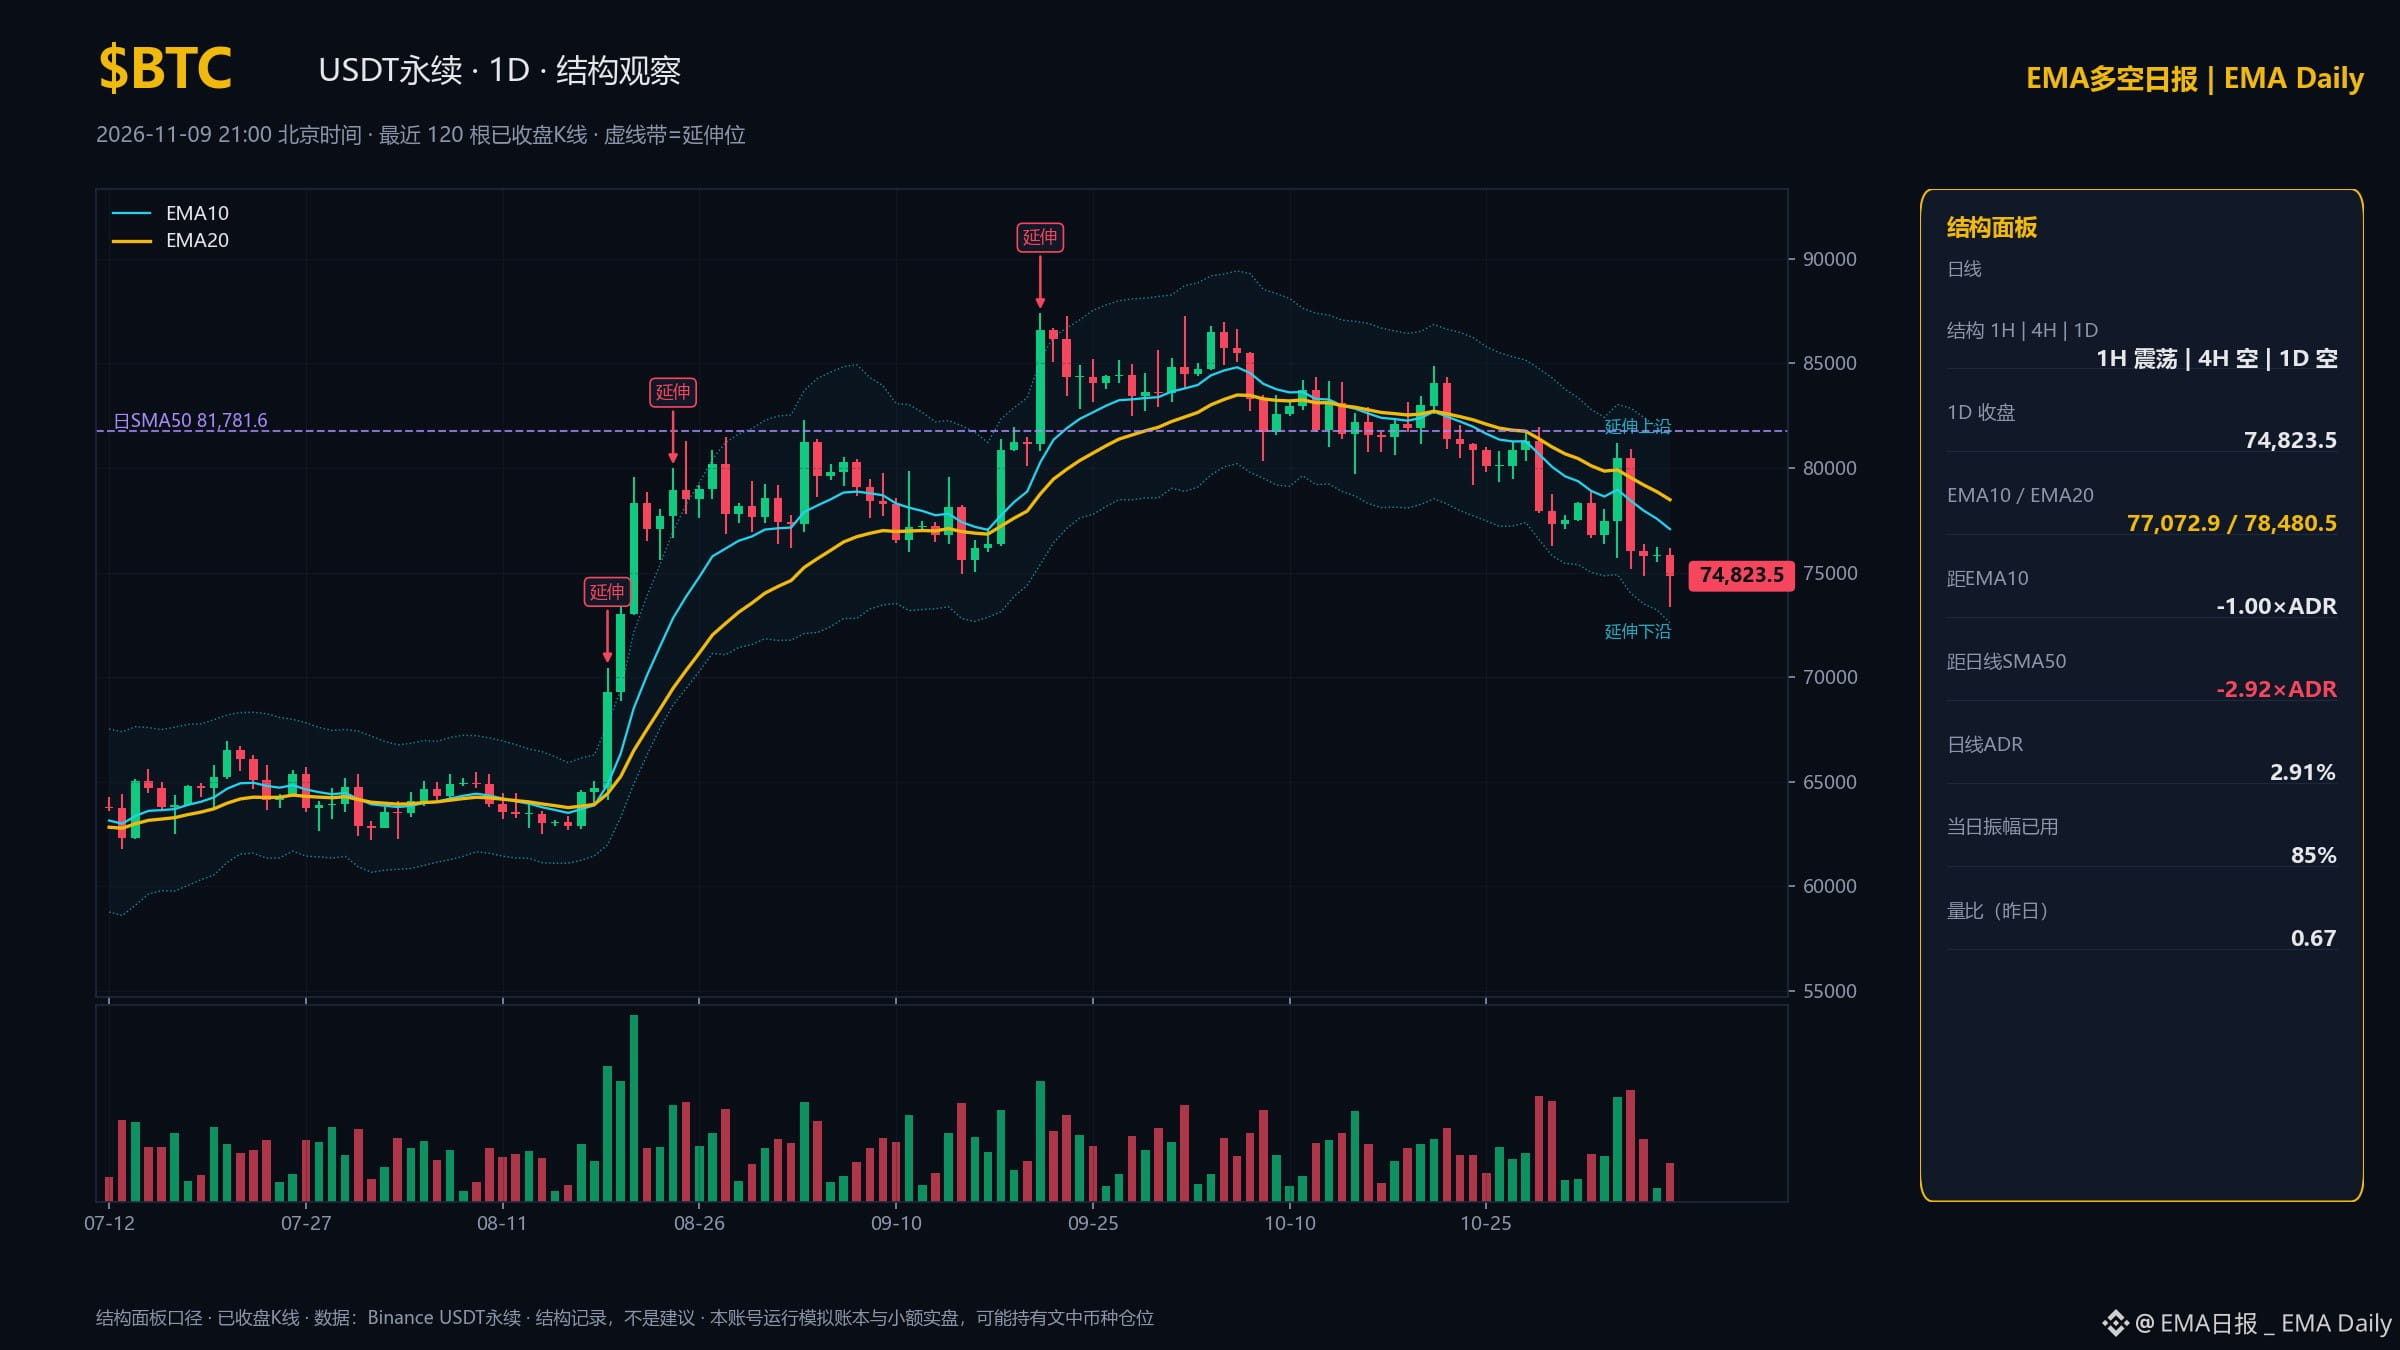
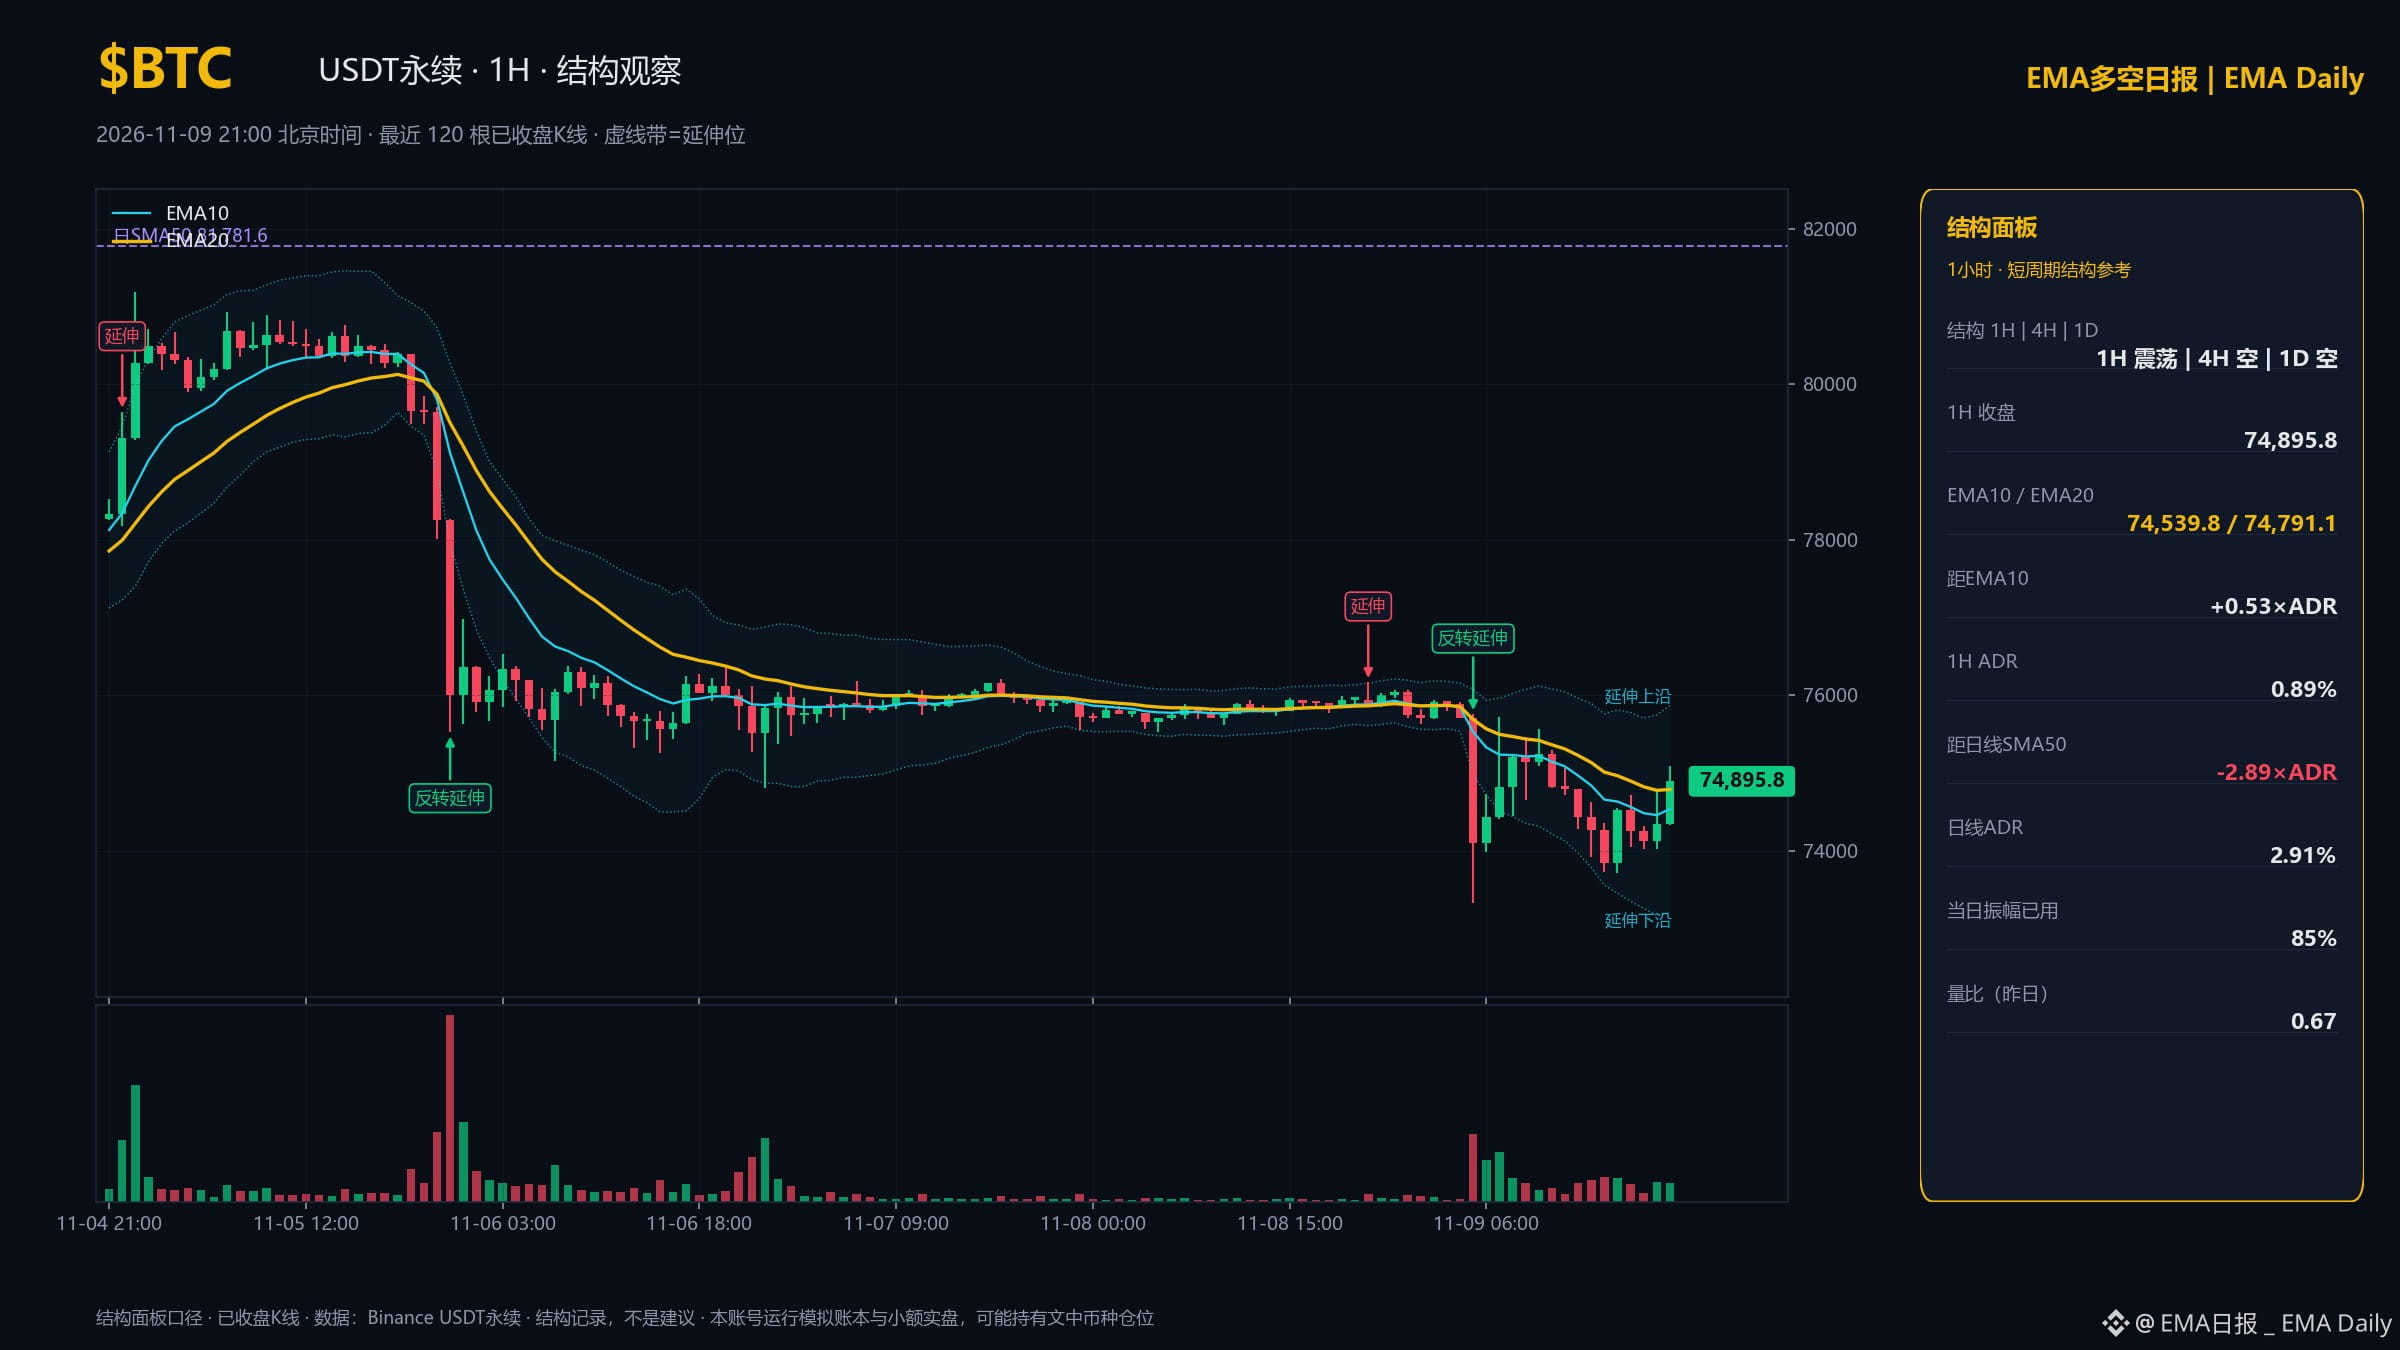
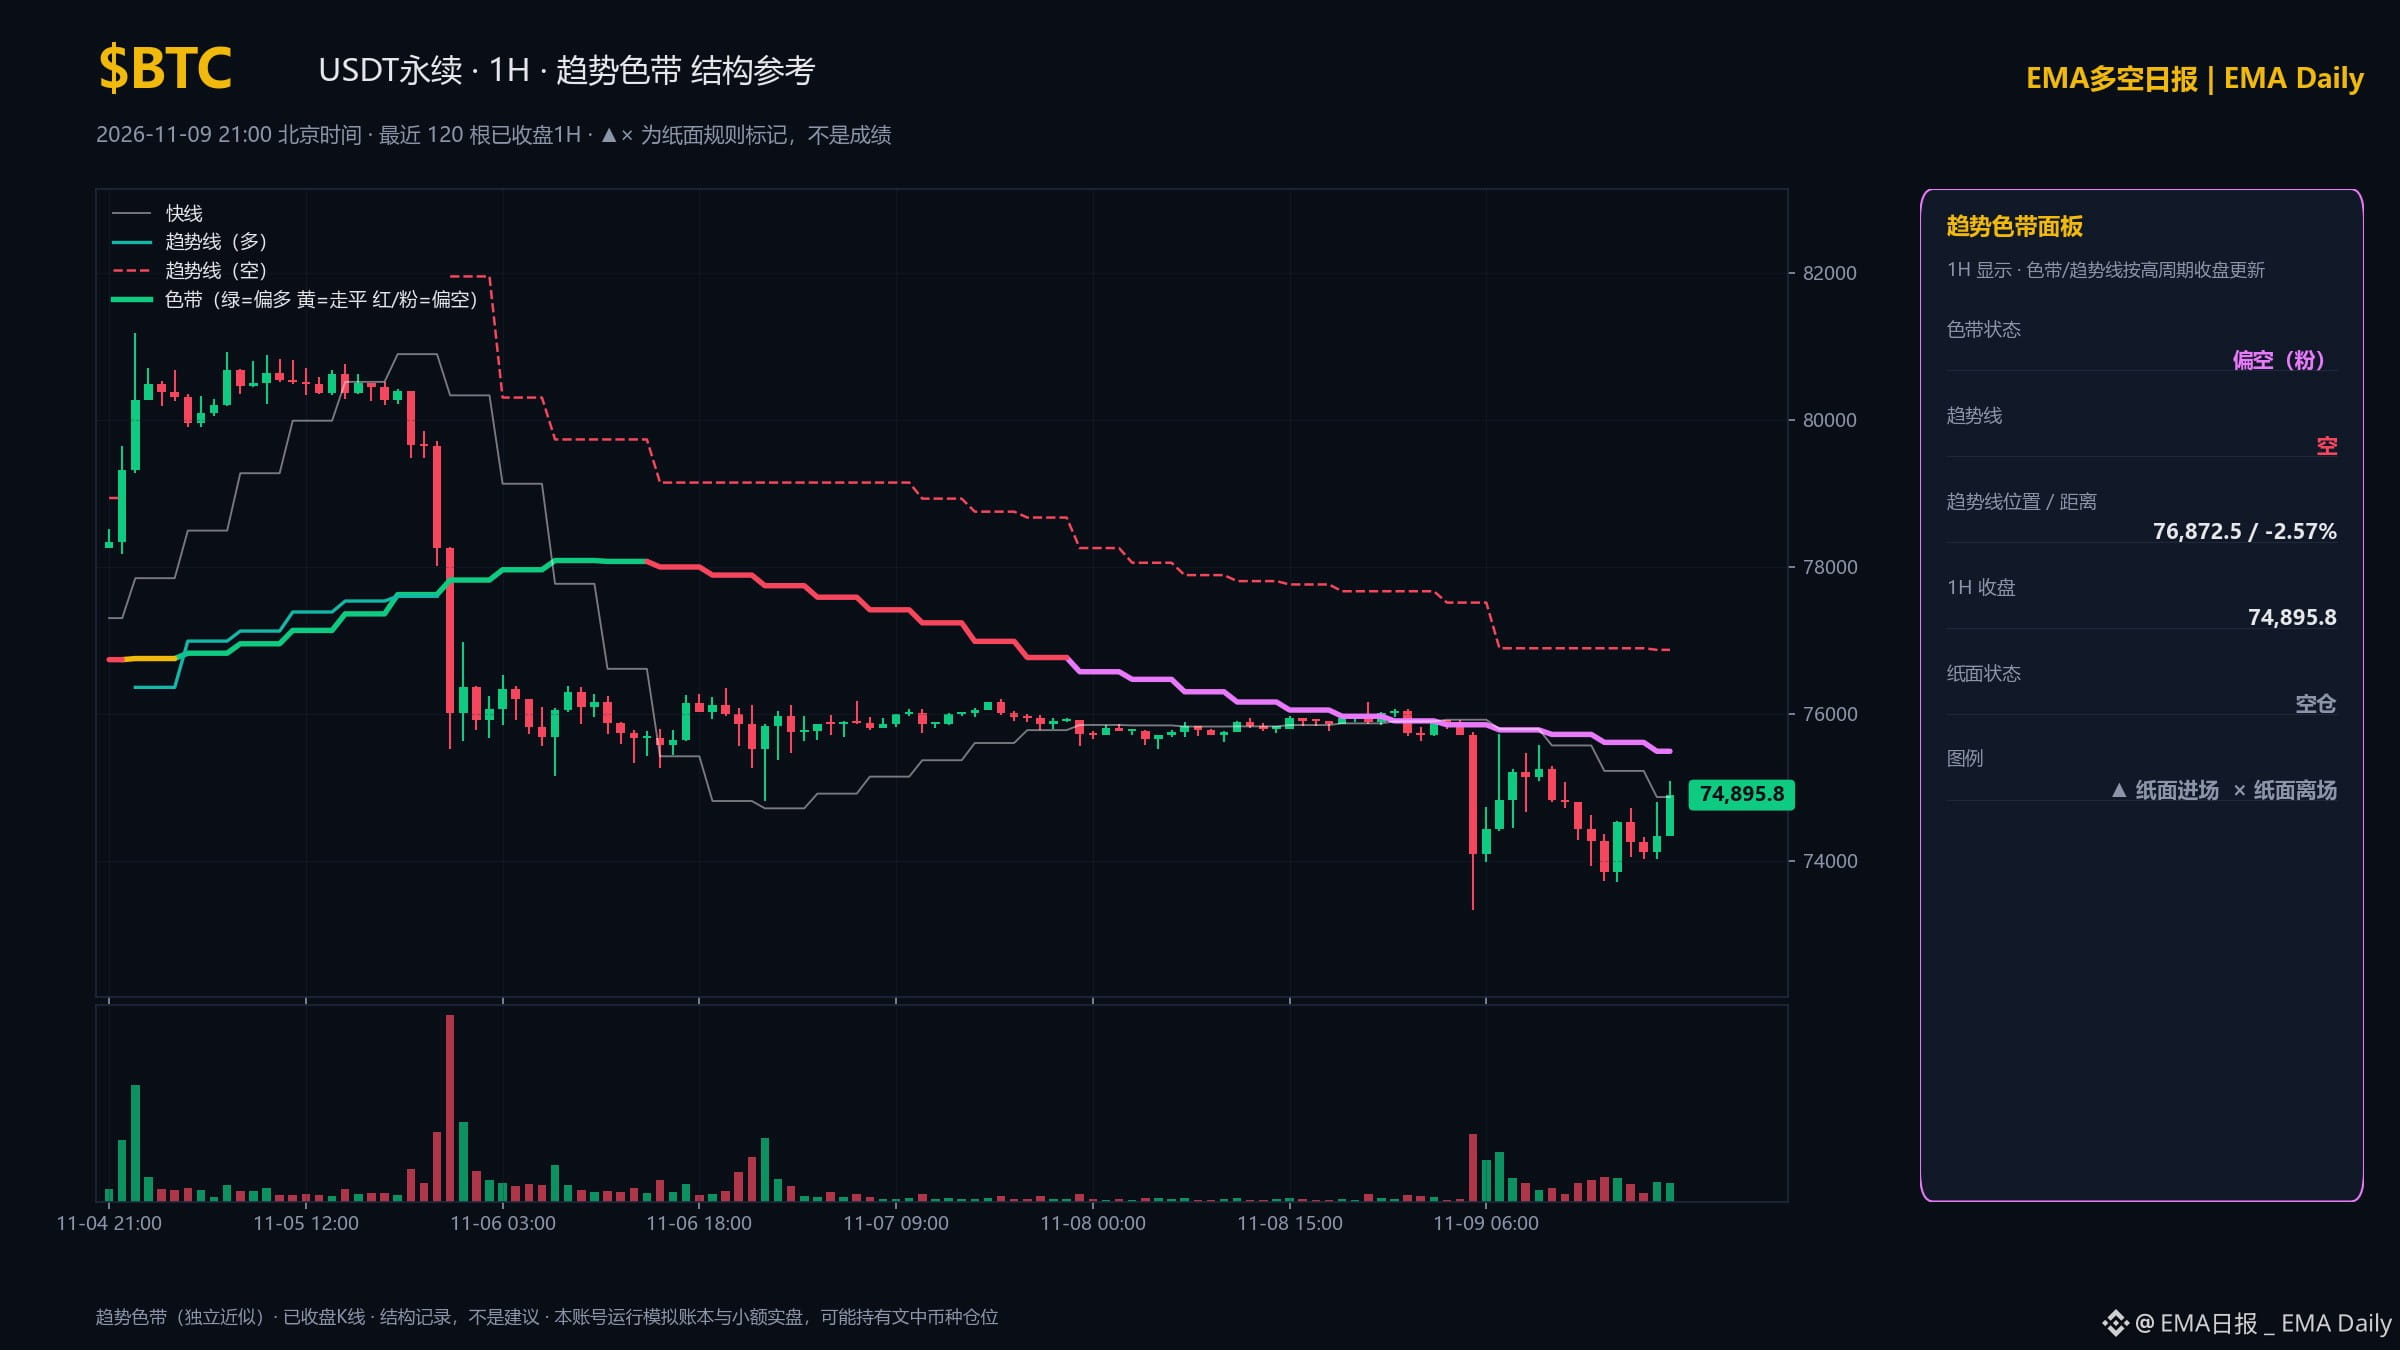
$BTC | 1H bearish | 4H bearish | Daily bearish
1H close 74895.8; 4H EMA20 75689.2
Daily ADR 2.91% | Volume ratio 0.68
Daily distance from SMA50: -2.92×ADR; upside extension reference 81557.3
Today's range / average range over the previous 20 days: 81.0%
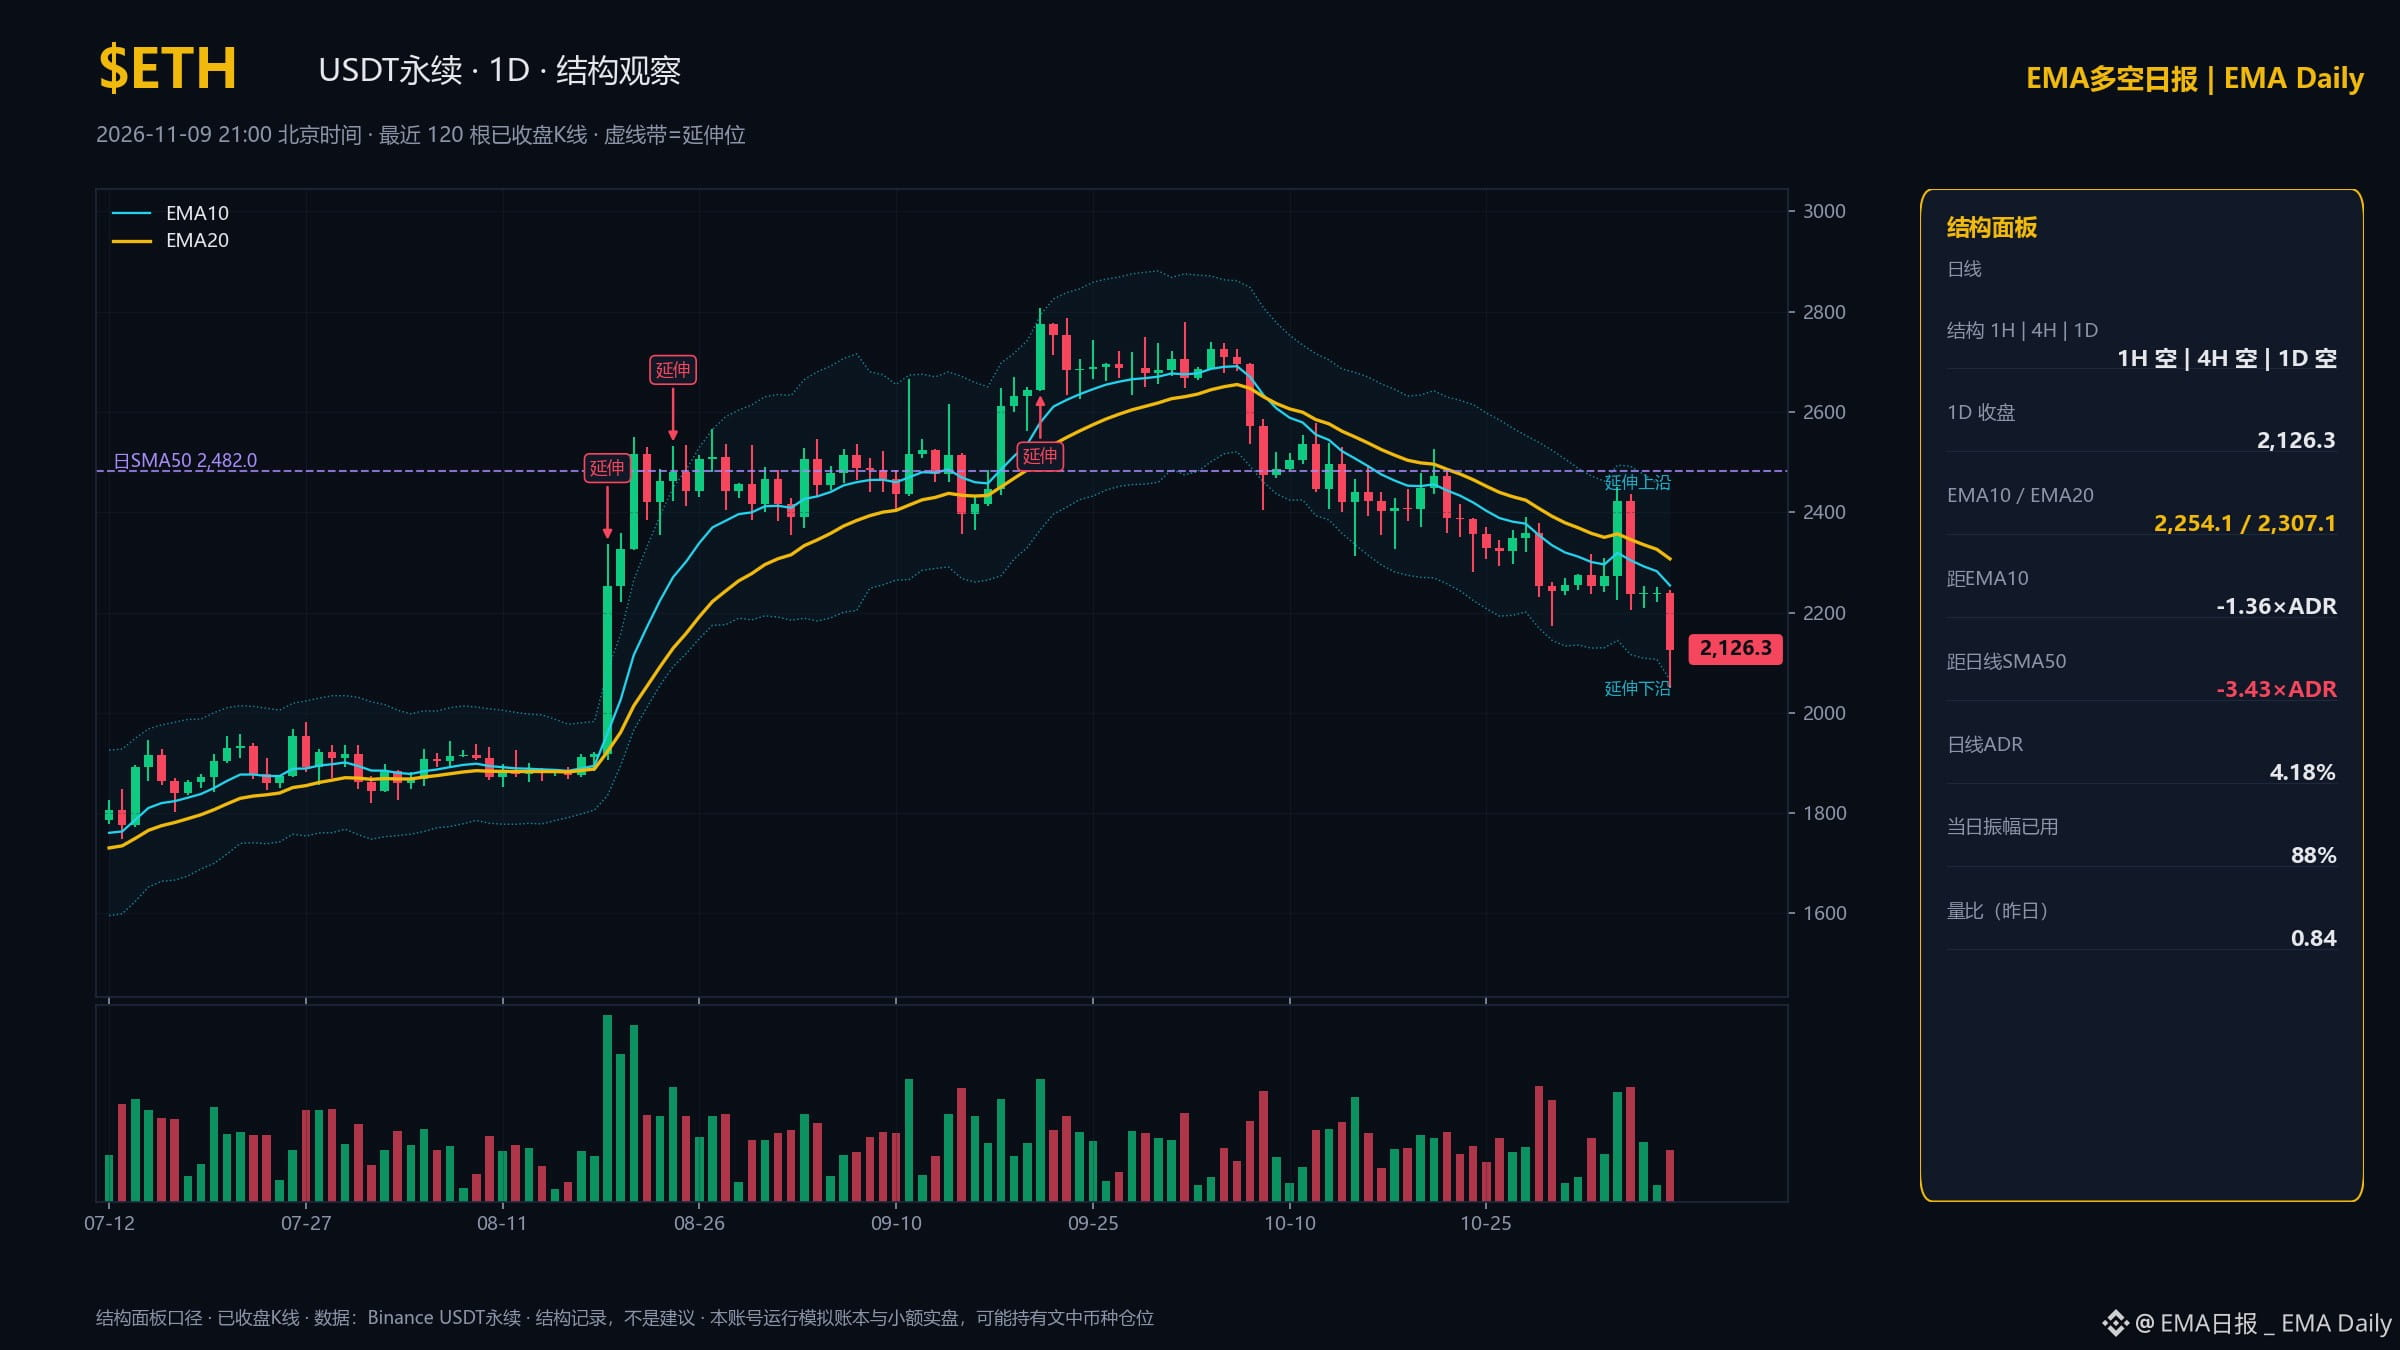
$ETH | 1H bearish | 4H bearish | Daily bearish
1H close 2121.5; 4H EMA20 2207.7
Daily ADR 4.18% | Volume ratio 0.84
Daily distance from SMA50: -3.43×ADR; upside extension reference 2442.5
Today's range / average range over the previous 20 days: 80.8%
Daily price is below SMA50/200
$SOL | 1H bearish | 4H bearish | Daily bearish
1H close 86.58; 4H EMA20 89.06
Daily ADR 4.50% | Volume ratio 0.94
Daily distance from SMA50: -4.30×ADR; upside extension reference 100.48
Today's range / average range over the previous 20 days: 77.7%
Daily price is below SMA50/200
BNB | 1H bearish | 4H bearish | Daily bearish
1H close 687.44; 4H EMA20 693.38
Daily ADR 3.36% | Volume ratio 0.65
Daily distance from SMA50: -2.34×ADR; upside extension reference 749.5
Today's range / average range over the previous 20 days: 77.8%
Closed data as of (Beijing Time): 1H 11-09 21:00; 4H 11-09 20:00; Daily 11-09 08:00
Methodology: EMA10>EMA20 is bullish; otherwise, classified as bearish according to the original panel. This does not constitute entry authorization. Daily ADR is the average of recent ranges and includes the latest closed daily candle; the daily volume ratio is likewise based on closed daily data.
Today's range accumulates only closed 1H candles. The UTC day starts at 08:00 Beijing Time. The range ratio can exceed 100%; this does not indicate remaining room for movement. An extension reference level does not mean an exhaustion event has been triggered, and moving averages are not guaranteed support or resistance.
Charts: BTC/ETH daily structure charts; BTC 1H structure chart and 1H trend color-band chart. Dashed bands indicate extension levels; panel readings are based on closed candles.
BTC is bearish across the 1H/4H/daily timeframes, and is still some distance from the daily SMA50 (81781.6). What do you think are the odds it first reclaims 74791.1 (1H EMA20) this week?
#EMA #MarketWatch
Not investment advice.
EMA Structure Daily Report | 2026-11-09 21:00 Beijing Time
Binance USDT perpetuals | Based on the structure panel formula
Structure observation only, not a complete engine entry signal.
$BTC | 1H bearish | 4H bearish | Daily bearish
1H close 74895.8; 4H EMA20 75689.2
Daily ADR 2.91% | Volume ratio 0.68
Daily distance from SMA50: -2.92×ADR; upside extension reference 81557.3
Today's range / average range over the previous 20 days: 81.0%
$ETH | 1H bearish | 4H bearish | Daily bearish
1H close 2121.5; 4H EMA20 2207.7
Daily ADR 4.18% | Volume ratio 0.84
Daily distance from SMA50: -3.43×ADR; upside extension reference 2442.5
Today's range / average range over the previous 20 days: 80.8%
Daily price is below SMA50/200
$SOL | 1H bearish | 4H bearish | Daily bearish
1H close 86.58; 4H EMA20 89.06
Daily ADR 4.50% | Volume ratio 0.94
Daily distance from SMA50: -4.30×ADR; upside extension reference 100.48
Today's range / average range over the previous 20 days: 77.7%
Daily price is below SMA50/200
BNB | 1H bearish | 4H bearish | Daily bearish
1H close 687.44; 4H EMA20 693.38
Daily ADR 3.36% | Volume ratio 0.65
Daily distance from SMA50: -2.34×ADR; upside extension reference 749.5
Today's range / average range over the previous 20 days: 77.8%
Closed data as of (Beijing Time): 1H 11-09 21:00; 4H 11-09 20:00; Daily 11-09 08:00
Methodology: EMA10>EMA20 is bullish; otherwise, classified as bearish according to the original panel. This does not constitute entry authorization. Daily ADR is the average of recent ranges and includes the latest closed daily candle; the daily volume ratio is likewise based on closed daily data.
Today's range accumulates only closed 1H candles. The UTC day starts at 08:00 Beijing Time. The range ratio can exceed 100%; this does not indicate remaining room for movement. An extension reference level does not mean an exhaustion event has been triggered, and moving averages are not guaranteed support or resistance.
Charts: BTC/ETH daily structure charts; BTC 1H structure chart and 1H trend color-band chart. Dashed bands indicate extension levels; panel readings are based on closed candles.
BTC is bearish across the 1H/4H/daily timeframes, and is still some distance from the daily SMA50 (81781.6). What do you think are the odds it first reclaims 74791.1 (1H EMA20) this week?
#EMA #MarketWatch
Not investment advice.