
#bitcoinslipsbelow$80kagain
The bulls have officially lost the psychological line in the sand! Let’s break down the latest Bitcoin breakdown using pure math 🧮👇
(Moving Average Loss) + (Risk-Off Selling) = Key Support Test 📉
Here is the exact technical formula driving the market today:
The Price Input:
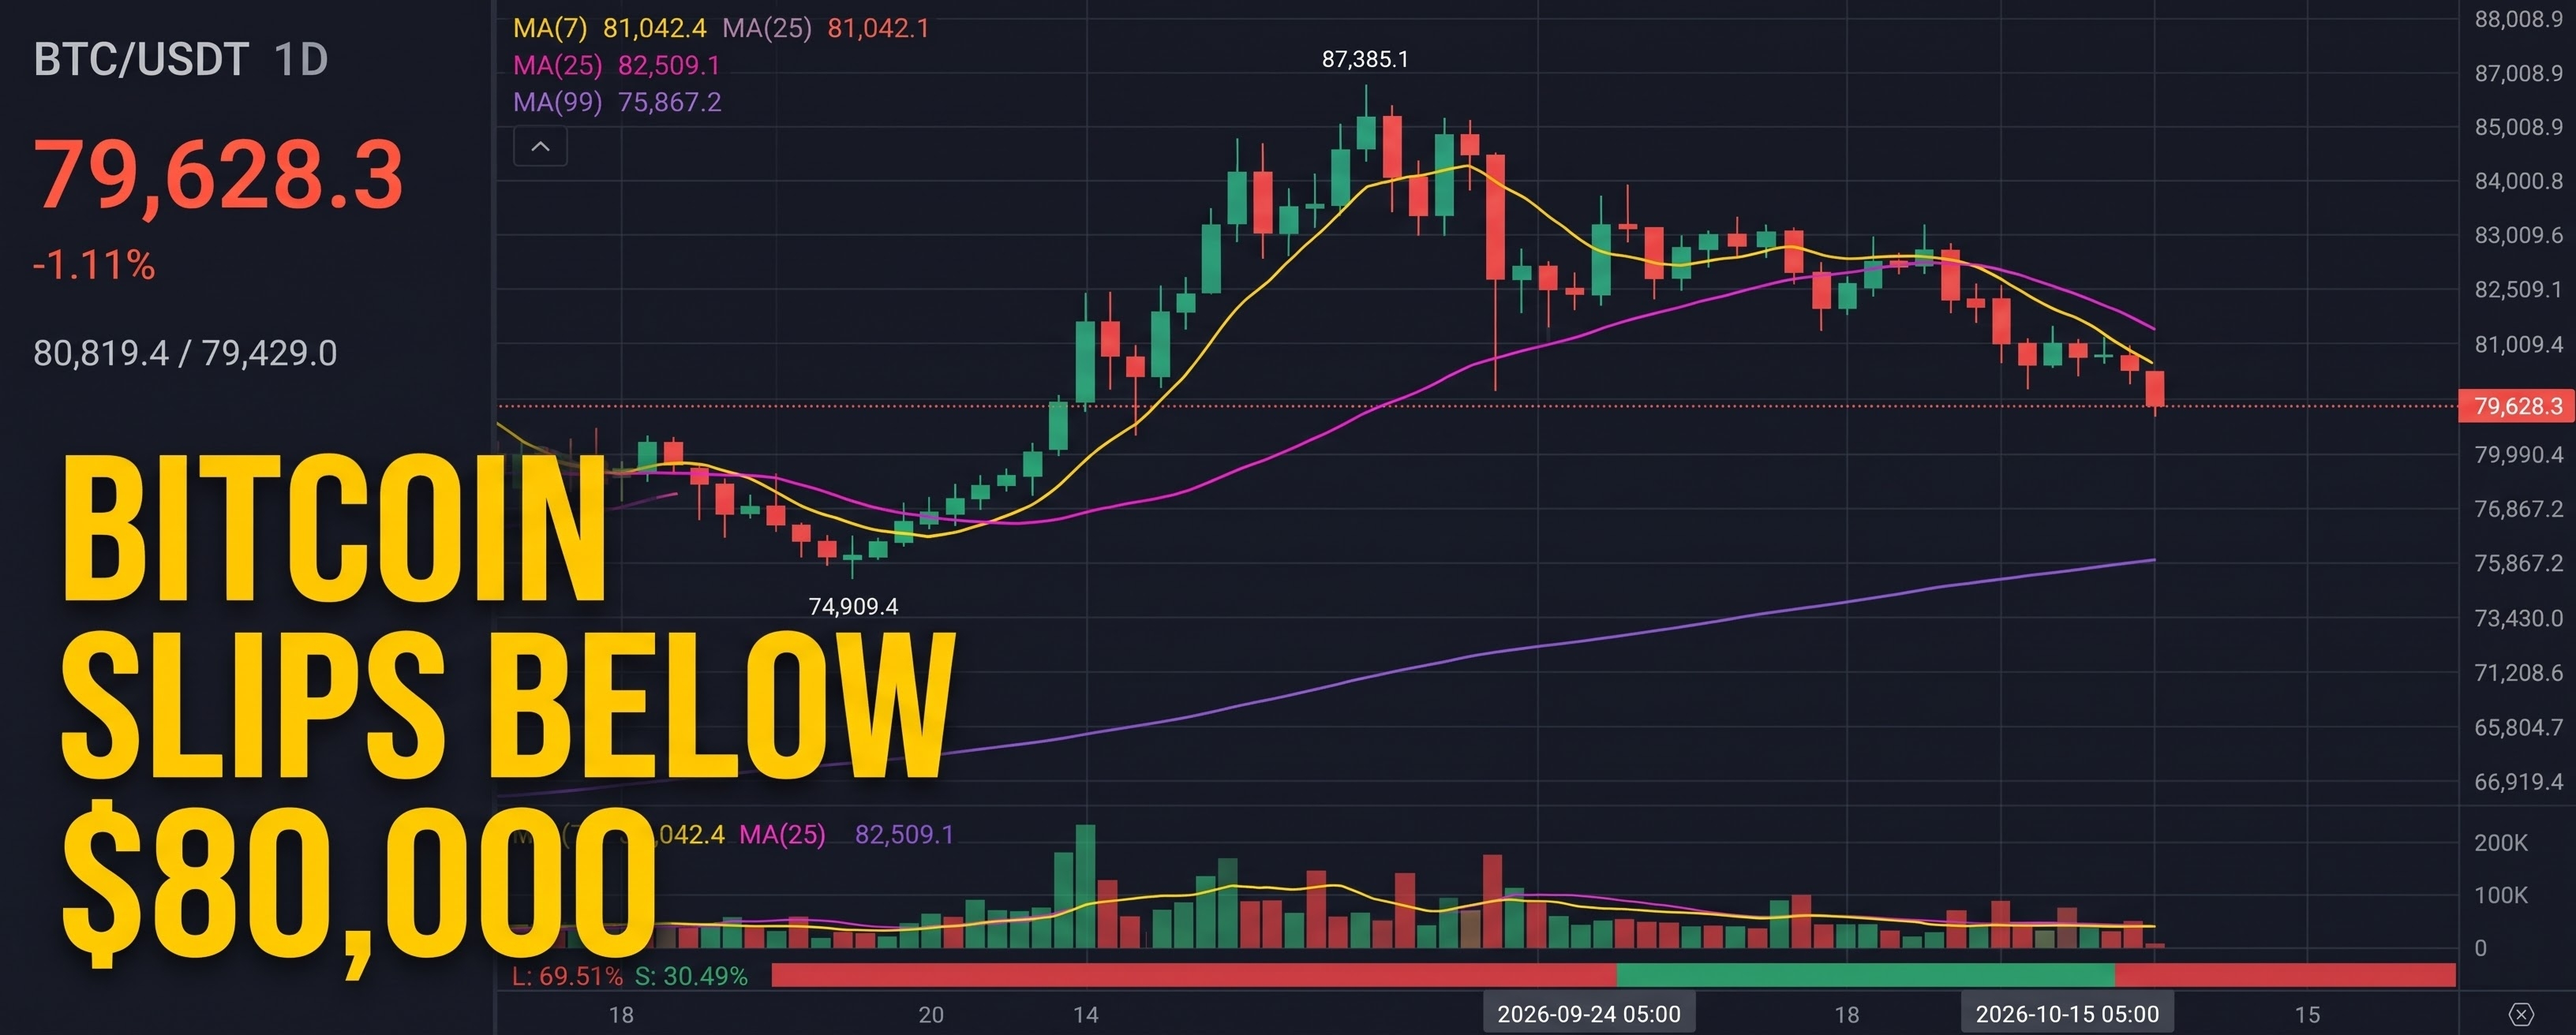
(The Breakdown) = Bitcoin has officially slipped below the critical $80,000 level, currently trading at $79,628 on the Binance Perpetual chart.
The Chart Reality:
(Technical Damage) ➔ Based on the chart data, BTC has decisively lost its short-term momentum indicators, falling below both the MA(7) at $81,042 and the MA(25) at $82,509.
The Breakdown:
With the 24-hour low tagging $79,429, the bears are firmly in control of the immediate trend. The price is now trapped in a downward trajectory, making the longer-term MA(99) sitting all the way down at $75,867 the next major structural defense line for the bulls. If buyers cannot rapidly reclaim the $81K zone, a deeper flush becomes highly probable.
Are you buying this dip or waiting for lower levels? Let's debate! 👇💬