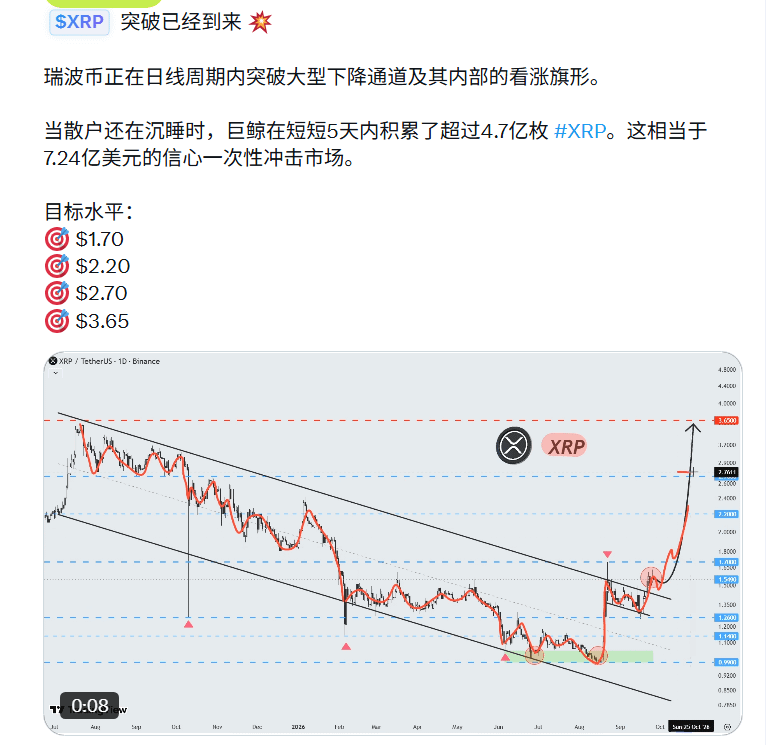
The daily chart has exited a large descending channel, and inside it there is also a bullish flag pattern; it even claims that retail investors are still hesitating. In the past five days, a “giant whale” has accumulated more than 470 million XRP, equivalent to about $724 million. Then it throws out four target levels: $1.70, $2.20, $2.70, and $3.65.
Put it out to look at—it’s logically consistent and the chart is drawn nicely. But a few things need to be clarified. Chart patterns are an abstraction and summary of the past, not physical laws; if a level is broken, there can still be a fakeout breakout and then a turn back. As for the so-called whale accumulation, accumulation definitions and on-chain data interpretations vary across platforms; the same batch of data with a different algorithm becomes another conclusion, so it can’t be independently verified. Target prices are the script he sets for himself, not a promise the market makes.
It’s fine to look at others’ judgments. But treating those target levels as the basis for your own position is a different matter entirely.
Put it out to look at—it’s logically consistent and the chart is drawn nicely. But a few things need to be clarified. Chart patterns are an abstraction and summary of the past, not physical laws; if a level is broken, there can still be a fakeout breakout and then a turn back. As for the so-called whale accumulation, accumulation definitions and on-chain data interpretations vary across platforms; the same batch of data with a different algorithm becomes another conclusion, so it can’t be independently verified. Target prices are the script he sets for himself, not a promise the market makes.
It’s fine to look at others’ judgments. But treating those target levels as the basis for your own position is a different matter entirely.