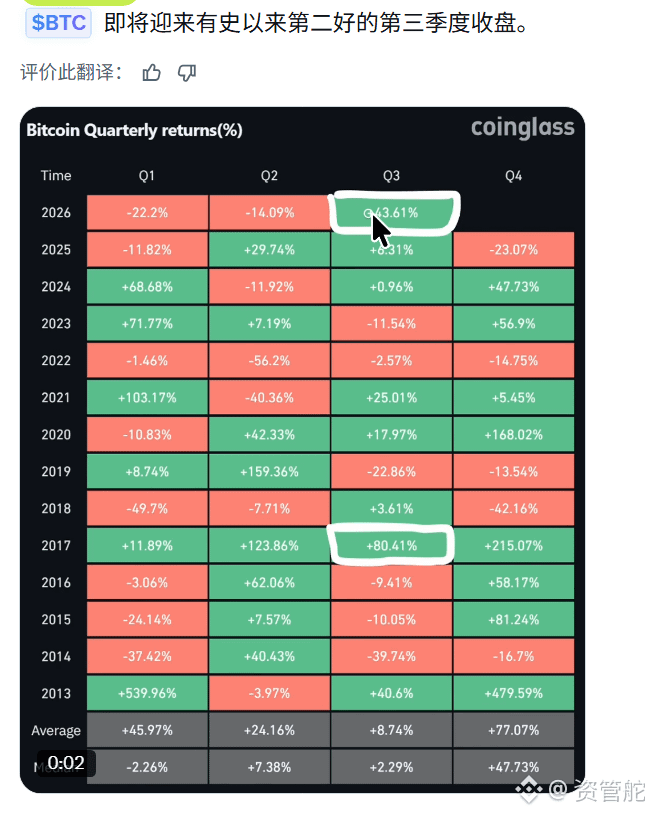
CoinGlass. This Bitcoin quarterly earnings chart highlights the +43.61% for Q3 2026. If you flip back over the past decade-plus, only the +80.41% in Q3 2017 was higher—hence the phrase “the second-best Q3 in history.”
The numbers themselves are correct, but take a closer look to stay calm. The historical Q3 average is +8.74%, and this year’s +43.61% does indeed outperform by a wide margin; but the previous two quarters were -22.2% and -14.09% respectively. When you drop two quarters in a row, a strong quarter doesn’t automatically mean you’ve filled the hole for the year.
The Q4 average of +77.07% looks the most tempting—though that mean is boosted by a single outlier: +479.59% in 2013. And there’s no inherent connection between a strong Q3 and a strong Q4: in 2021, Q3 was +25.01%, and Q4 was only +5.45%.
You can look at the chart, but don’t treat historical averages as a script, and don’t treat “the second-best” as a direct reason to expect things to rise next.
The numbers themselves are correct, but take a closer look to stay calm. The historical Q3 average is +8.74%, and this year’s +43.61% does indeed outperform by a wide margin; but the previous two quarters were -22.2% and -14.09% respectively. When you drop two quarters in a row, a strong quarter doesn’t automatically mean you’ve filled the hole for the year.
The Q4 average of +77.07% looks the most tempting—though that mean is boosted by a single outlier: +479.59% in 2013. And there’s no inherent connection between a strong Q3 and a strong Q4: in 2021, Q3 was +25.01%, and Q4 was only +5.45%.
You can look at the chart, but don’t treat historical averages as a script, and don’t treat “the second-best” as a direct reason to expect things to rise next.