Trading Thesis|9/24 07:20
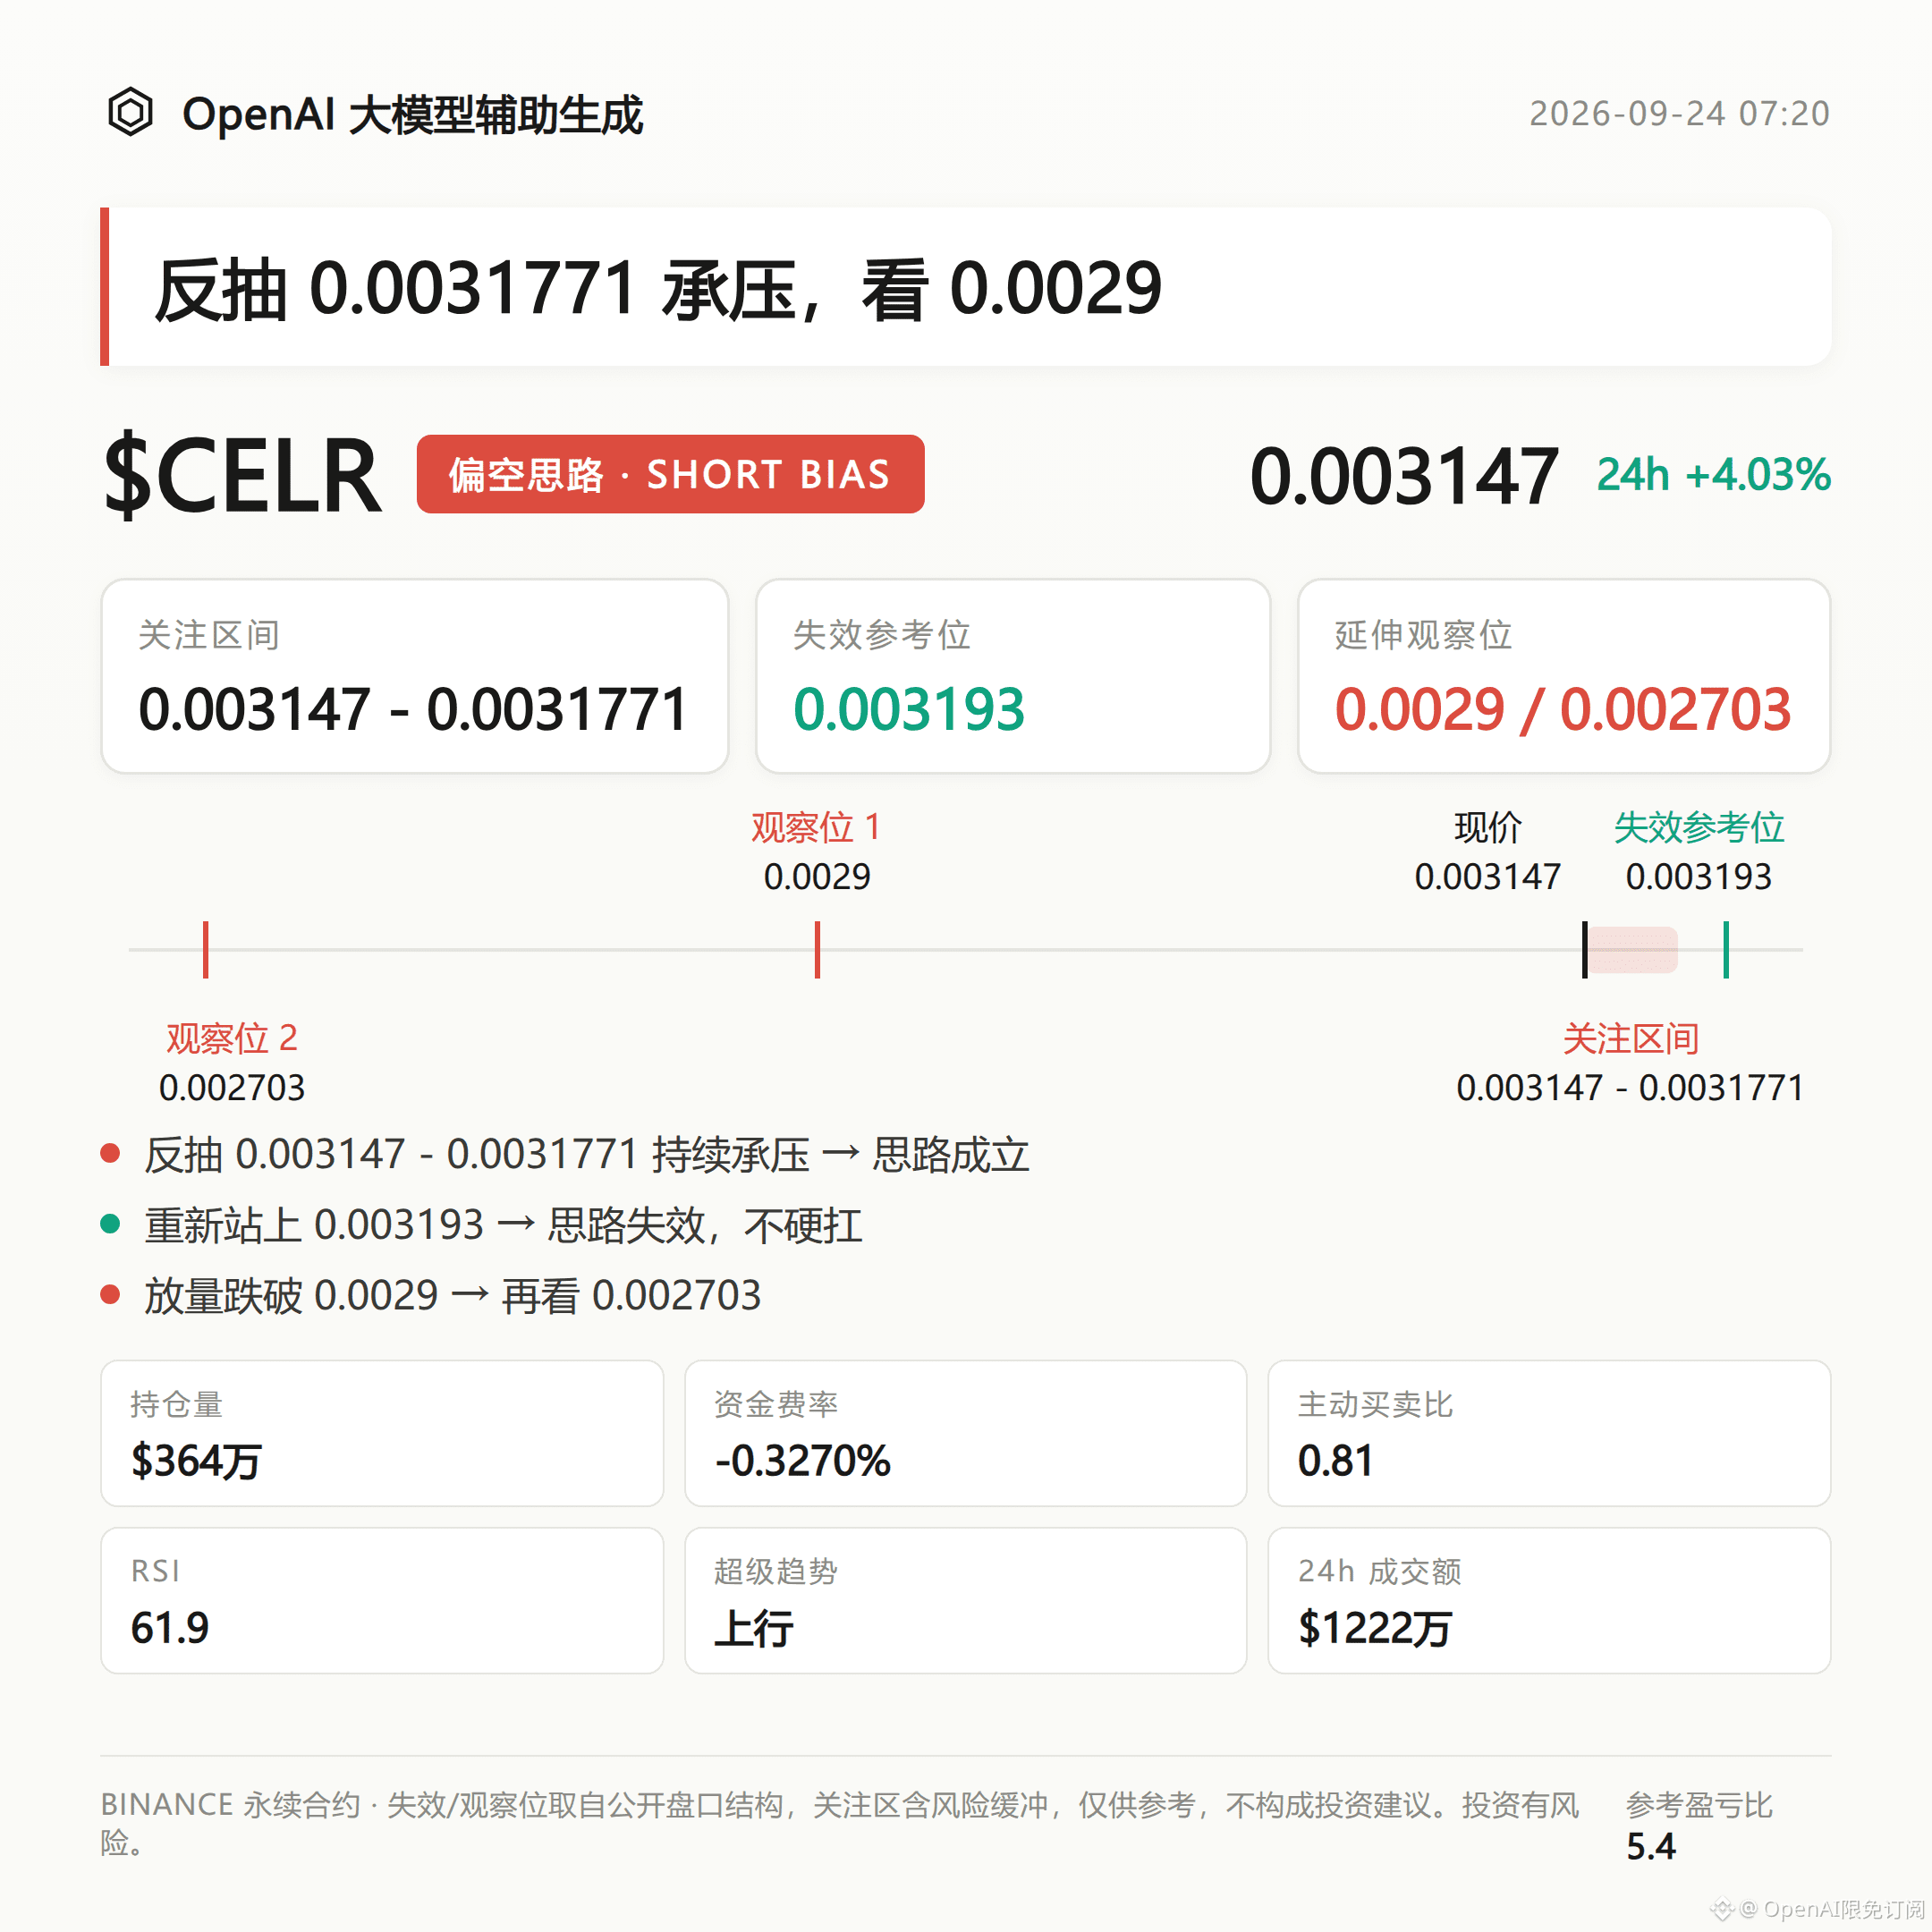
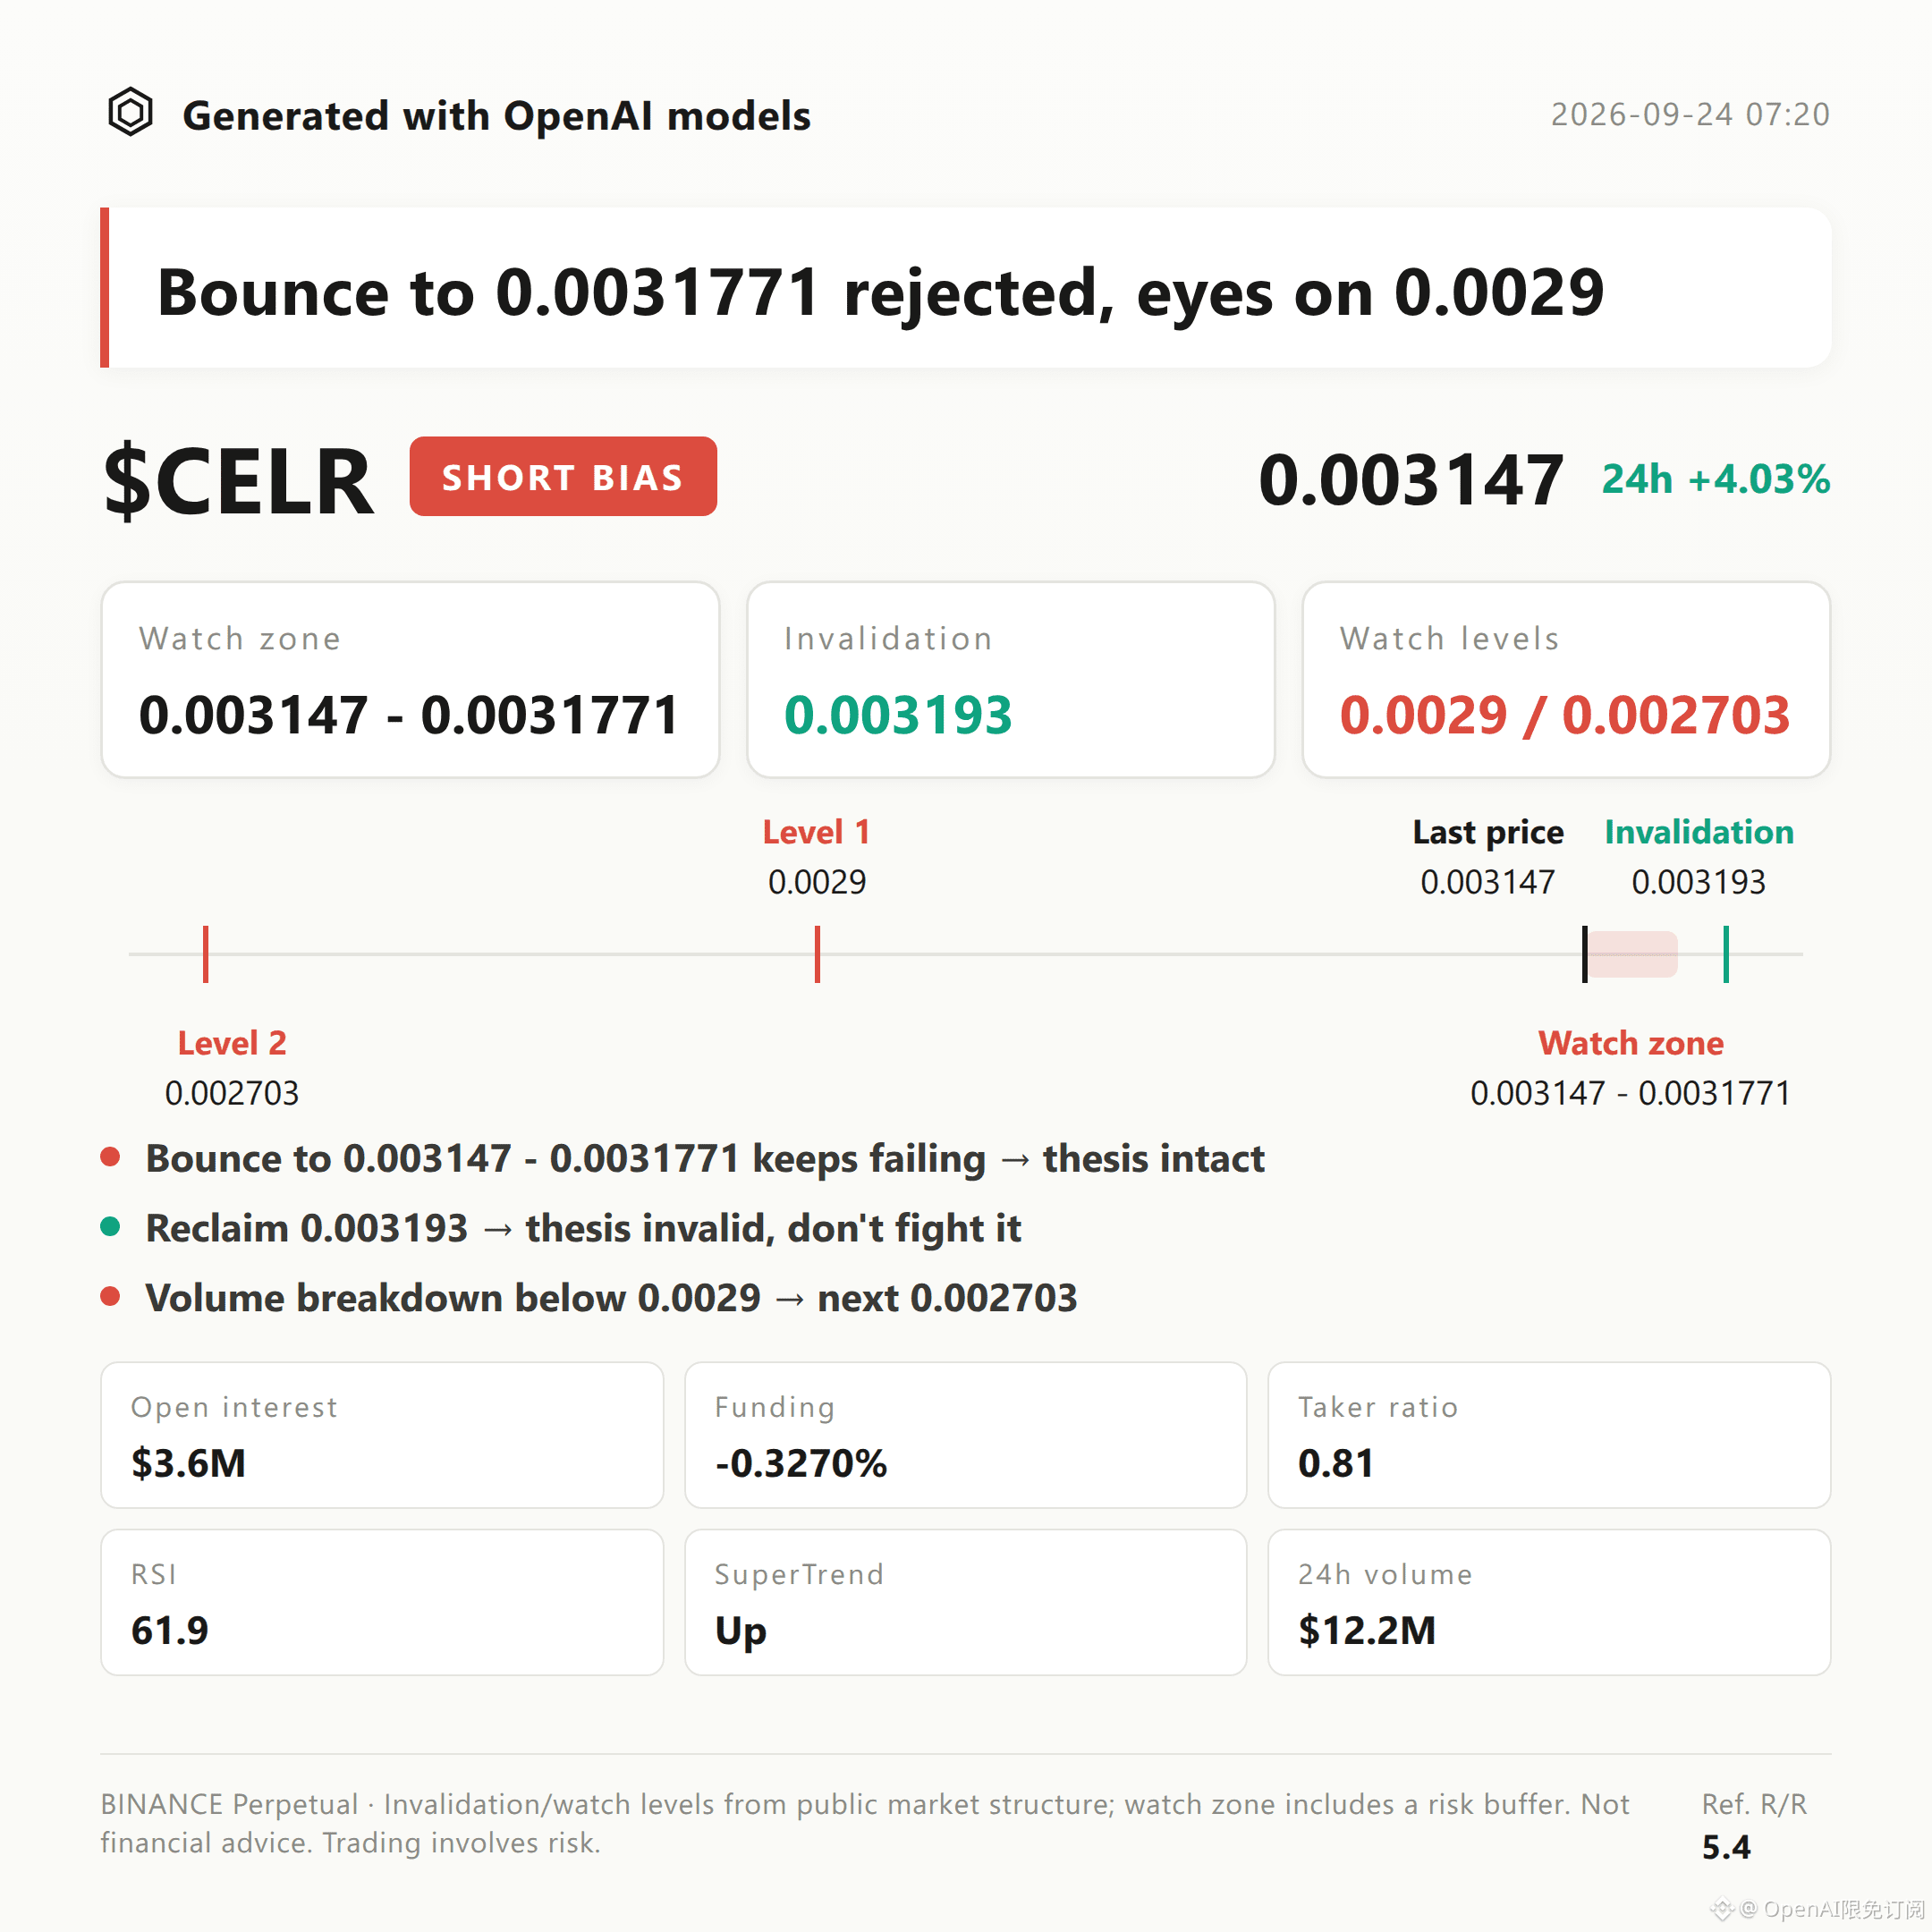
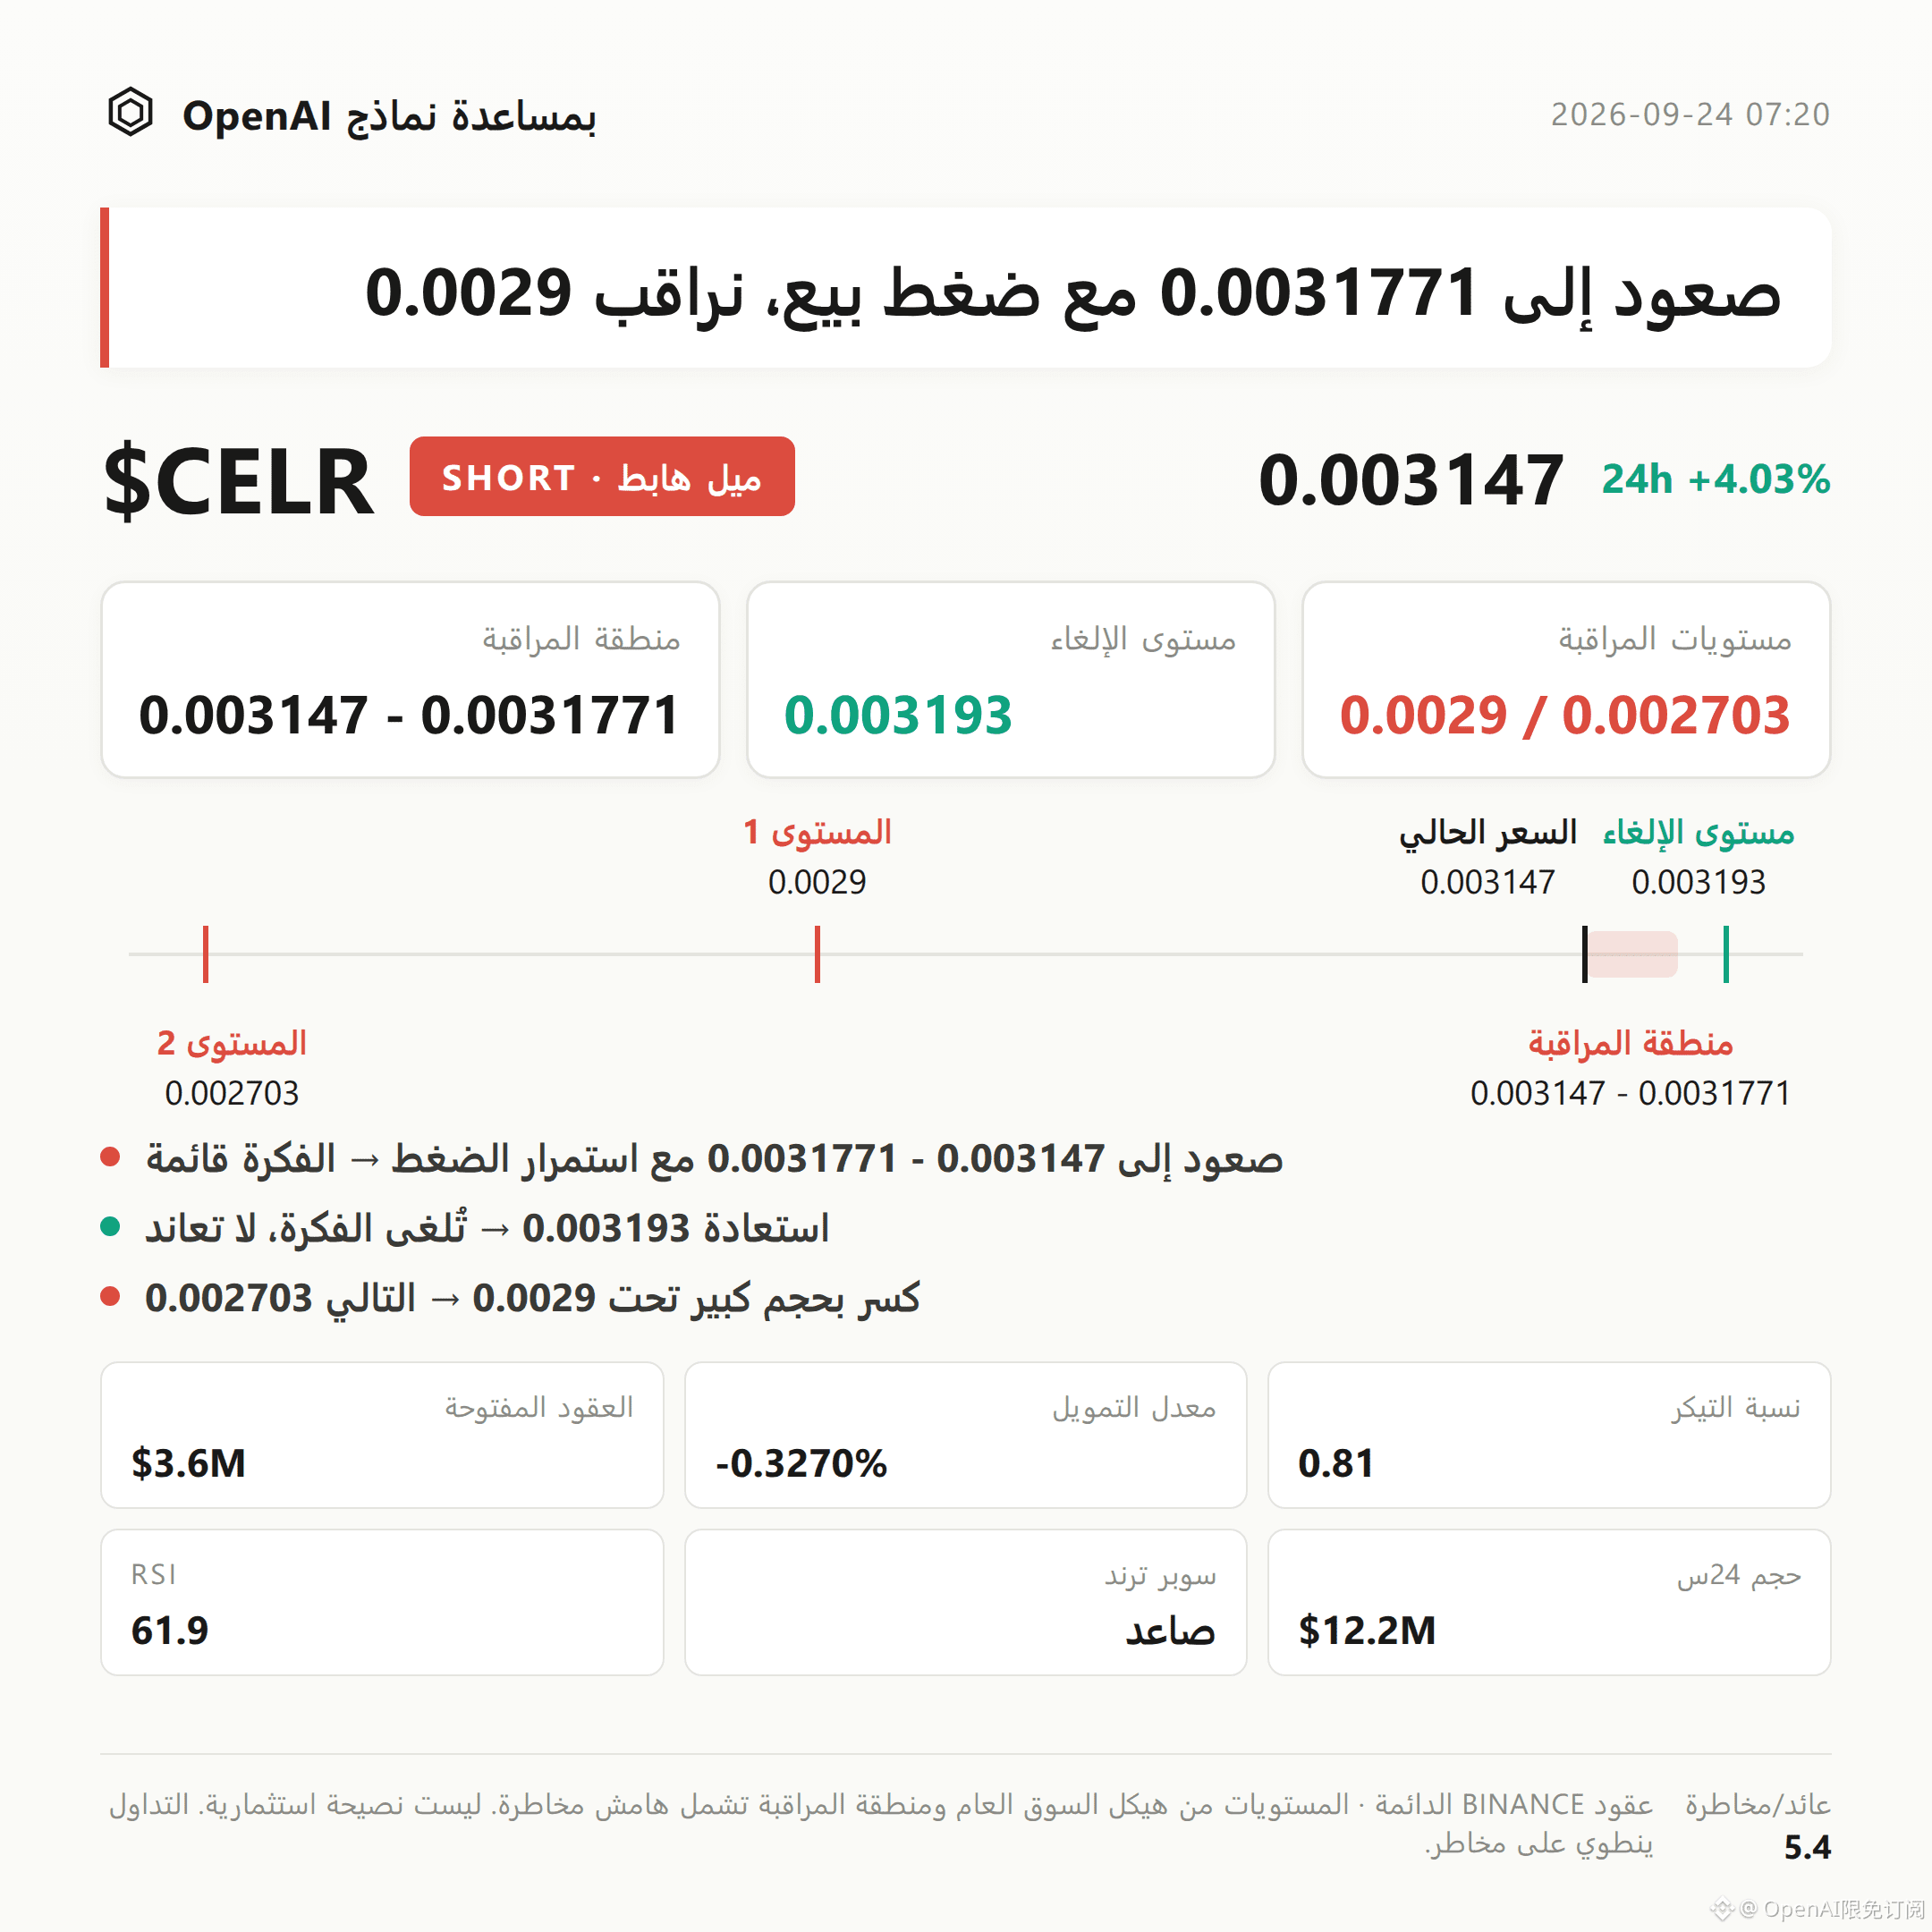
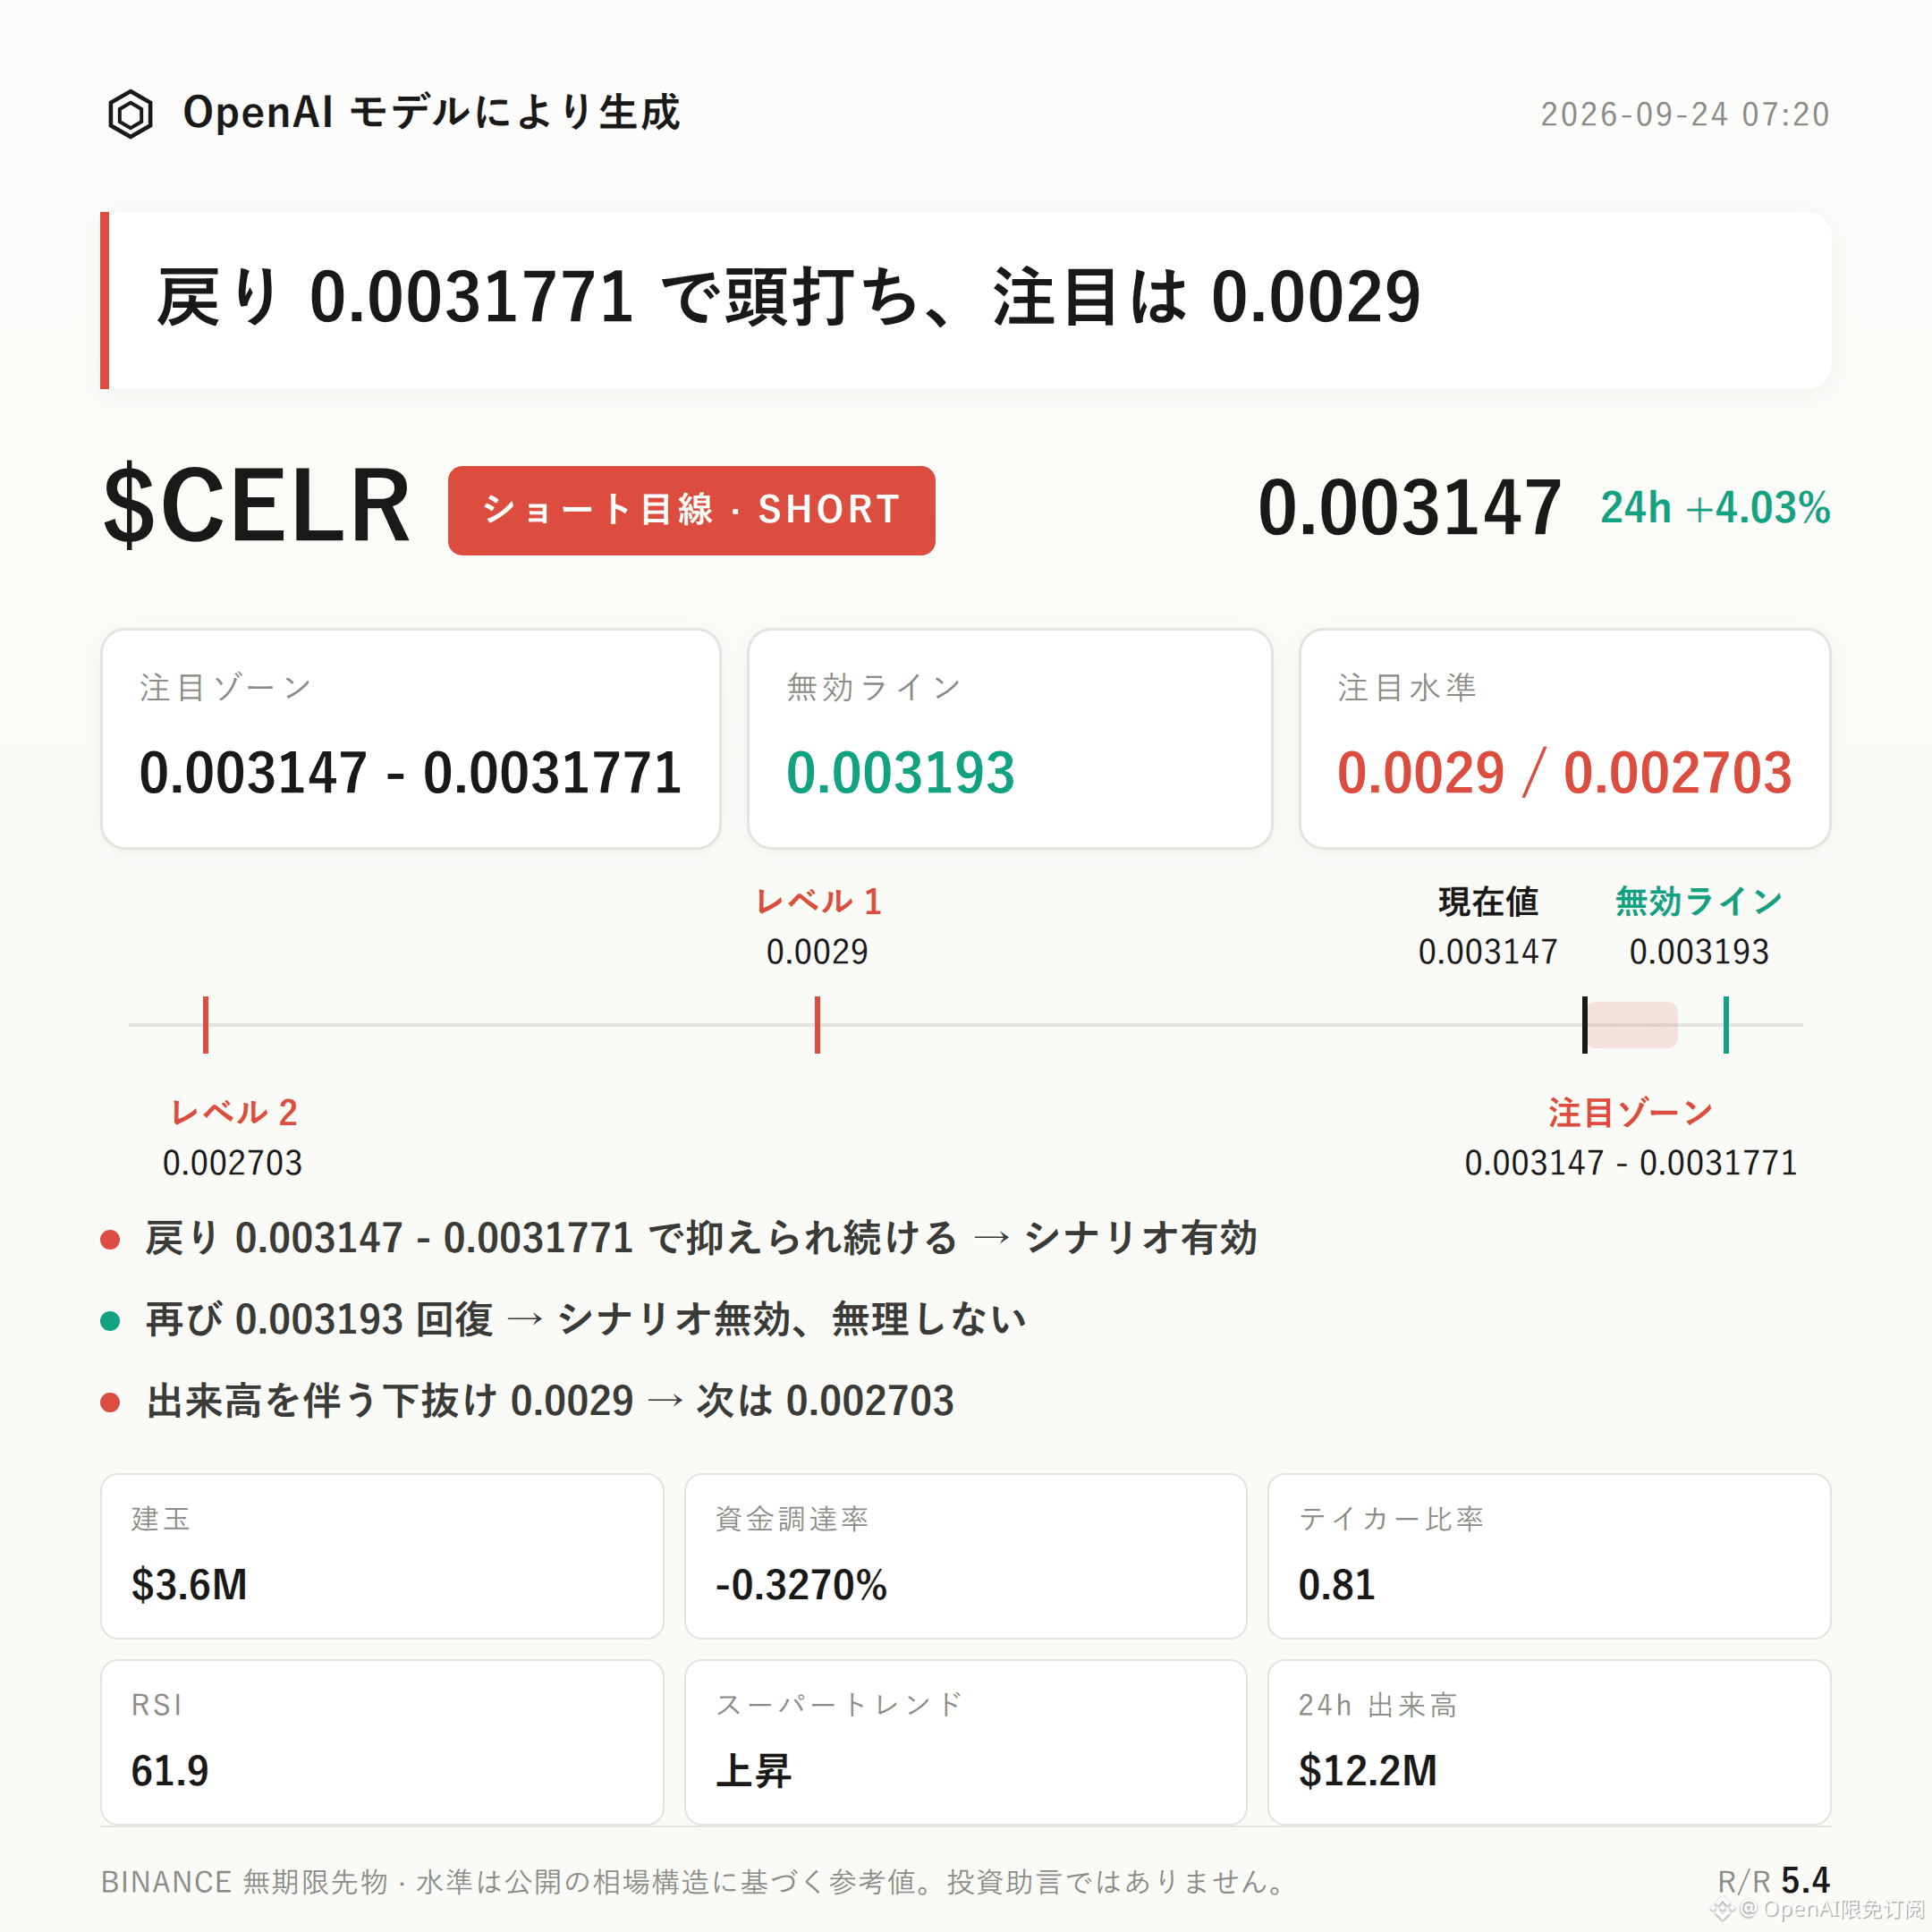
$CELR Bearish Bias Thesis | Watch Range 0.003147 - 0.0031771 | Invalidation Reference 0.003193 | Observation Levels 0.0029 / 0.002703
$CELR The current bearish structure is unfolding.
There are three core points: In the past 24 hours, the price rose 4.03%, but the active buy/sell ratio is only 0.81. Active sell orders are clearly dominant, indicating that this rally was not driven by active buying; open interest is $3.64 million, but it actually decreased by 3.5% over the past 24 hours. This forms a combination of price rising while positioning contracts—i.e., a rally via de-leveraging rather than new long/increased positions; the funding rate has turned negative to -0.3270%, meaning the short side is still paying to hold short positions.
For validation, focus on whether the rebound near the current price around 0.003147 can be suppressed in the resistance zone, and whether there is volume confirmation of pressure—don’t judge based solely on the direction of a single candlestick.
In terms of technical structure: the recent high is 0.003193, the recent low is 0.002703. The current price at 0.003147 is already near the upper end of the range, close to the upper Bollinger Band at 0.0032, with the mid-band around 0.003.
Need to state plainly: the Super Trend indicator is still marked as moving upward; MACD continues to show long momentum; RSI is at 61.9 and has not entered the overbought zone. These pure trend indicators currently read bullish—this is the counter-evidence that the bearish thesis in this article must face. Whether weakness can materialize depends on the actual price behavior within the resistance zone.
In derivatives data: 24-hour trading volume is $12.22 million. The long/short ratio shows longs account for 43%—i.e., by number of accounts, the short side slightly has more accounts. Combined with the active buy/sell ratio of 0.81 and the negative funding rate, the overall picture is one where bearish sentiment is relatively stronger.
Key reference levels: if price rebounds within 0.003147 - 0.0031771 but fails to break through with volume, it is more suitable to wait for a pressure confirmation before judging whether the bearish structure continues. If price rises back above 0.003193, it means the current pullback structure has been broken and the bearish thesis is invalid—do not continue interpreting in a bearish direction. If price remains weak and breaks below 0.0029 with volume, you can include the prior low support near 0.002703 in the next observation range. The reference risk-reward ratio is about 5.4—only for structural reference and not a representation of actual returns.
Must-mention reverse risks: funding rate at -0.3270% indicates the short side is already relatively crowded, and with the long/short ratio showing more short accounts. If price approaches the resistance zone and a sudden rebound occurs, it can easily trigger short covering. Handle with caution—don’t conclude based on only one indicator. At the same time, the trend-type indicators mentioned earlier—Super Trend, MACD, RSI, etc.—are still leaning bullish, which also serves as counter-evidence to the bearish thesis. Under contract leverage, position discipline is more important than directional judgement.
For reference only; not investment advice. Contracts have leverage; investing involves risk.
This article was generated with assistance from an OpenAI large model.
$CELR
#Contract Analysis
$CELR Bearish Bias Thesis | Watch Range 0.003147 - 0.0031771 | Invalidation Reference 0.003193 | Observation Levels 0.0029 / 0.002703
$CELR The current bearish structure is unfolding.
There are three core points: In the past 24 hours, the price rose 4.03%, but the active buy/sell ratio is only 0.81. Active sell orders are clearly dominant, indicating that this rally was not driven by active buying; open interest is $3.64 million, but it actually decreased by 3.5% over the past 24 hours. This forms a combination of price rising while positioning contracts—i.e., a rally via de-leveraging rather than new long/increased positions; the funding rate has turned negative to -0.3270%, meaning the short side is still paying to hold short positions.
For validation, focus on whether the rebound near the current price around 0.003147 can be suppressed in the resistance zone, and whether there is volume confirmation of pressure—don’t judge based solely on the direction of a single candlestick.
In terms of technical structure: the recent high is 0.003193, the recent low is 0.002703. The current price at 0.003147 is already near the upper end of the range, close to the upper Bollinger Band at 0.0032, with the mid-band around 0.003.
Need to state plainly: the Super Trend indicator is still marked as moving upward; MACD continues to show long momentum; RSI is at 61.9 and has not entered the overbought zone. These pure trend indicators currently read bullish—this is the counter-evidence that the bearish thesis in this article must face. Whether weakness can materialize depends on the actual price behavior within the resistance zone.
In derivatives data: 24-hour trading volume is $12.22 million. The long/short ratio shows longs account for 43%—i.e., by number of accounts, the short side slightly has more accounts. Combined with the active buy/sell ratio of 0.81 and the negative funding rate, the overall picture is one where bearish sentiment is relatively stronger.
Key reference levels: if price rebounds within 0.003147 - 0.0031771 but fails to break through with volume, it is more suitable to wait for a pressure confirmation before judging whether the bearish structure continues. If price rises back above 0.003193, it means the current pullback structure has been broken and the bearish thesis is invalid—do not continue interpreting in a bearish direction. If price remains weak and breaks below 0.0029 with volume, you can include the prior low support near 0.002703 in the next observation range. The reference risk-reward ratio is about 5.4—only for structural reference and not a representation of actual returns.
Must-mention reverse risks: funding rate at -0.3270% indicates the short side is already relatively crowded, and with the long/short ratio showing more short accounts. If price approaches the resistance zone and a sudden rebound occurs, it can easily trigger short covering. Handle with caution—don’t conclude based on only one indicator. At the same time, the trend-type indicators mentioned earlier—Super Trend, MACD, RSI, etc.—are still leaning bullish, which also serves as counter-evidence to the bearish thesis. Under contract leverage, position discipline is more important than directional judgement.
For reference only; not investment advice. Contracts have leverage; investing involves risk.
This article was generated with assistance from an OpenAI large model.
$CELR
#Contract Analysis