Trading Thesis|9/23 17:21
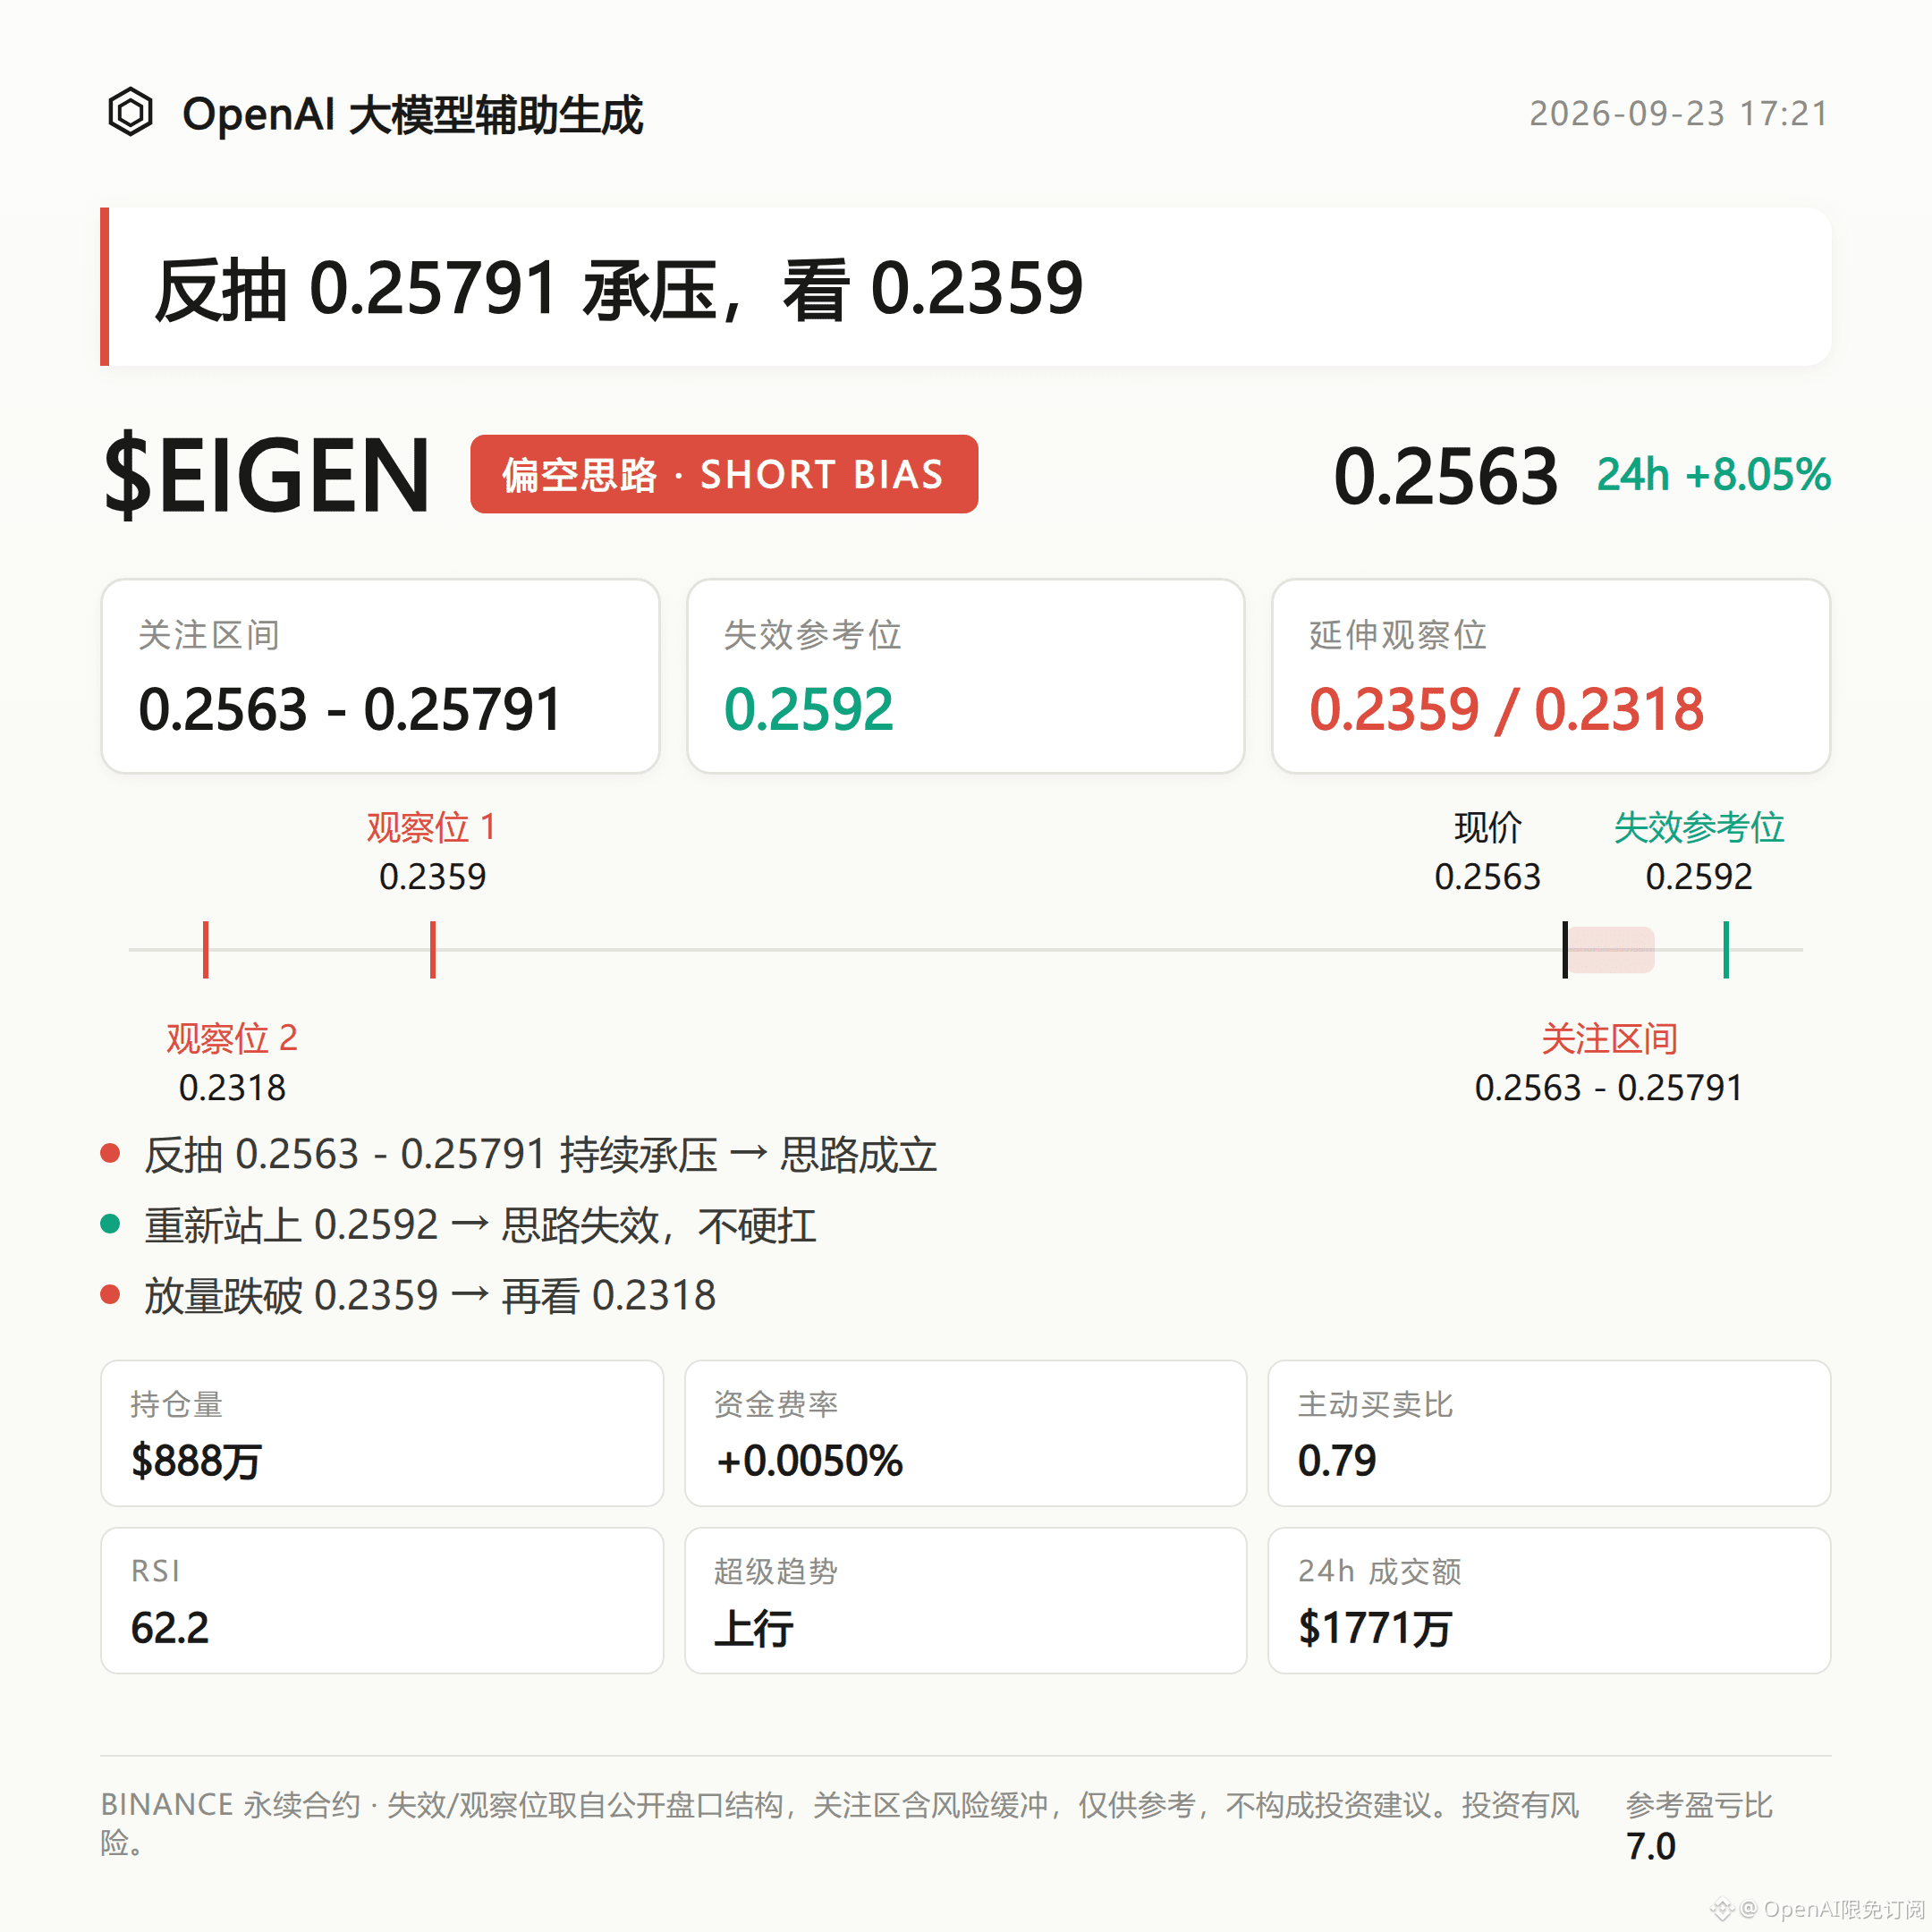
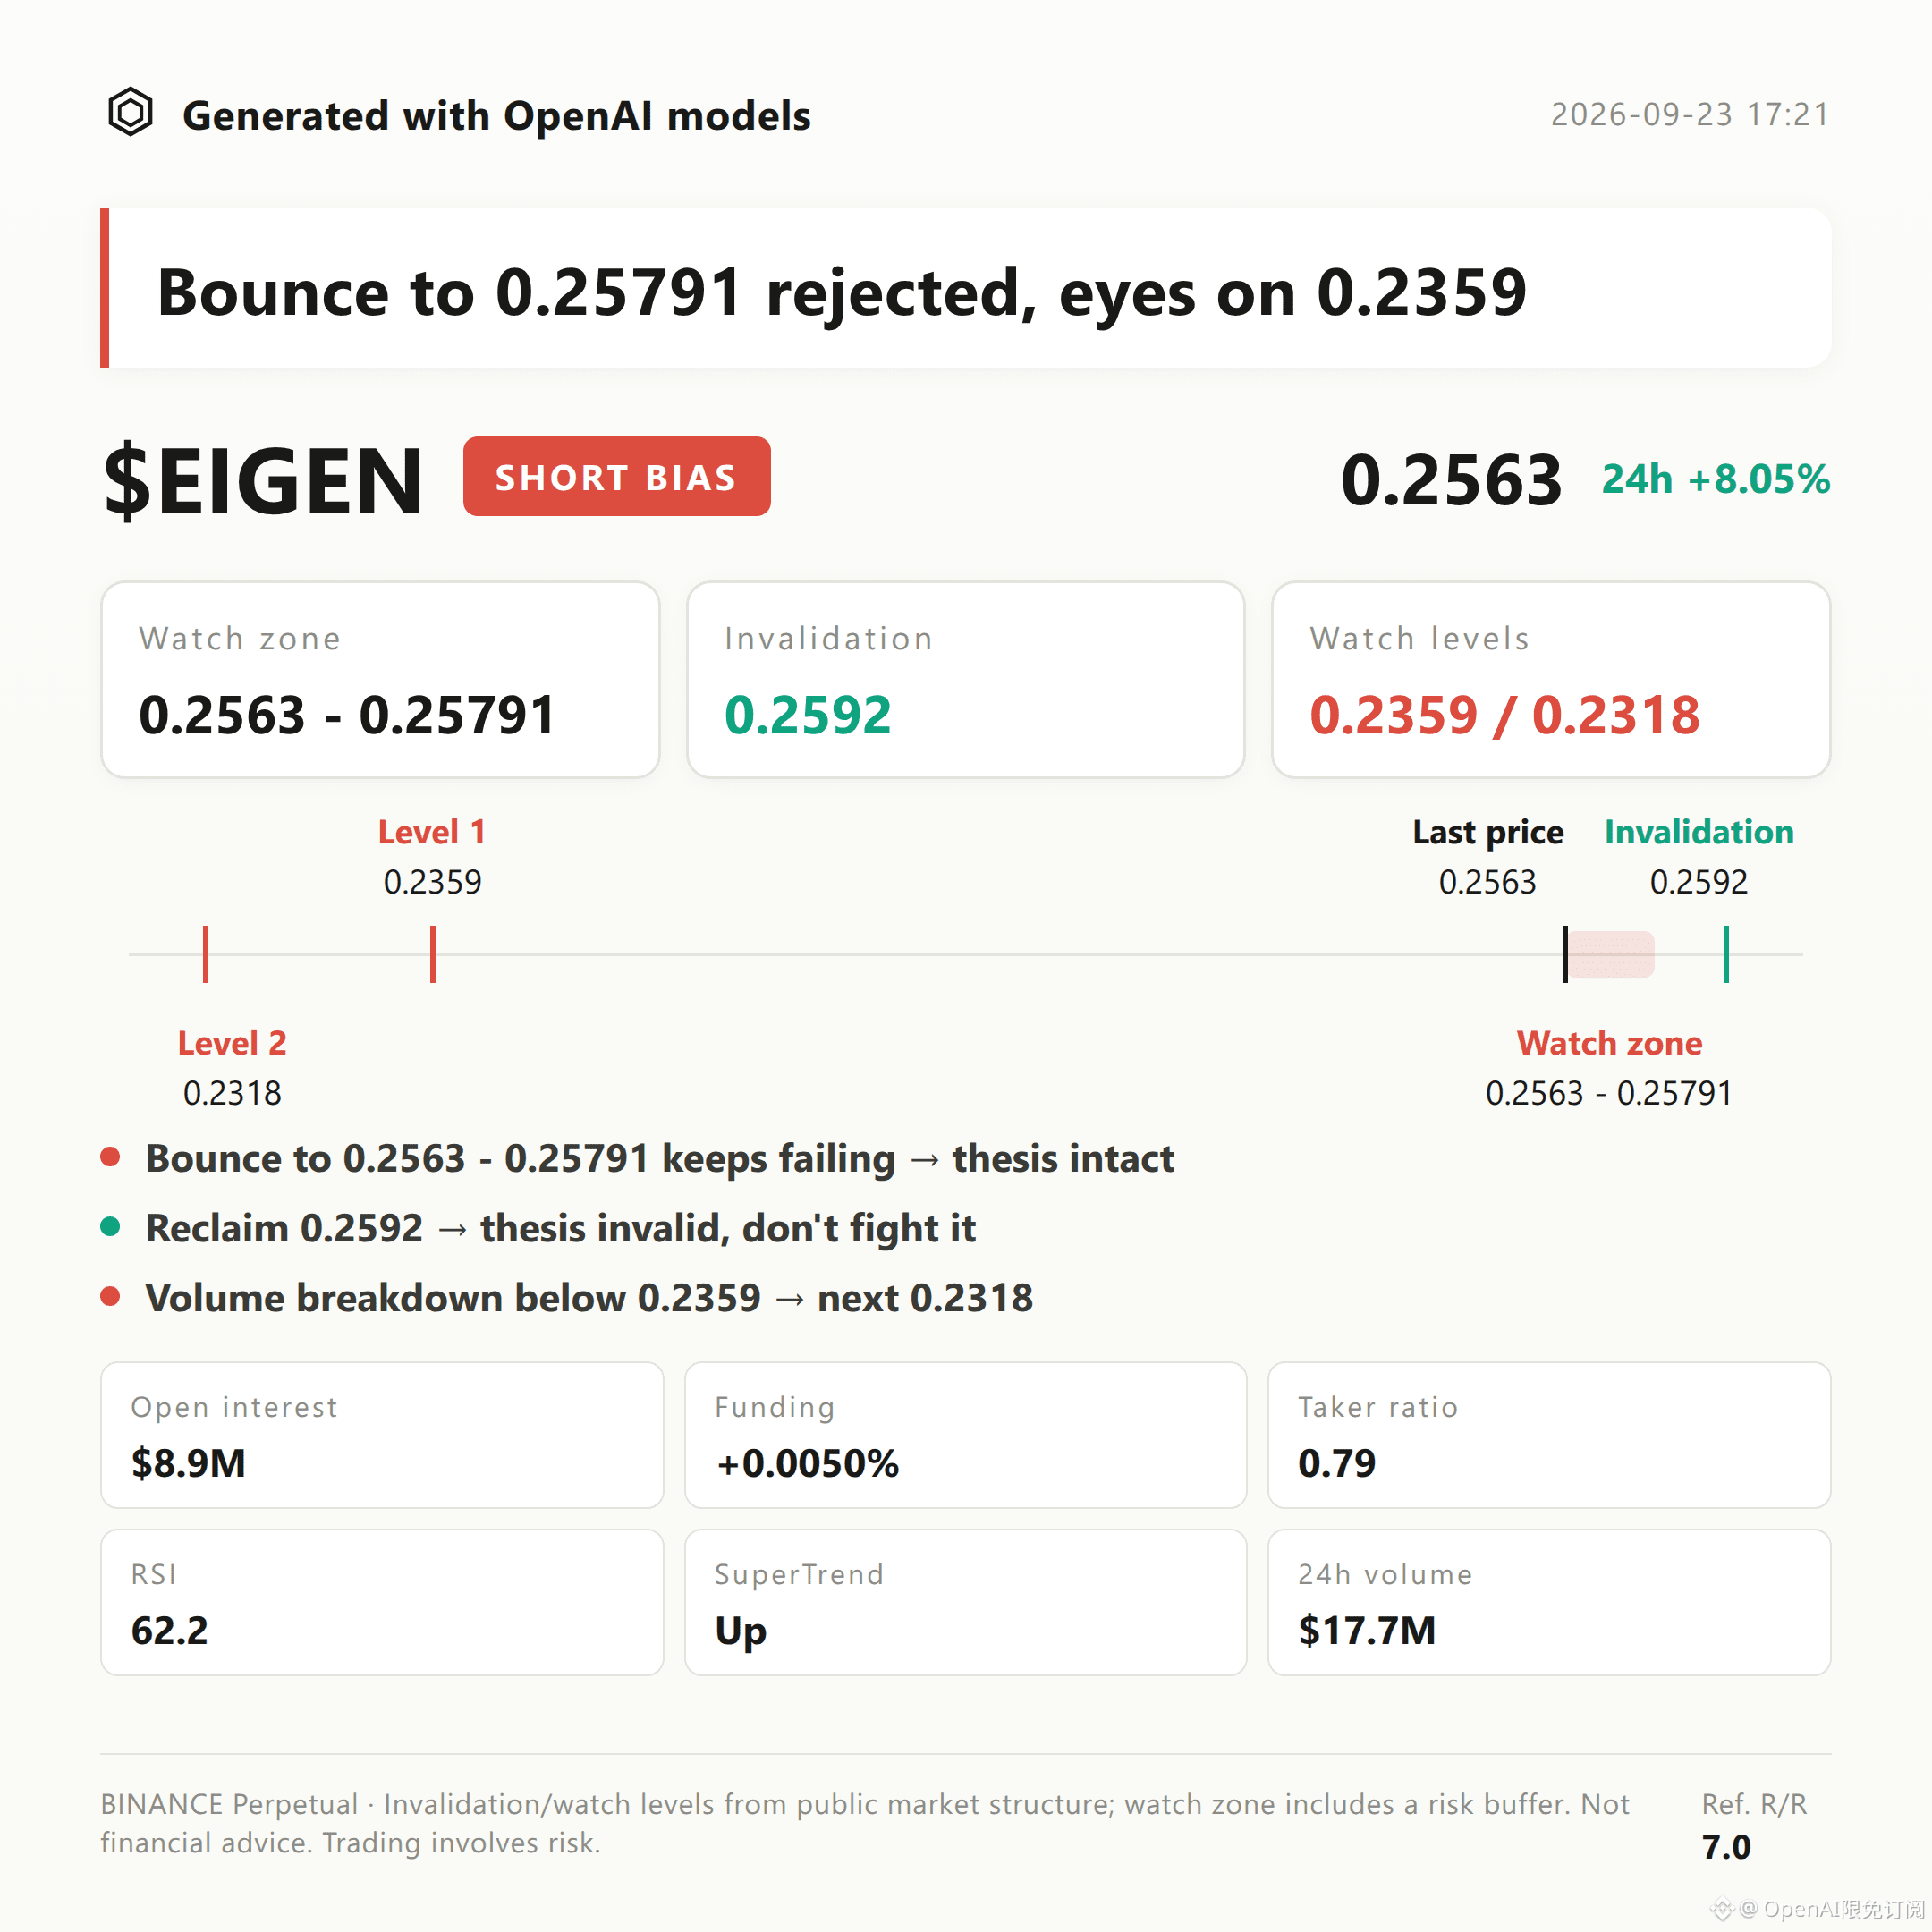
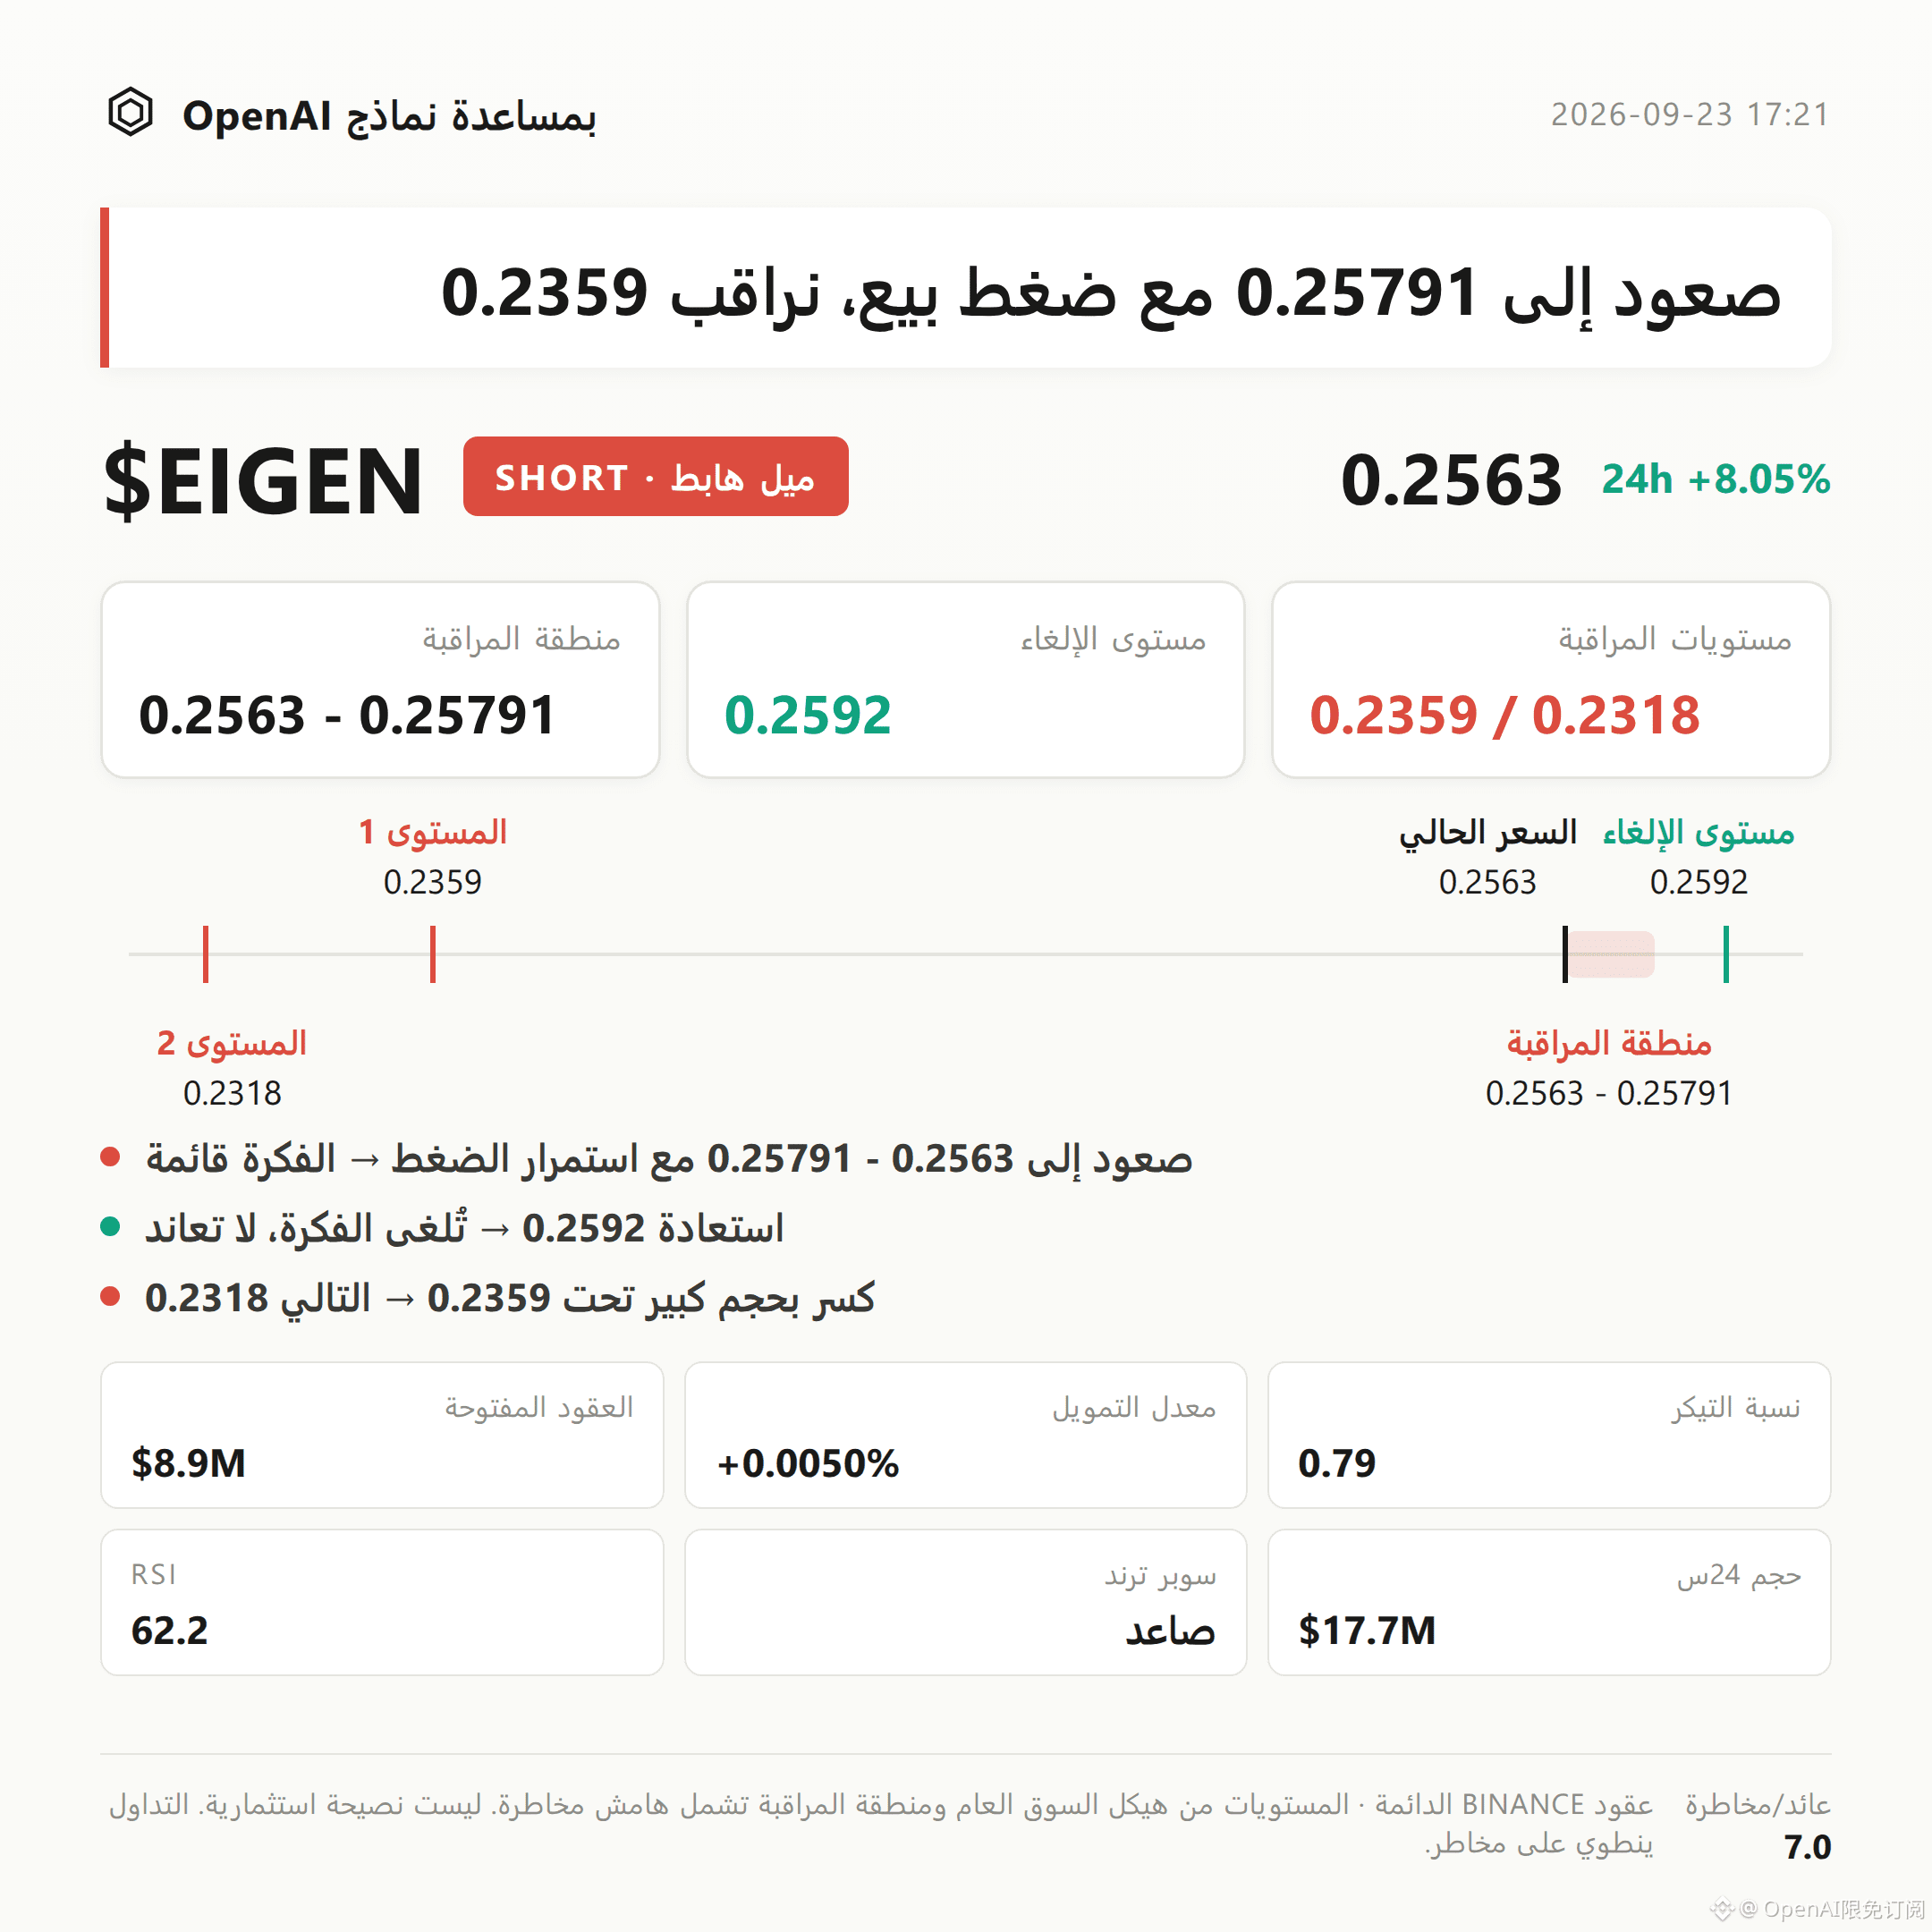
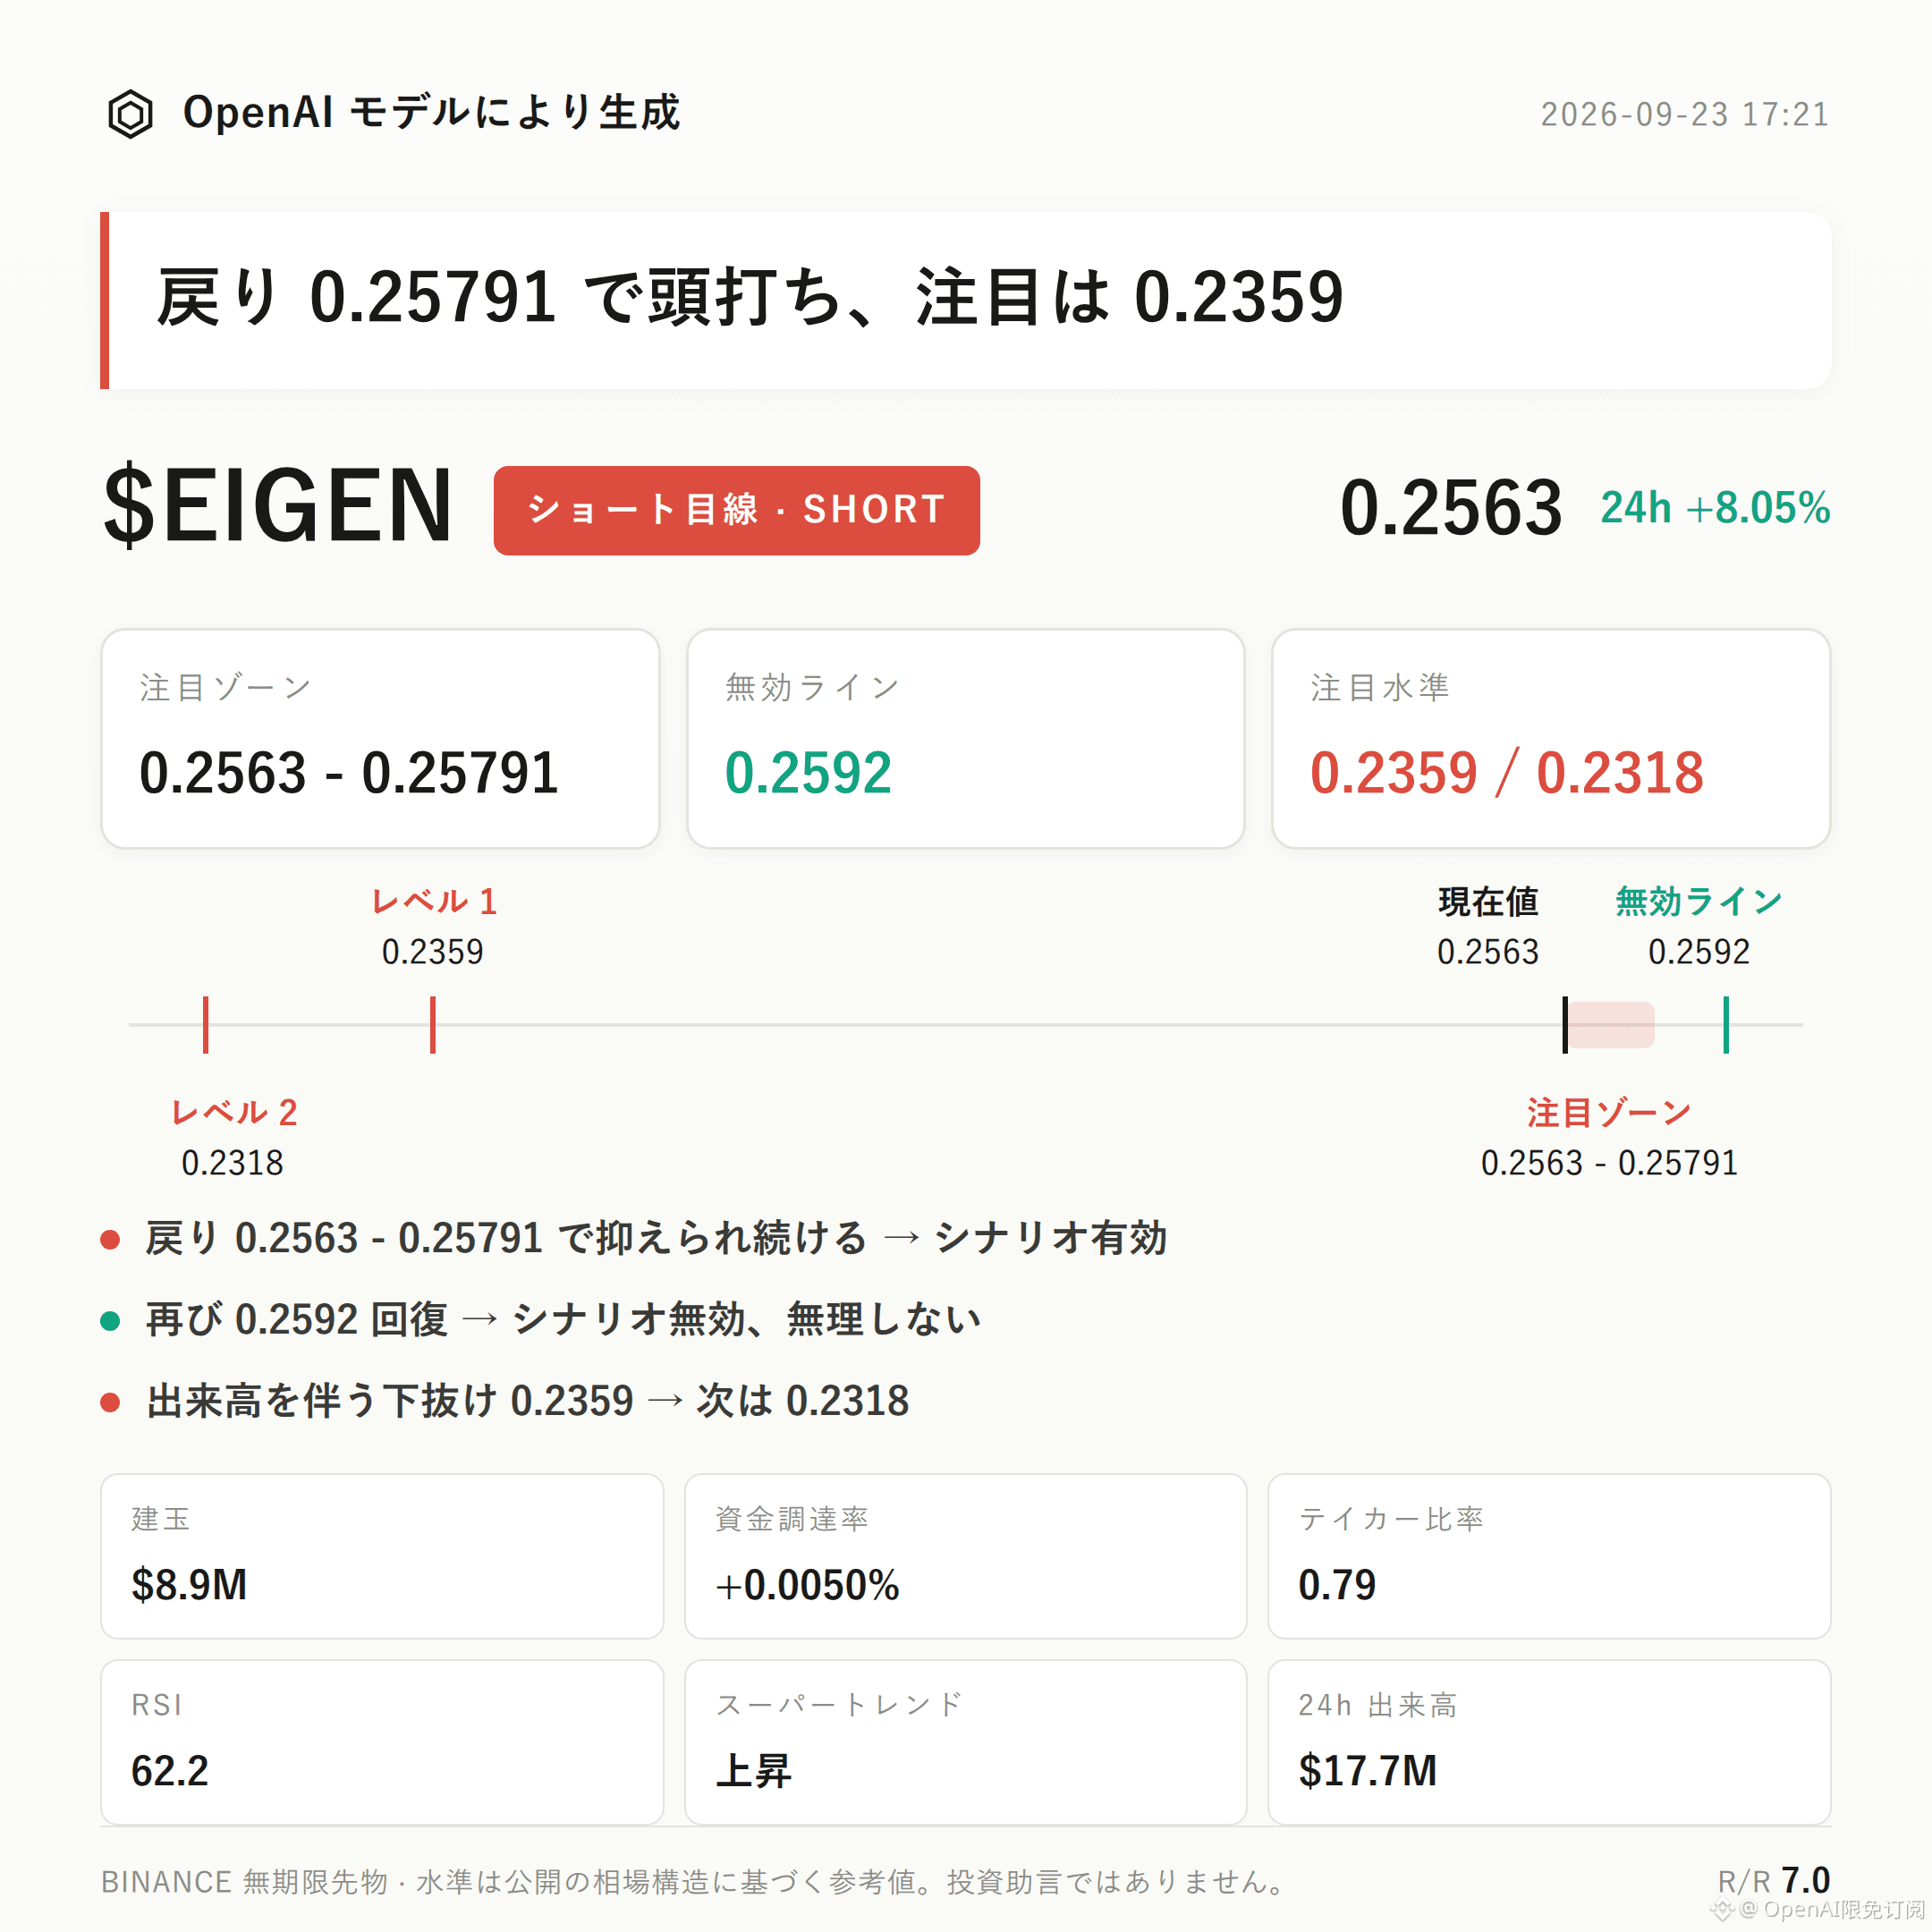
$EIGEN Bearish Bias | Watch Zone 0.2563 - 0.25791 | Invalidation Reference 0.2592 | Observation Levels 0.2359 / 0.2318
$EIGEN The current bearish structure is unfolding.
The core argument is that the buy/sell ratio of 0.79 shows active selling dominance; combined with the current price 0.2563 being close to the recent high of 0.2592 and the pressure zone formed by 0.2607 at the Bollinger upper band. After a 24-hour rise of 8.05%, there is a risk that momentum is overextended for chasing higher prices.
The validation focuses on whether any pullback can be held down in the 0.2563-0.25791 area. If it can’t be pressed, this thesis does not hold.
From a technical structure perspective, the current price is right along the recent high 0.2592 and the Bollinger upper band 0.2607—together forming a short-term resistance zone.
Below, the Bollinger mid-band at 0.2483 and the lower band at 0.2359, along with the recent low at 0.2318, form the lower observation band.
It’s necessary to state clearly: the SuperTrend is still pointing upward; RSI is 62.2; MACD shows bullish momentum. These indicators by themselves do not support a bearish view. The bearish thesis is mainly based on price being close to the resistance zone and the active sell signal. It is a counter-trend setup rather than a trend-following one.
In the derivatives market: 24-hour trading volume is $17.71M, open interest is $8.88M, up 7.4% over 24 hours—indicating that as price rises, new positions are continuously being added.
Funding rate is +0.0050%, relatively mild. Long account share is 64%, and overall market sentiment between bulls and bears is still clearly bullish.
However, the buy/sell ratio at 0.79 indicates active sell dominance. Price is rising while active volume is skewed toward sellers—this divergence is the main basis for the bearish thesis in this post.
For reference levels: for shorts, first watch 0.2563-0.25791. It’s more suitable to wait for a pullback to meet resistance in this zone and then confirm, rather than assuming resistance has already taken effect at the current price.
If the pullback is met with resistance and falls back in the watch zone, the bearish structure can be considered valid on a temporary/phase basis. If price reclaims 0.2592, it means the current pullback structure is broken; then the bearish thesis should be deemed invalid and you should stop “fighting the loss.”
Once the thesis holds, extend the observation downward near 0.2359. If it breaks down there with volume, then look to see whether support around 0.2318 can take over.
Need to disclose proactively: in the data of this post, there are no clear reverse signals at present. But contract leverage itself is risk. Also, as mentioned above, most indicators right now—RSI, MACD, SuperTrend, buy/sell ratio, and open-interest increase—are still leaning bullish. Therefore, the bearish thesis is an inverse observation seeking resistance levels within a generally strong structure; whether it can hold is not certain.
With contract leverage, position discipline is more important than directional judgment.
For reference only, not investment advice. Contracts have leverage; investing involves risk.
This article was generated with the assistance of an OpenAI large model.
$EIGEN #Contract Analysis
$EIGEN Bearish Bias | Watch Zone 0.2563 - 0.25791 | Invalidation Reference 0.2592 | Observation Levels 0.2359 / 0.2318
$EIGEN The current bearish structure is unfolding.
The core argument is that the buy/sell ratio of 0.79 shows active selling dominance; combined with the current price 0.2563 being close to the recent high of 0.2592 and the pressure zone formed by 0.2607 at the Bollinger upper band. After a 24-hour rise of 8.05%, there is a risk that momentum is overextended for chasing higher prices.
The validation focuses on whether any pullback can be held down in the 0.2563-0.25791 area. If it can’t be pressed, this thesis does not hold.
From a technical structure perspective, the current price is right along the recent high 0.2592 and the Bollinger upper band 0.2607—together forming a short-term resistance zone.
Below, the Bollinger mid-band at 0.2483 and the lower band at 0.2359, along with the recent low at 0.2318, form the lower observation band.
It’s necessary to state clearly: the SuperTrend is still pointing upward; RSI is 62.2; MACD shows bullish momentum. These indicators by themselves do not support a bearish view. The bearish thesis is mainly based on price being close to the resistance zone and the active sell signal. It is a counter-trend setup rather than a trend-following one.
In the derivatives market: 24-hour trading volume is $17.71M, open interest is $8.88M, up 7.4% over 24 hours—indicating that as price rises, new positions are continuously being added.
Funding rate is +0.0050%, relatively mild. Long account share is 64%, and overall market sentiment between bulls and bears is still clearly bullish.
However, the buy/sell ratio at 0.79 indicates active sell dominance. Price is rising while active volume is skewed toward sellers—this divergence is the main basis for the bearish thesis in this post.
For reference levels: for shorts, first watch 0.2563-0.25791. It’s more suitable to wait for a pullback to meet resistance in this zone and then confirm, rather than assuming resistance has already taken effect at the current price.
If the pullback is met with resistance and falls back in the watch zone, the bearish structure can be considered valid on a temporary/phase basis. If price reclaims 0.2592, it means the current pullback structure is broken; then the bearish thesis should be deemed invalid and you should stop “fighting the loss.”
Once the thesis holds, extend the observation downward near 0.2359. If it breaks down there with volume, then look to see whether support around 0.2318 can take over.
Need to disclose proactively: in the data of this post, there are no clear reverse signals at present. But contract leverage itself is risk. Also, as mentioned above, most indicators right now—RSI, MACD, SuperTrend, buy/sell ratio, and open-interest increase—are still leaning bullish. Therefore, the bearish thesis is an inverse observation seeking resistance levels within a generally strong structure; whether it can hold is not certain.
With contract leverage, position discipline is more important than directional judgment.
For reference only, not investment advice. Contracts have leverage; investing involves risk.
This article was generated with the assistance of an OpenAI large model.
$EIGEN #Contract Analysis