Trading Ideas|9/23 15:20
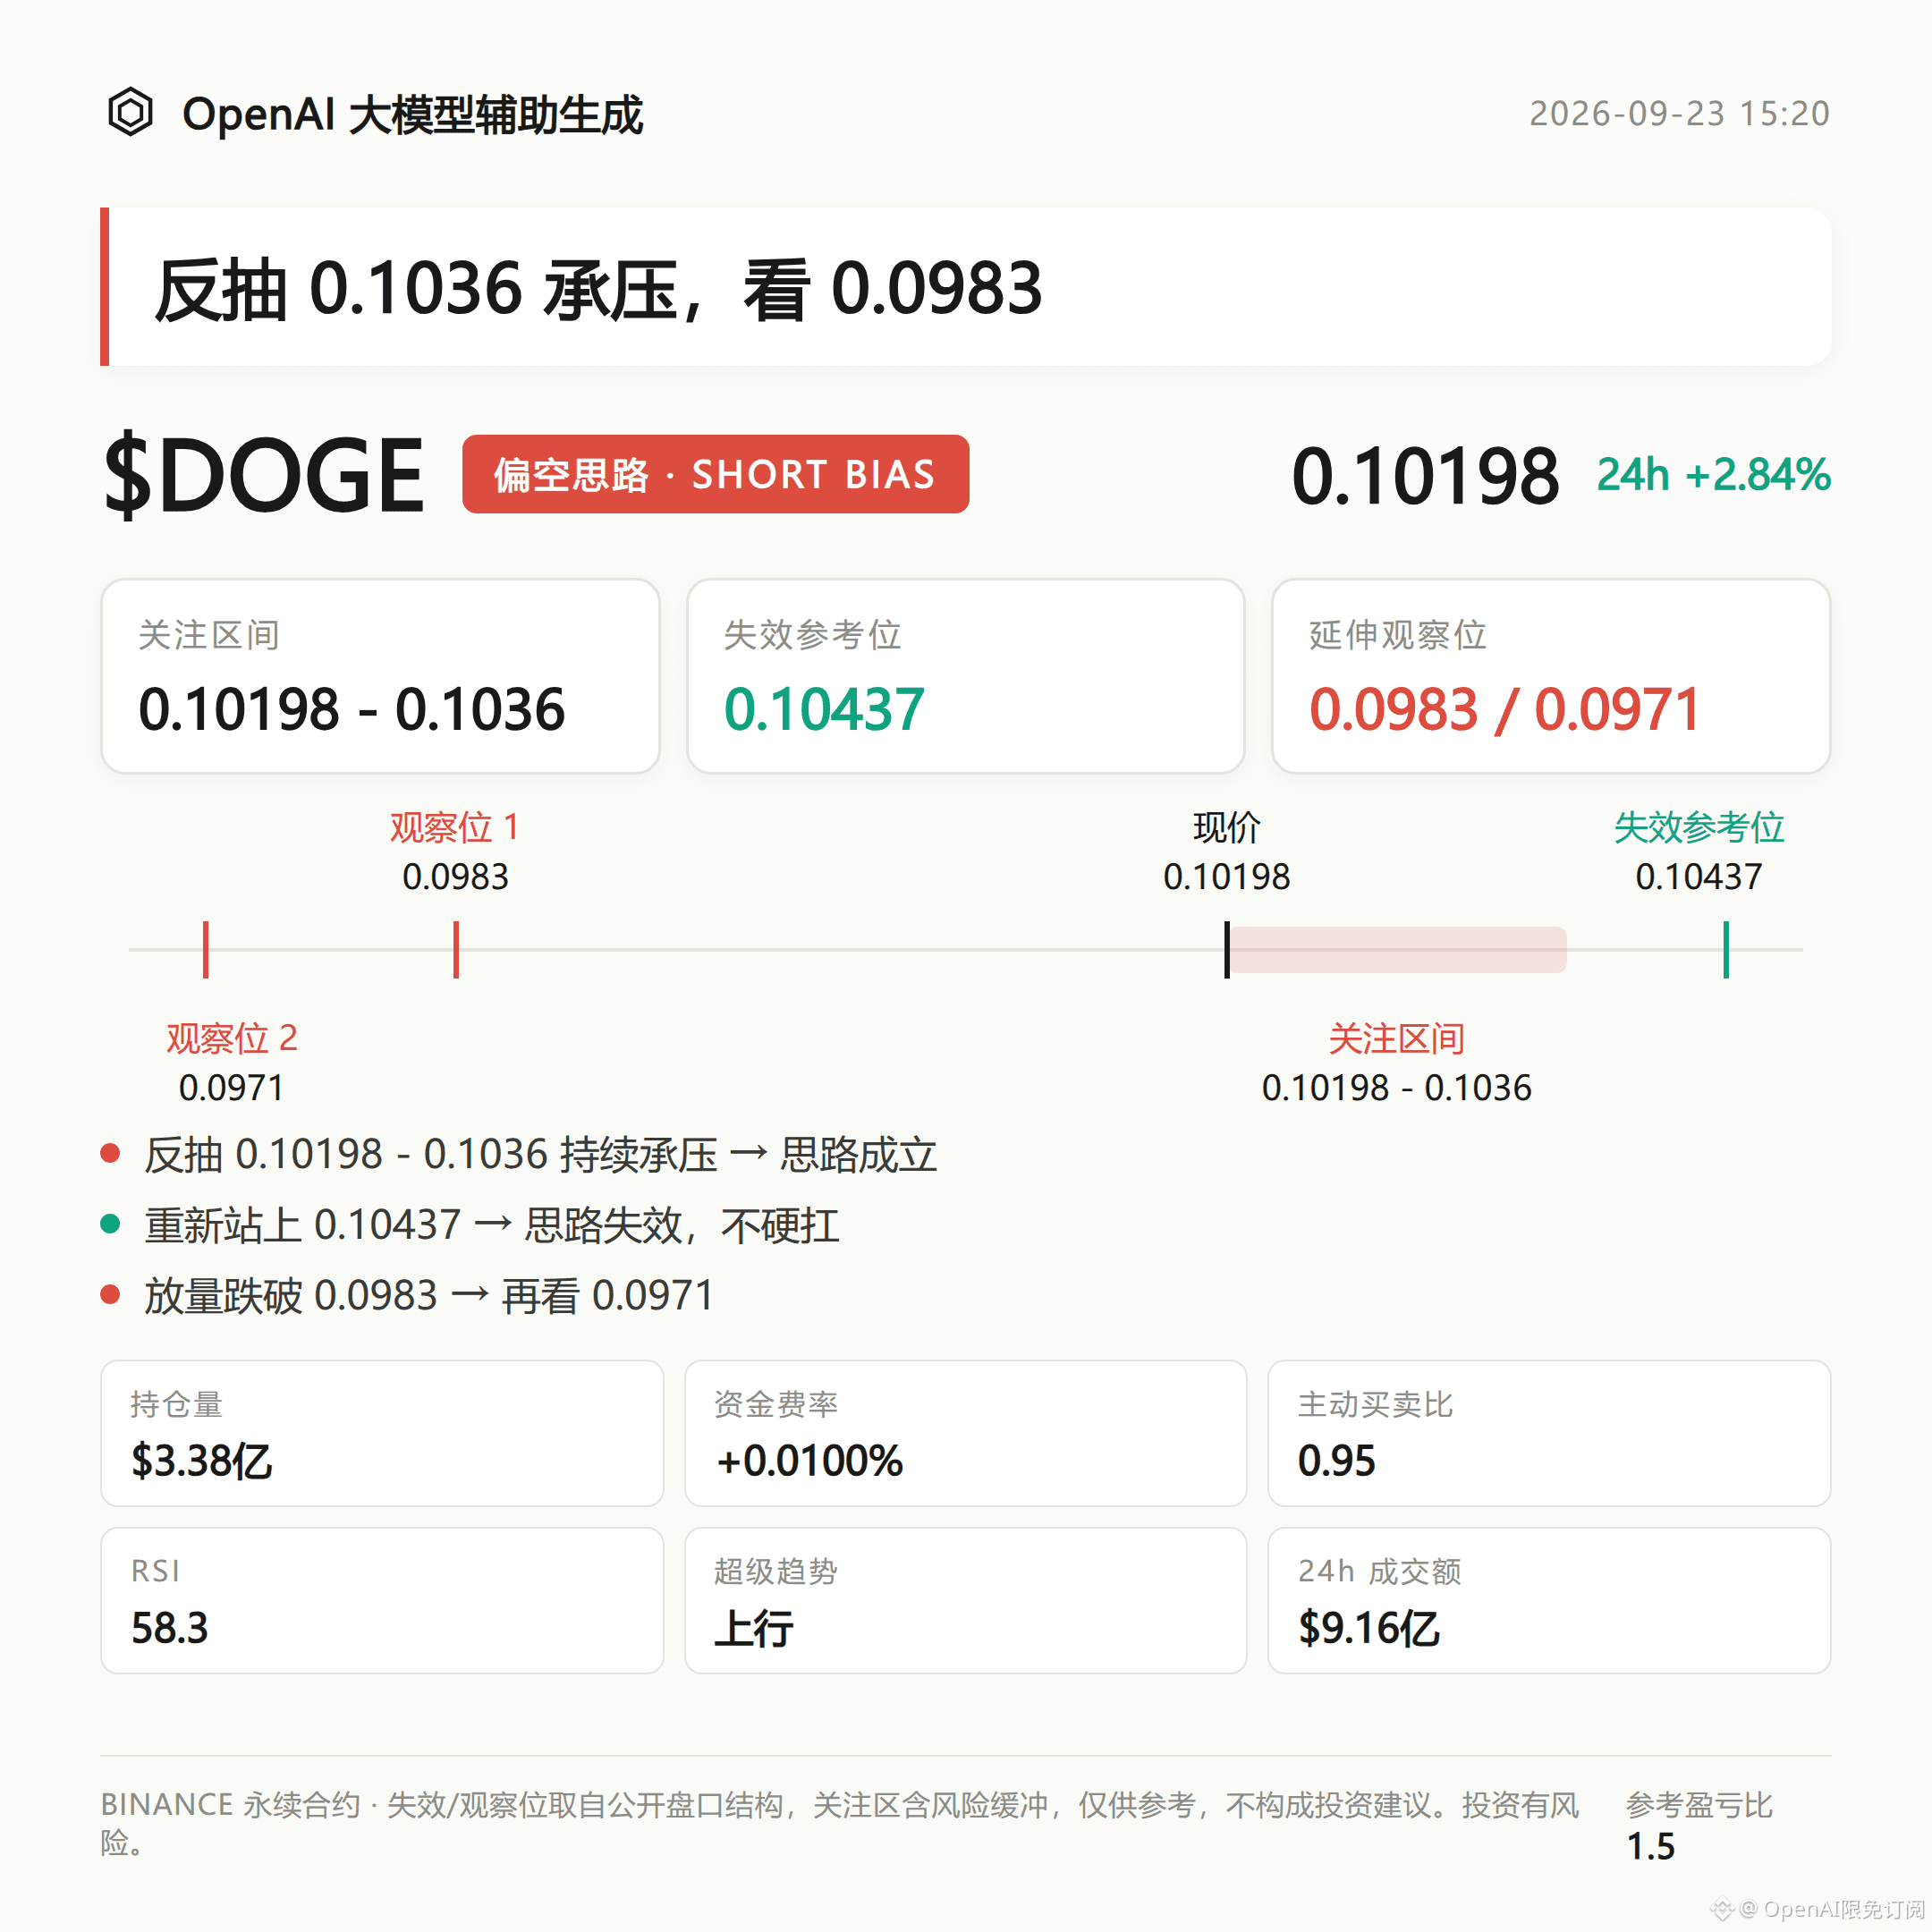
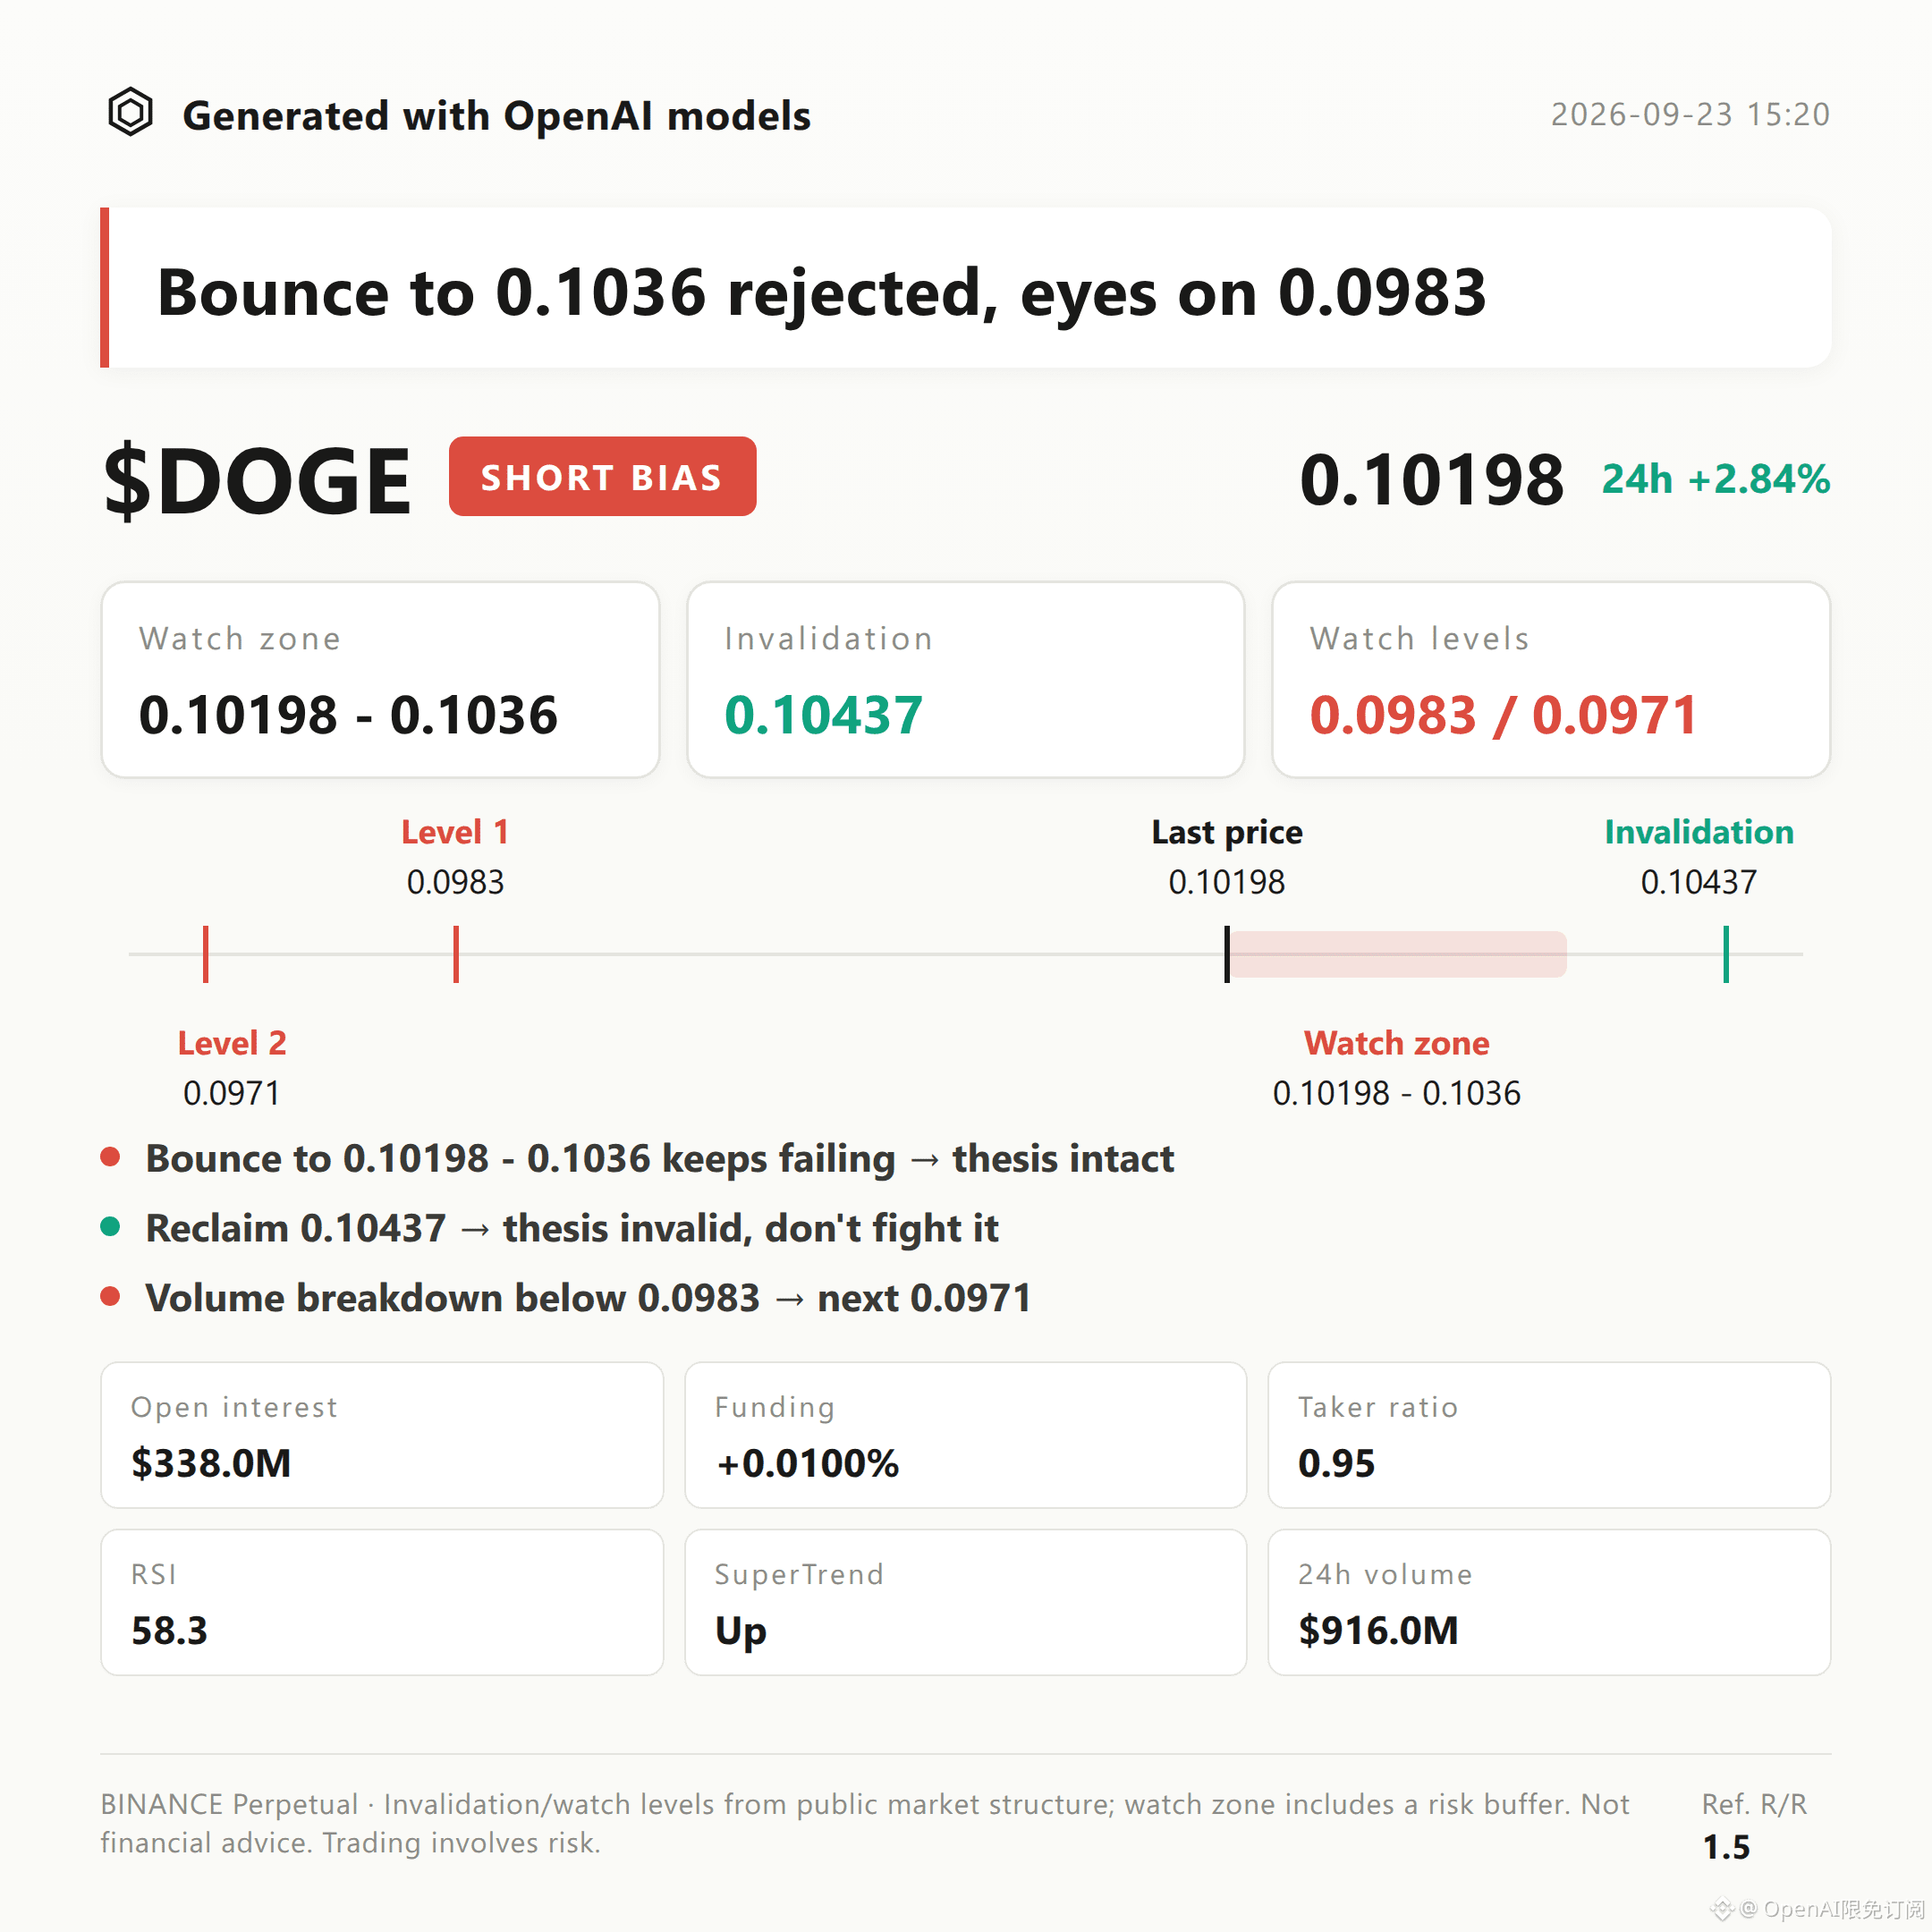
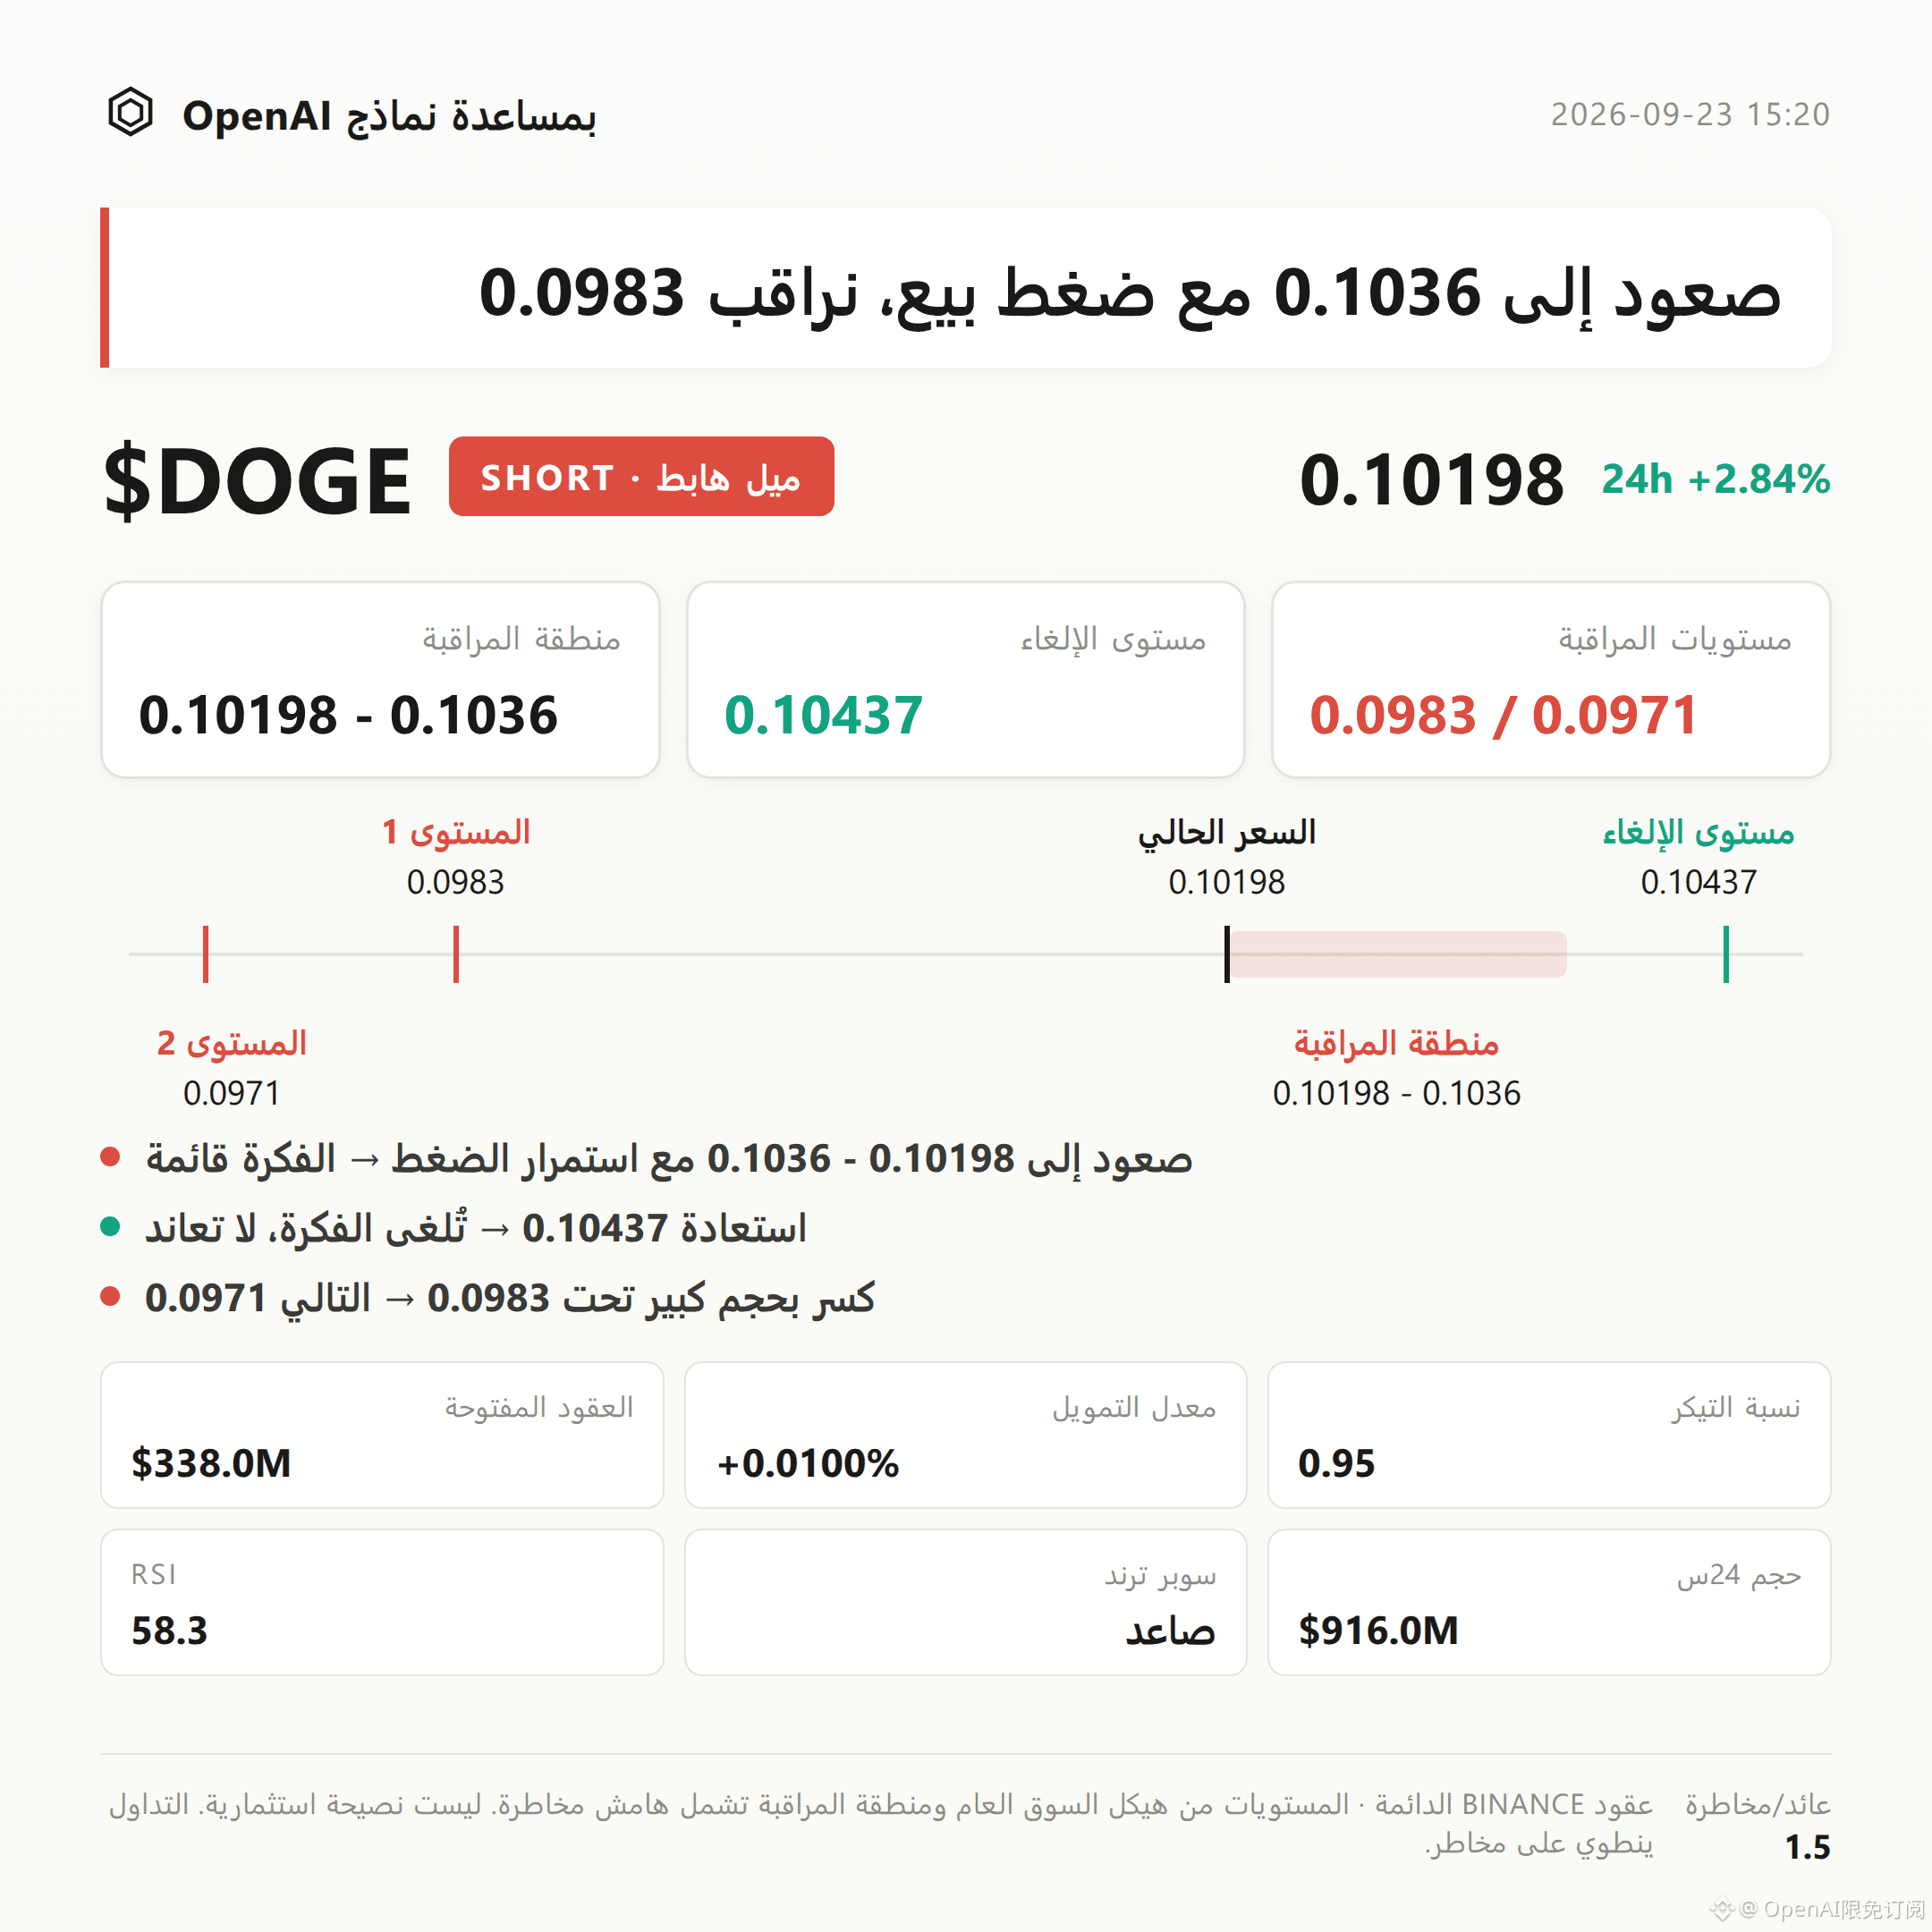
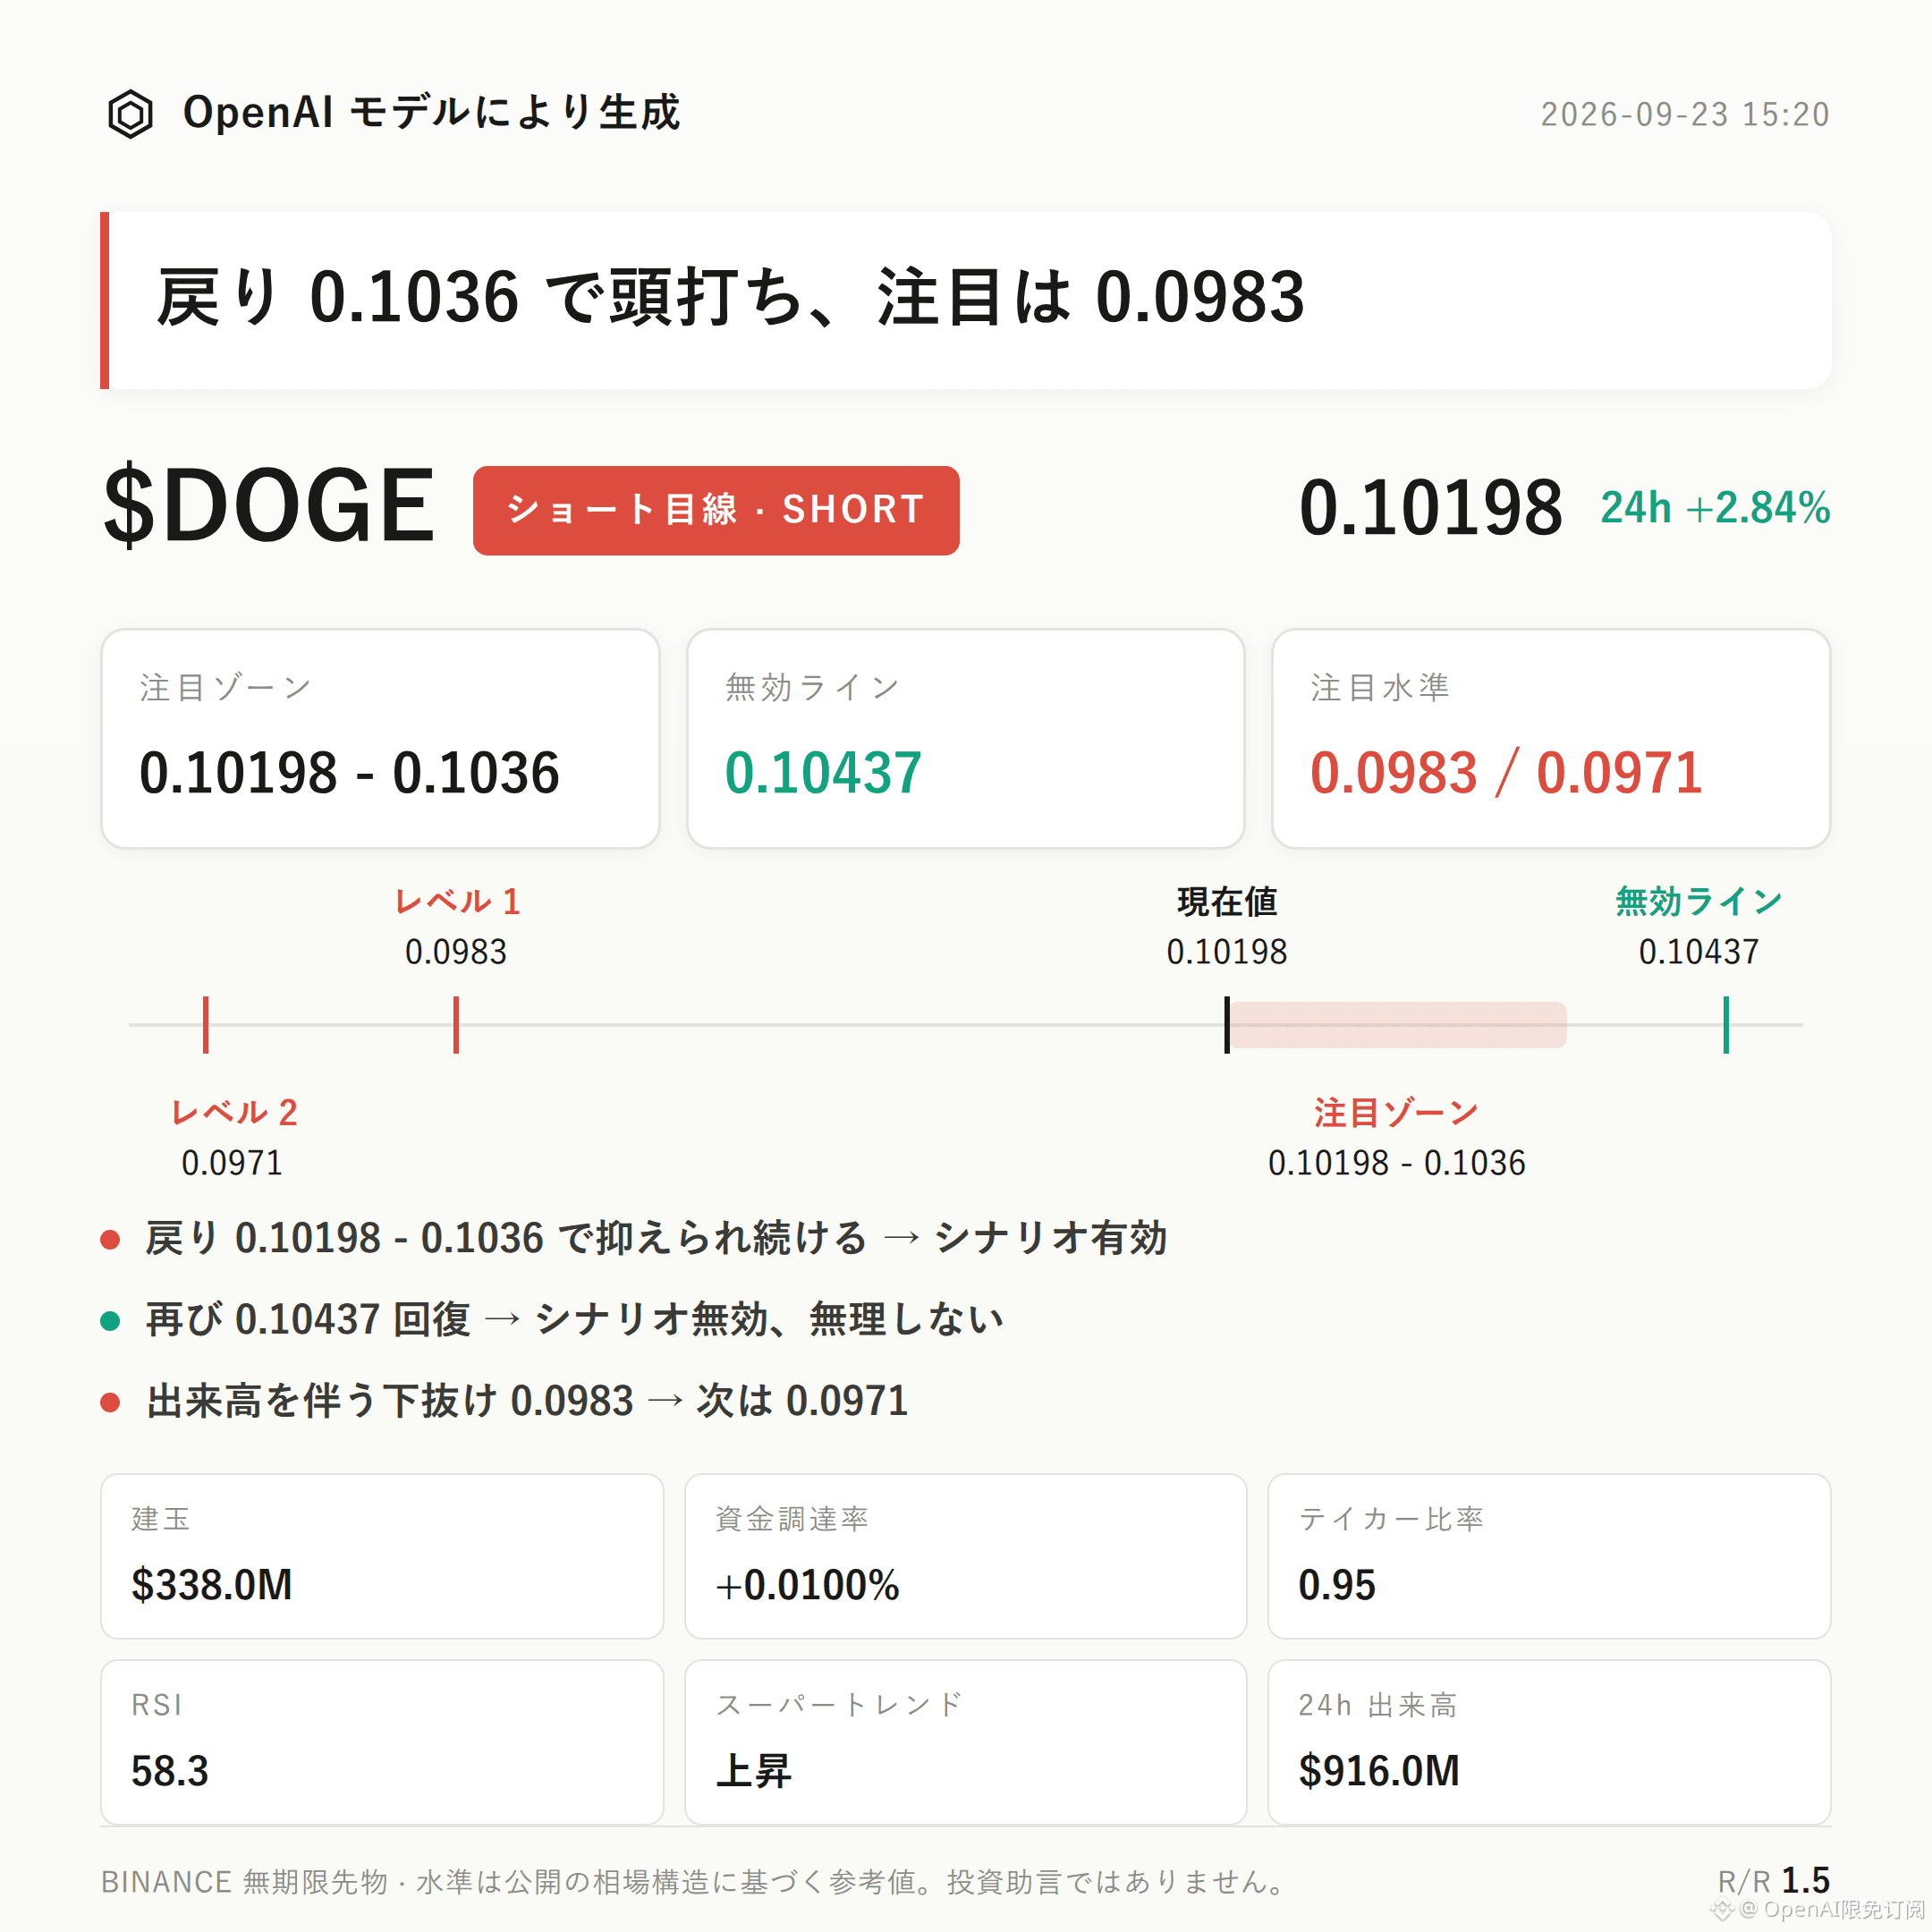
$DOGE bearish bias | Watch zone 0.10198 - 0.1036 | Invalidation reference 0.10437 | Observation levels 0.0983 / 0.0971
$DOGE ’s current structure is leaning bearish.
Core argument: Price is running along the upper Bollinger Band (0.1036) and has approached the recent high near 0.10437. Active sell orders are stronger (0.95), suggesting that sell pressure is heavier than the upside impulse. While open interest increased by 3.4% over the last 24 hours, the long accounts share is as high as 73%. This indicates long crowding is relatively high with elevated leverage longs; once price pulls back, it may easily trigger a squeeze.
Verification method: Focus on whether the relief rally can be held down within the 0.10198 - 0.1036 range. If it cannot be held, the bearish thesis does not hold.
From a technical structure perspective: Price has been moving between the recent high 0.10437 and the recent low 0.0971, and is currently near the upper edge of the range. The Bollinger Bands show a narrowing pattern: upper band 0.1036, middle band 0.101, and lower band 0.0983. When price runs along the upper band, it often comes with mean-reversion pressure. The Supertrend is still marked upward, and RSI is 58.3—still not in overbought. MACD shows bullish momentum. These two indicators are not fully aligned with the bearish direction. This is a structural divergence that needs to be acknowledged; the bearish idea relies more on confirmation from the pressure zone rather than on pure technical formations.
As for derivatives data: The 24-hour trading volume is $916 million. Open interest is $338 million and increased 3.4% over the last 24 hours. Funding rate is positive at +0.0100%. Long accounts share is 73%. This combination of “long crowding + rising open interest” implies that if price cannot effectively break through the pressure zone, long liquidations or position reductions could accelerate the downside. Active buy/sell ratio is 0.95, indicating that active selling is slightly dominant, which corroborates the scenario of stalled gains as price sticks to the upper band.
Price levels (decision tree; for structural reference only): If price retraces into 0.10198 - 0.1036 and then shows clear rejection—unable to stand with volume—then the bearish idea is temporarily valid. If price regains and effectively holds above 0.10437, it means the current pullback structure is broken and the bearish thesis is invalid—do not keep applying it. If the watch zone cannot hold and price extends downward with volume, look toward the 0.0983 area; if that level breaks down with volume, then reassess support near 0.0971.
Reference risk-reward ratio: 1.5 (for structural reference only).
The downside risks must be disclosed truthfully: RSI is not overbought, MACD still shows bullish momentum, and Supertrend remains upward—these three items do not support a bearish conclusion. There is no stronger reverse signal yet, but it also cannot rule out the possibility that price continues to trade strong. In addition, open interest and the funding rate are both in a mild range; there is no sign of extreme crowding. The main risk comes from the structural divergence itself. Under contract leverage, position discipline matters more than directional judgment.
For reference only and not investment advice. Contracts have leverage; invest
$DOGE bearish bias | Watch zone 0.10198 - 0.1036 | Invalidation reference 0.10437 | Observation levels 0.0983 / 0.0971
$DOGE ’s current structure is leaning bearish.
Core argument: Price is running along the upper Bollinger Band (0.1036) and has approached the recent high near 0.10437. Active sell orders are stronger (0.95), suggesting that sell pressure is heavier than the upside impulse. While open interest increased by 3.4% over the last 24 hours, the long accounts share is as high as 73%. This indicates long crowding is relatively high with elevated leverage longs; once price pulls back, it may easily trigger a squeeze.
Verification method: Focus on whether the relief rally can be held down within the 0.10198 - 0.1036 range. If it cannot be held, the bearish thesis does not hold.
From a technical structure perspective: Price has been moving between the recent high 0.10437 and the recent low 0.0971, and is currently near the upper edge of the range. The Bollinger Bands show a narrowing pattern: upper band 0.1036, middle band 0.101, and lower band 0.0983. When price runs along the upper band, it often comes with mean-reversion pressure. The Supertrend is still marked upward, and RSI is 58.3—still not in overbought. MACD shows bullish momentum. These two indicators are not fully aligned with the bearish direction. This is a structural divergence that needs to be acknowledged; the bearish idea relies more on confirmation from the pressure zone rather than on pure technical formations.
As for derivatives data: The 24-hour trading volume is $916 million. Open interest is $338 million and increased 3.4% over the last 24 hours. Funding rate is positive at +0.0100%. Long accounts share is 73%. This combination of “long crowding + rising open interest” implies that if price cannot effectively break through the pressure zone, long liquidations or position reductions could accelerate the downside. Active buy/sell ratio is 0.95, indicating that active selling is slightly dominant, which corroborates the scenario of stalled gains as price sticks to the upper band.
Price levels (decision tree; for structural reference only): If price retraces into 0.10198 - 0.1036 and then shows clear rejection—unable to stand with volume—then the bearish idea is temporarily valid. If price regains and effectively holds above 0.10437, it means the current pullback structure is broken and the bearish thesis is invalid—do not keep applying it. If the watch zone cannot hold and price extends downward with volume, look toward the 0.0983 area; if that level breaks down with volume, then reassess support near 0.0971.
Reference risk-reward ratio: 1.5 (for structural reference only).
The downside risks must be disclosed truthfully: RSI is not overbought, MACD still shows bullish momentum, and Supertrend remains upward—these three items do not support a bearish conclusion. There is no stronger reverse signal yet, but it also cannot rule out the possibility that price continues to trade strong. In addition, open interest and the funding rate are both in a mild range; there is no sign of extreme crowding. The main risk comes from the structural divergence itself. Under contract leverage, position discipline matters more than directional judgment.
For reference only and not investment advice. Contracts have leverage; invest