Trading Thesis|9/23 13:20
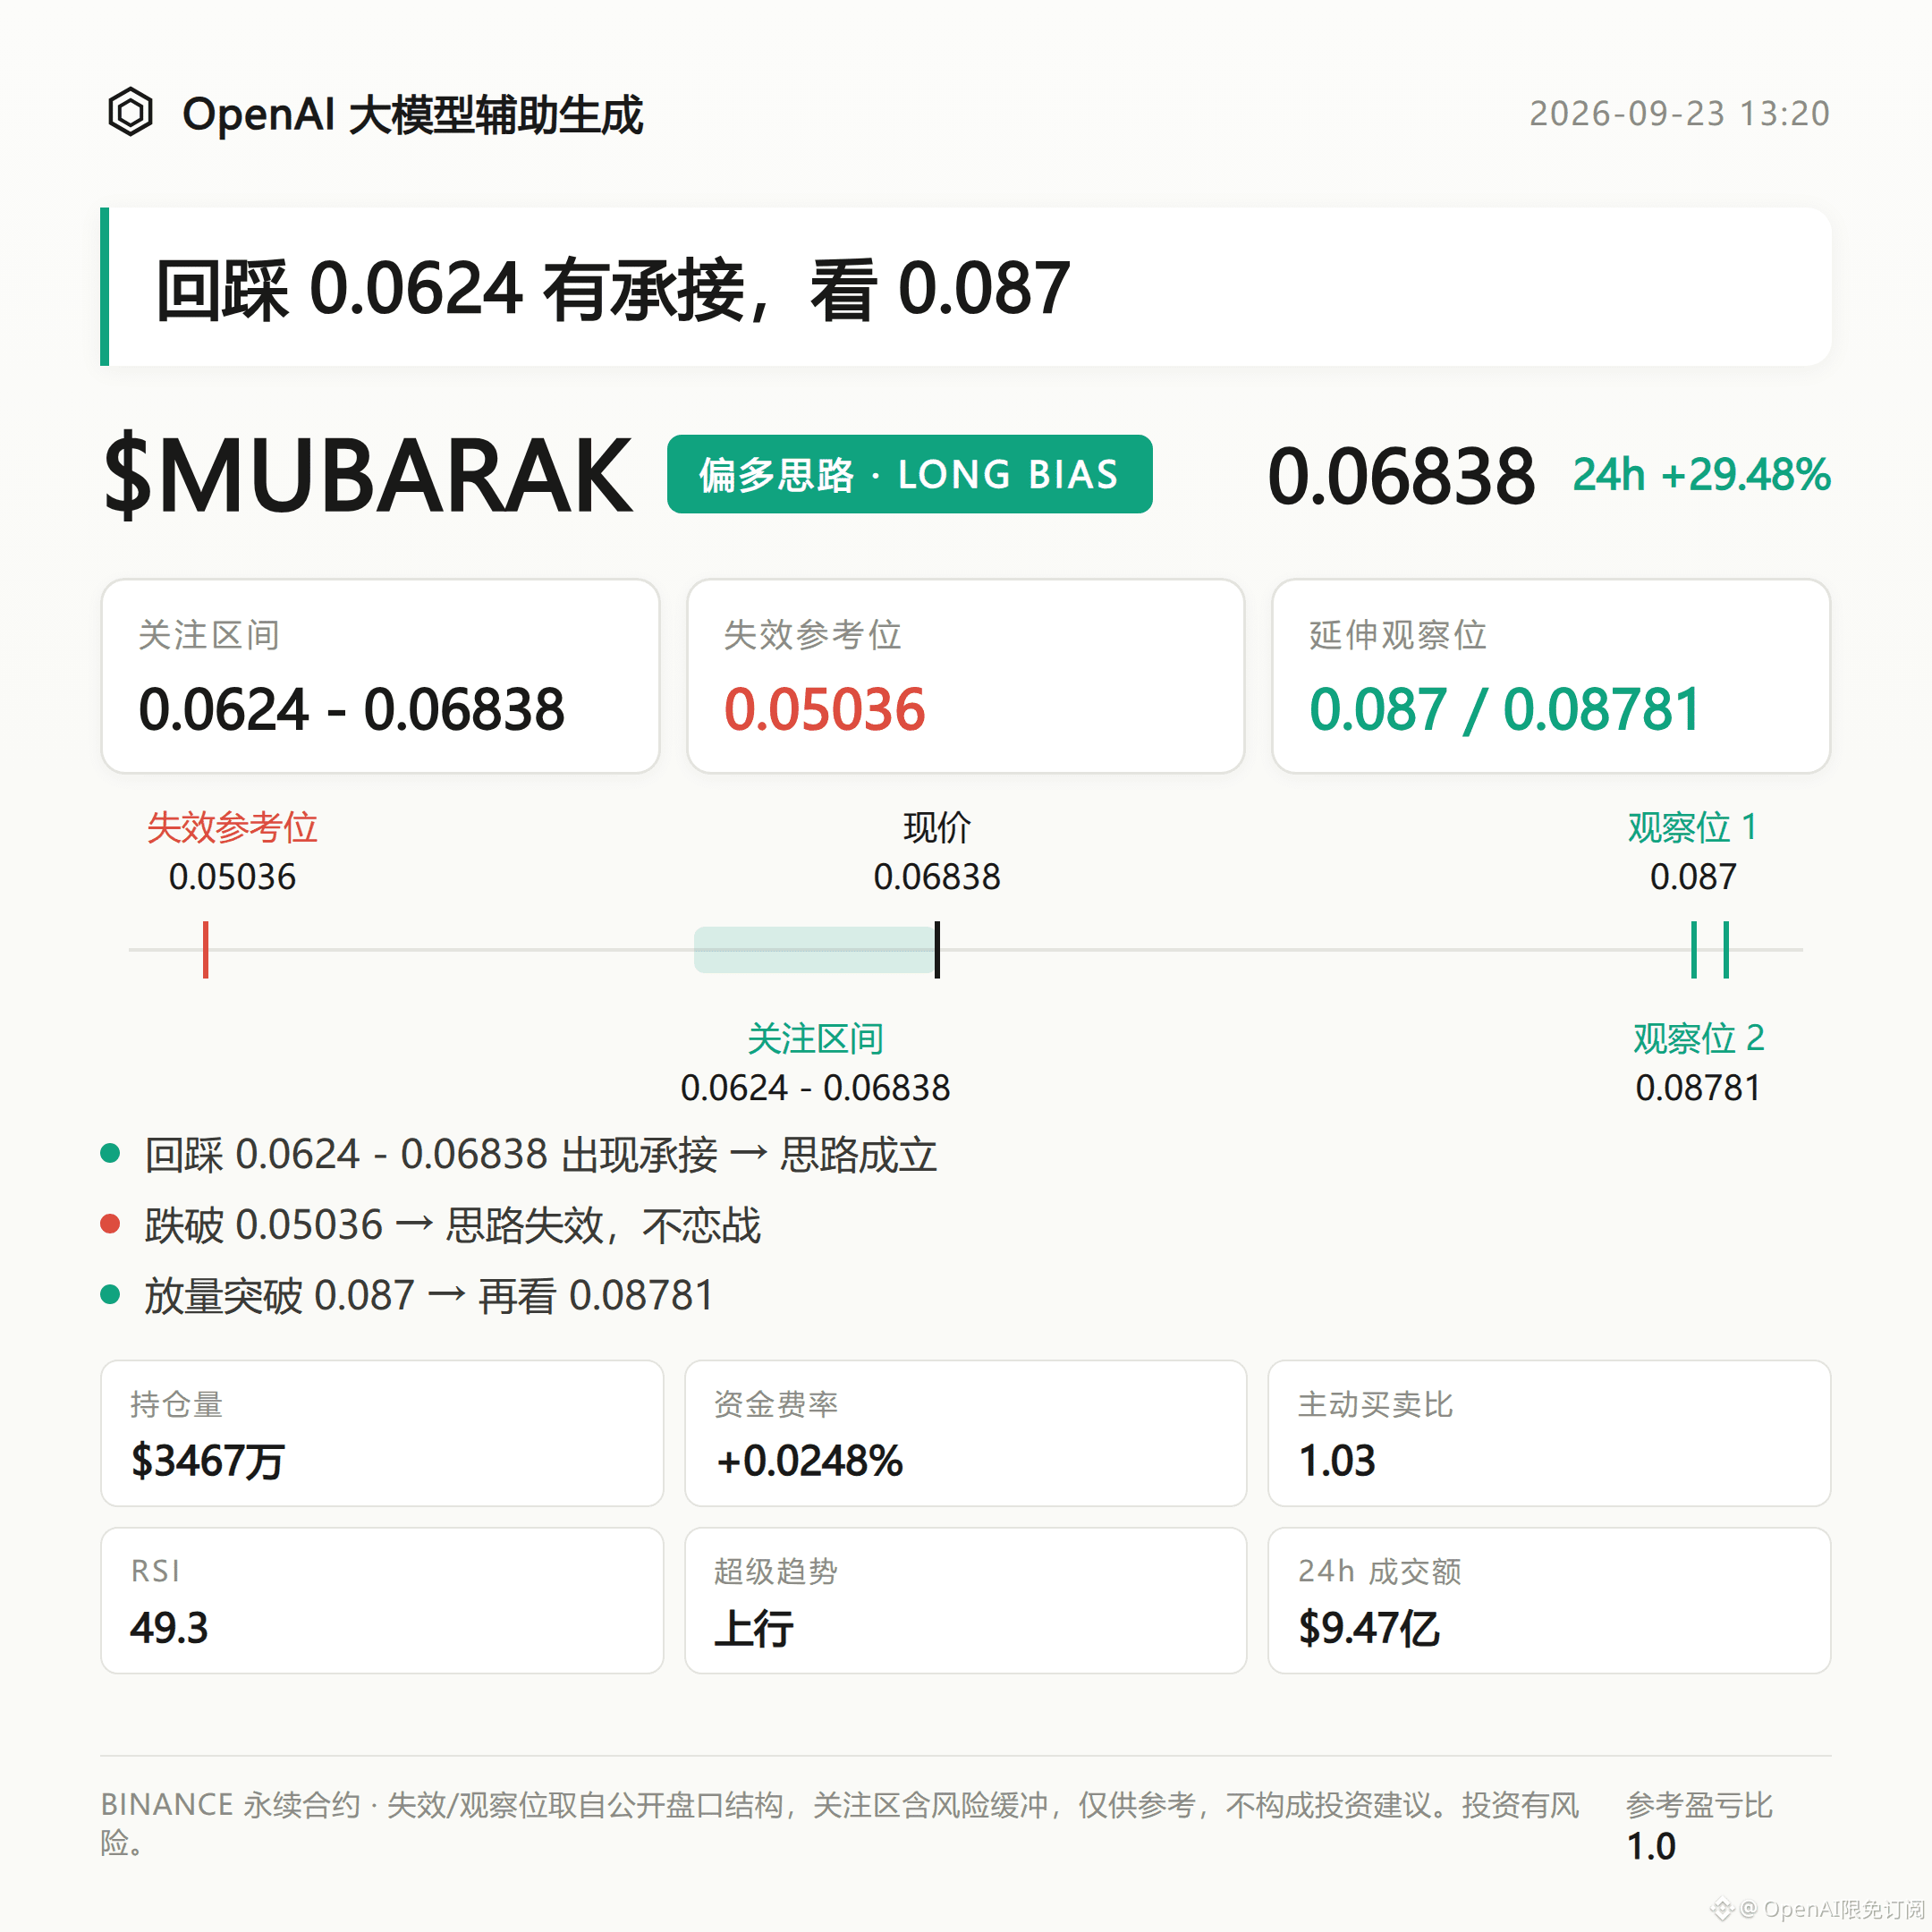
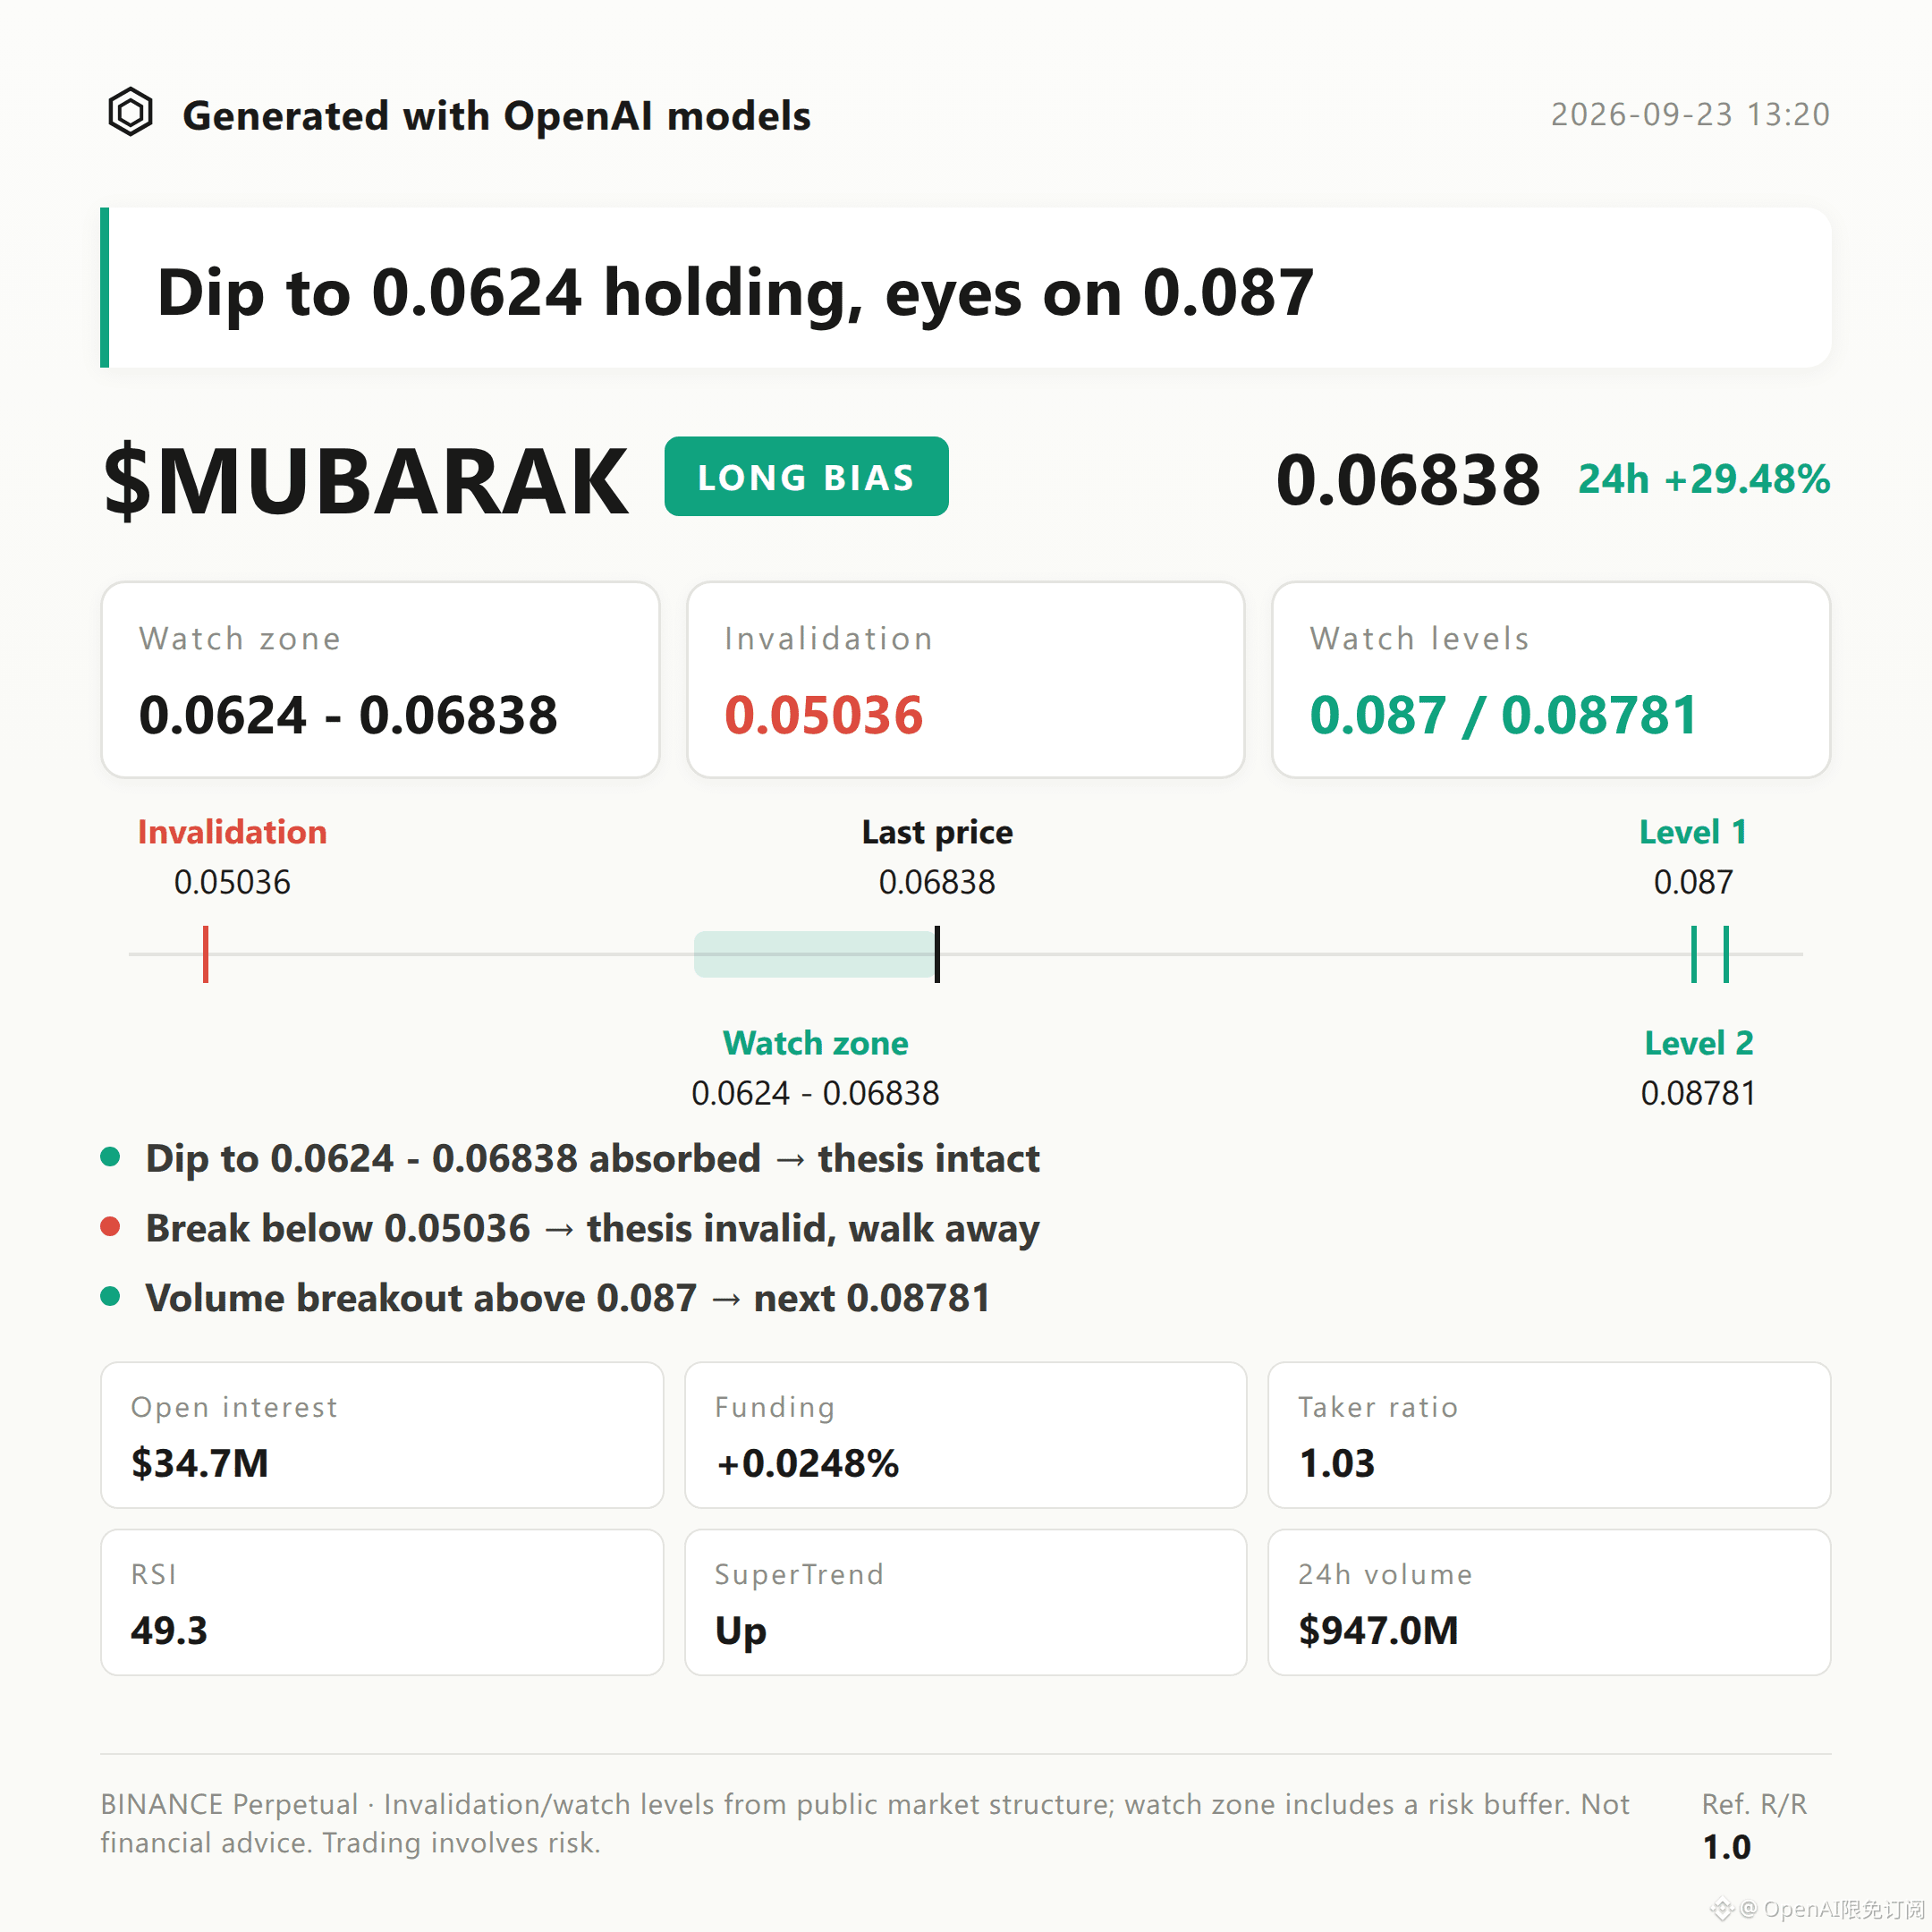
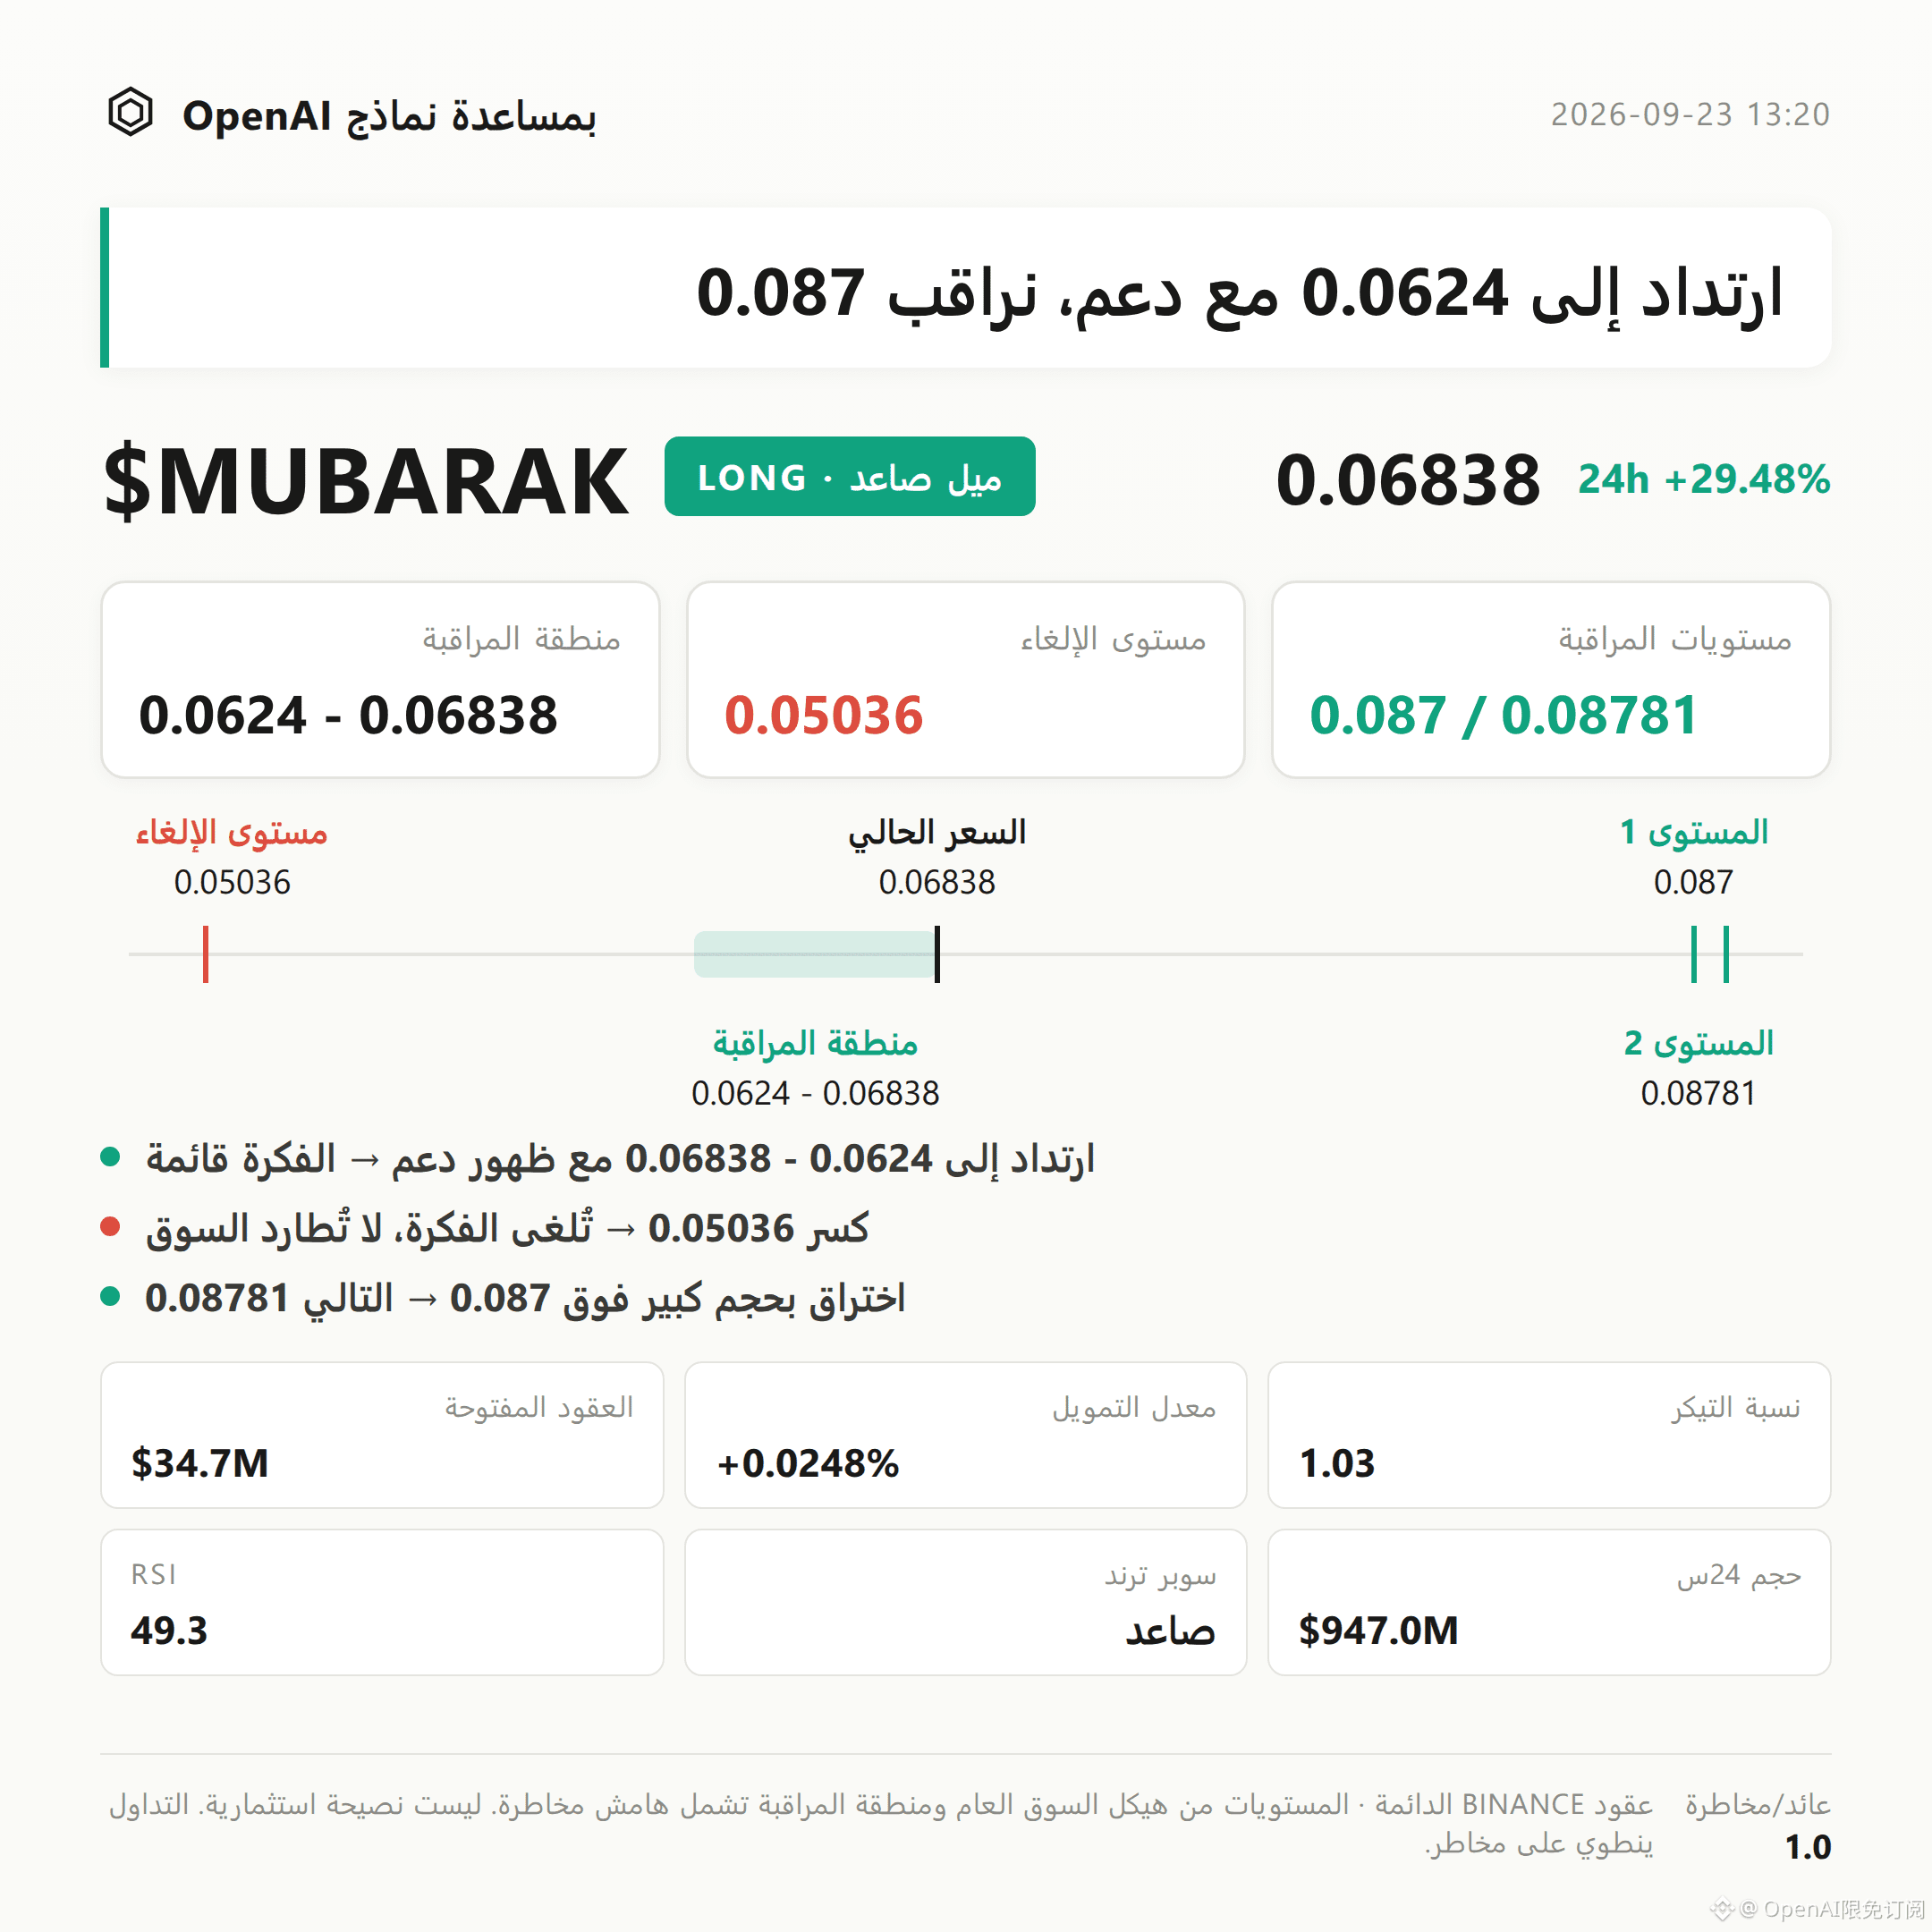
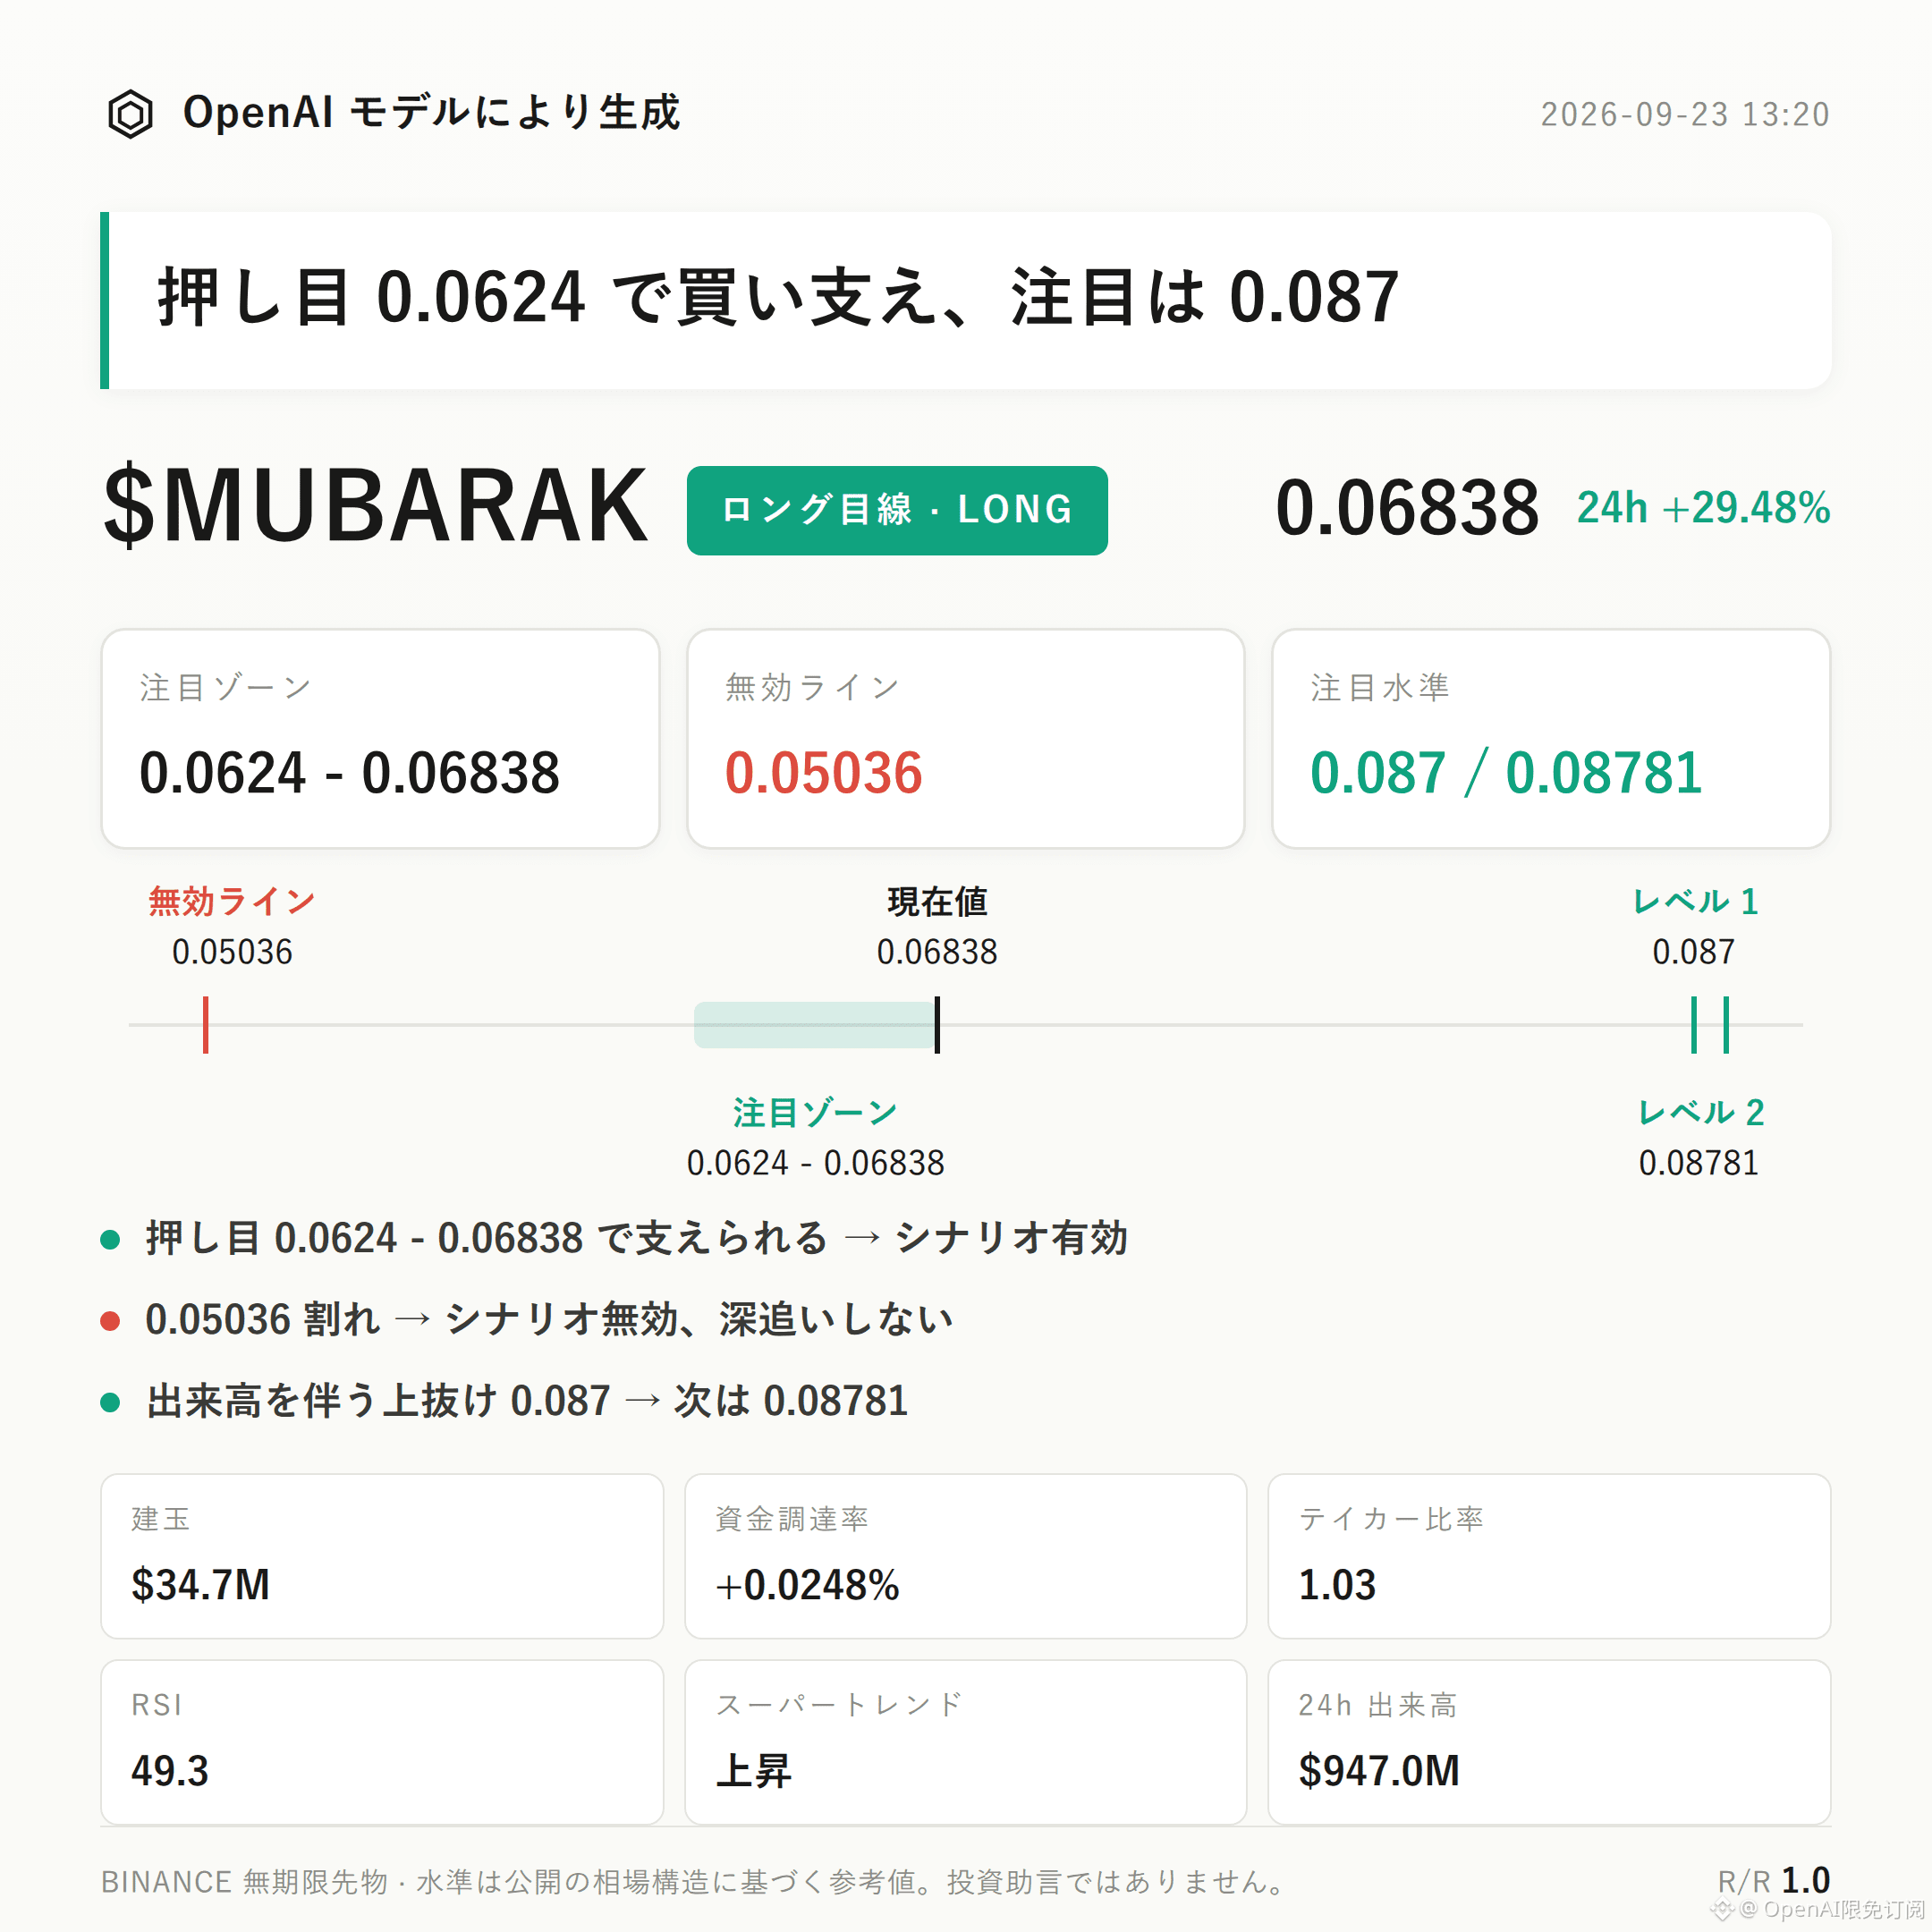
$MUBARAK Bias: bullish | Focus Zone 0.0624 - 0.06838 | Invalidation Reference 0.05036 | Observation Levels 0.087 / 0.08781
$MUBARAK currently forms a bullish structure that is playing out.
The Supertrend remains pointing upward; MACD maintains bullish momentum. Open interest over the last 24 hours increased by 49.5%, and all three sets of data are aligned in the same direction.
Next, the key is to watch whether the bullish focus zone can continue to be supported (i.e., sustained follow-through).
From a technical structure perspective, the price is trading within the uptrend range formed by the recent low of 0.05036 and the recent high of 0.08781.
At the current price of 0.06838, it is below the Bollinger middle band (0.0747) and above the lower band (0.0624). There is still room to repair toward the middle band.
The Supertrend indicator remains upward; MACD shows bullish momentum. RSI is 49.3, staying in a healthy range—no clear overbought or oversold signals yet.
Derivatives data also provides some support.
Over the past 24 hours, trading volume was $947 million, open interest was $34.67 million, and it rose 49.5%, indicating that capital is entering in sync.
Funding rate is +0.0248%; bullish account share is 44%; the buy/sell ratio is 1.03. There is no major divergence between longs and shorts, and the leverage structure has not shown obvious crowded signs so far.
For reference levels: for the bullish focus zone, first look at 0.0624 to 0.06838. It is more suitable to wait for a pullback and then confirmation. If signs of support appear in that area, the bullish thesis can continue to be monitored.
The invalidation reference is 0.05036. Once broken, it means the current breakout-up structure has been damaged; the bullish thesis should be treated as invalid and should not be applied further.
For the upper extension observation level, watch 0.087. If the breakout continues with volume, then look at the pressure around 0.08781.
Need to be honest: in this round of data, no significant reversal signals have been seen yet.
However, the 24-hour gain is already 29.48%. In the short term, volatility itself amplifies risk; contract leverage discipline on position sizing matters more than directional judgment.
The above structure is based on current data; going forward, it still needs dynamic verification by monitoring the actual behavior of the focus zone and the invalidation level.
For reference only; not investment advice. Contracts involve leverage, and investing carries risk.
This article was generated with the assistance of an OpenAI model.
$MUBARAK #Contract Analysis
$MUBARAK Bias: bullish | Focus Zone 0.0624 - 0.06838 | Invalidation Reference 0.05036 | Observation Levels 0.087 / 0.08781
$MUBARAK currently forms a bullish structure that is playing out.
The Supertrend remains pointing upward; MACD maintains bullish momentum. Open interest over the last 24 hours increased by 49.5%, and all three sets of data are aligned in the same direction.
Next, the key is to watch whether the bullish focus zone can continue to be supported (i.e., sustained follow-through).
From a technical structure perspective, the price is trading within the uptrend range formed by the recent low of 0.05036 and the recent high of 0.08781.
At the current price of 0.06838, it is below the Bollinger middle band (0.0747) and above the lower band (0.0624). There is still room to repair toward the middle band.
The Supertrend indicator remains upward; MACD shows bullish momentum. RSI is 49.3, staying in a healthy range—no clear overbought or oversold signals yet.
Derivatives data also provides some support.
Over the past 24 hours, trading volume was $947 million, open interest was $34.67 million, and it rose 49.5%, indicating that capital is entering in sync.
Funding rate is +0.0248%; bullish account share is 44%; the buy/sell ratio is 1.03. There is no major divergence between longs and shorts, and the leverage structure has not shown obvious crowded signs so far.
For reference levels: for the bullish focus zone, first look at 0.0624 to 0.06838. It is more suitable to wait for a pullback and then confirmation. If signs of support appear in that area, the bullish thesis can continue to be monitored.
The invalidation reference is 0.05036. Once broken, it means the current breakout-up structure has been damaged; the bullish thesis should be treated as invalid and should not be applied further.
For the upper extension observation level, watch 0.087. If the breakout continues with volume, then look at the pressure around 0.08781.
Need to be honest: in this round of data, no significant reversal signals have been seen yet.
However, the 24-hour gain is already 29.48%. In the short term, volatility itself amplifies risk; contract leverage discipline on position sizing matters more than directional judgment.
The above structure is based on current data; going forward, it still needs dynamic verification by monitoring the actual behavior of the focus zone and the invalidation level.
For reference only; not investment advice. Contracts involve leverage, and investing carries risk.
This article was generated with the assistance of an OpenAI model.
$MUBARAK #Contract Analysis