


The $S token from SonicLabs is drawing attention in the market with significant volume over the last 24h (over $60 million), confirming buying momentum after breaking its recent bearish structure. But what does the chart say about the next steps? 🤔
Here’s a quick technical overview so you don’t get caught off guard:
📈 The Current Scenario:
The asset has been moving strongly within the $0.038 to $0.044 range. The RSI on smaller timeframes shows that the bullish divergence worked, placing the token now in a neutral-to-bullish territory with room to breathe.
🧱 Critical Zones:
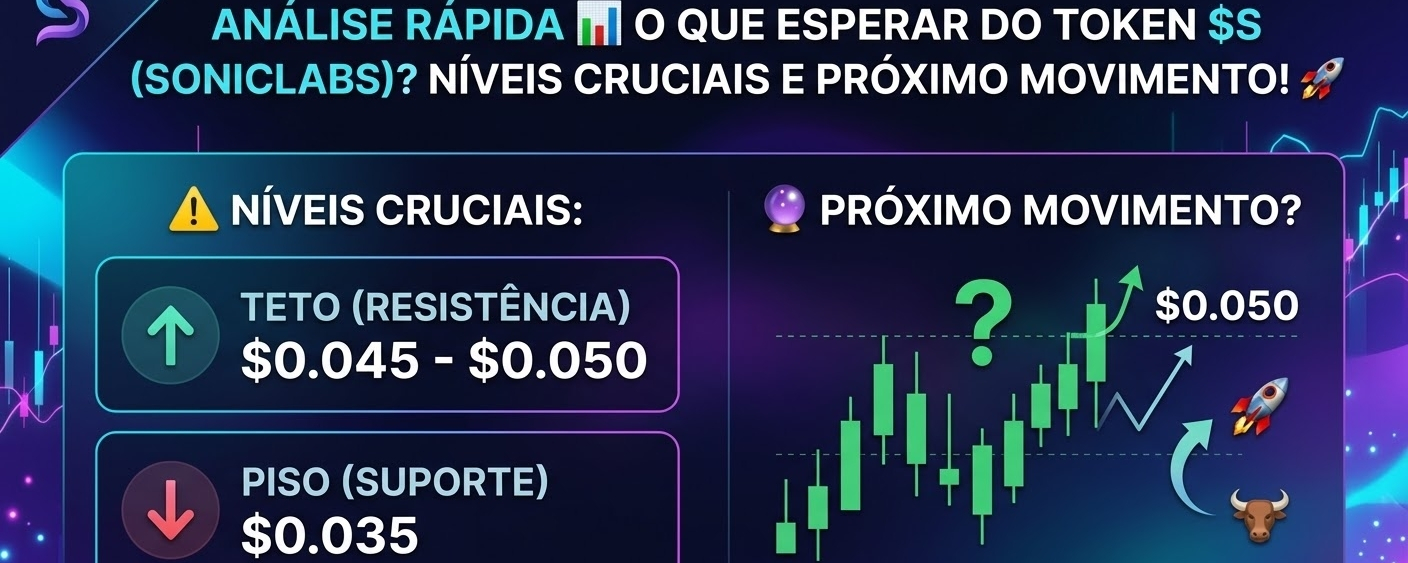
• Current Ceiling (Resistance): The major barrier is at $0.045. Bears have already defended the $0.047 region recently, so the $0.050 level is the finish line to be broken.
• Local Floor (Support): The $0.035 range is the bulls’ trench. Drops to this point have been quickly bought (wick on the chart).
• Macro Floor (Structural Support): If Bitcoin pulls the market down, the strongest defense zone is between $0.027 and $0.030.
🔮 Likely Next Move:
The current structure suggests an imminent attack on the $0.045 – $0.050 resistance.
👉 If it breaks and confirms above $0.050 with volume: The way is clear for the rally’s extension.
👉 If it rejects: We could see a corrective pullback back to $0.035 to range and build strength before another attempt.
Watch the volume in the next few hours!
And you—are you positioned at $S? Do you think there’s enough strength to break $0.050 right now, or will it correct? Share your thoughts in the comments! 👇
#SonicLabs #S #analisetecnica #trading #BinanceSquare

⚠️ Disclaimer: This is a market analysis and not financial advice. Trade with risk management!