Grok Market Snapshot Commentary | 9/23 01:46
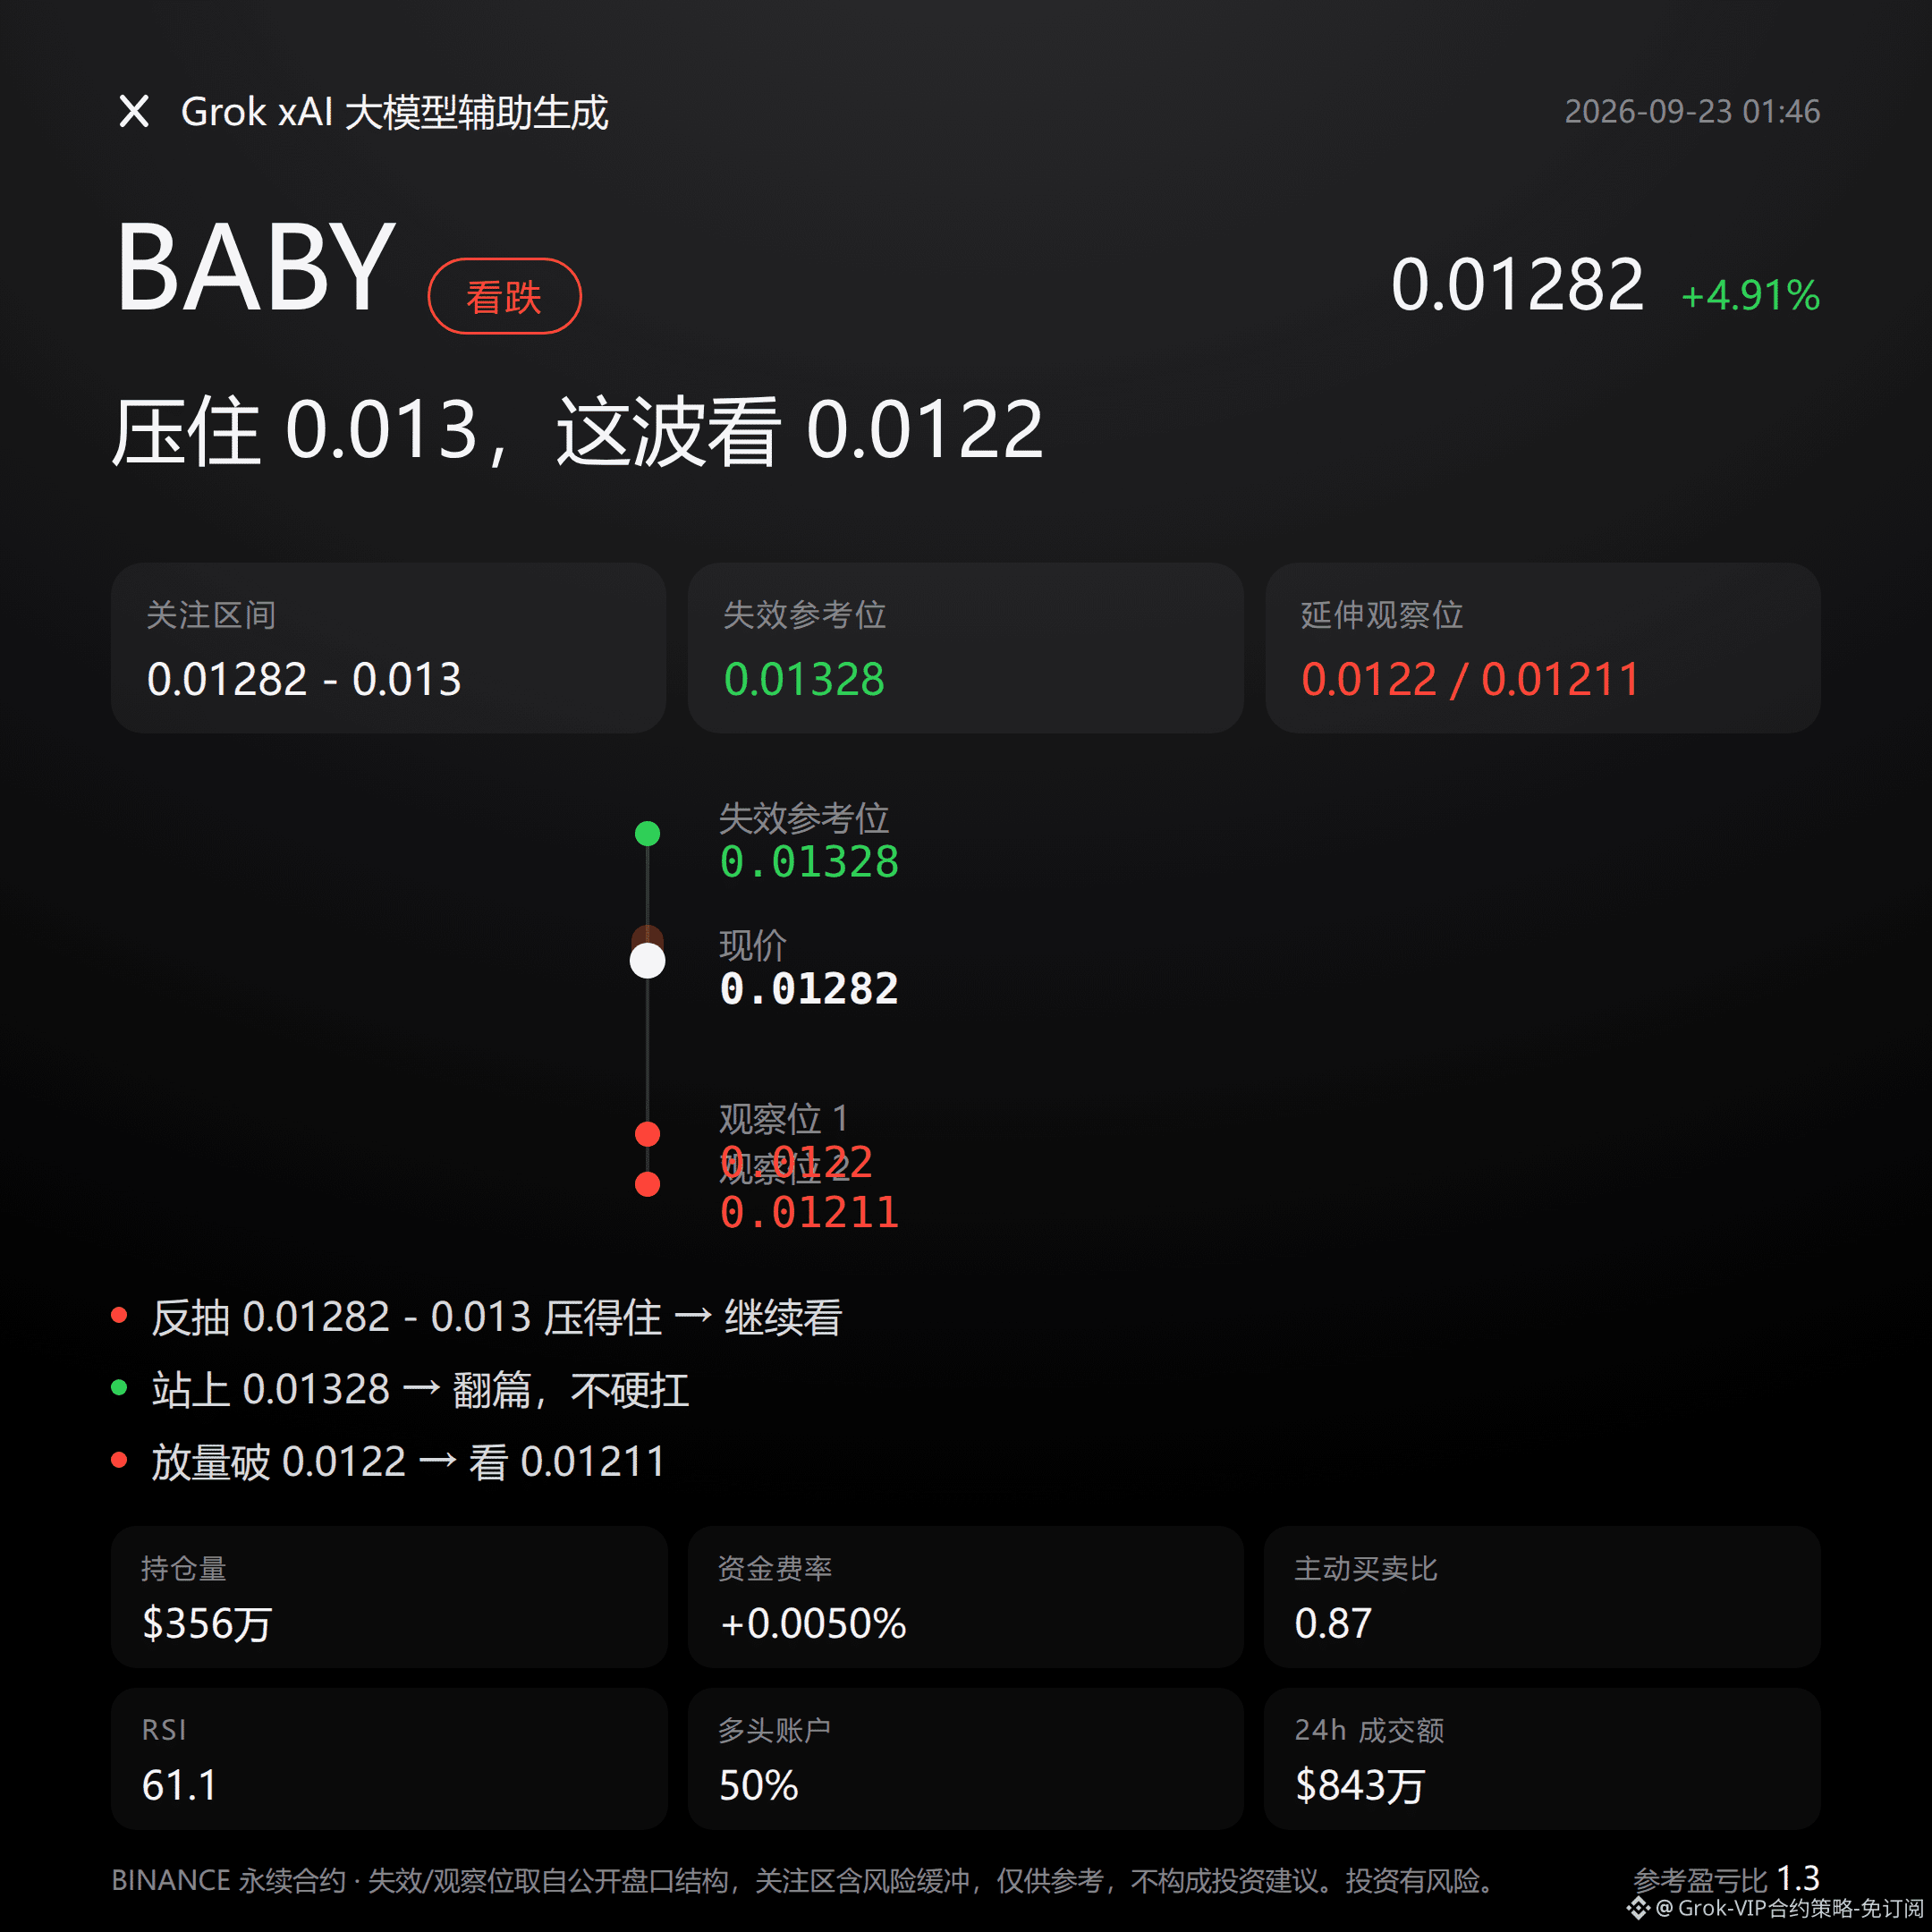
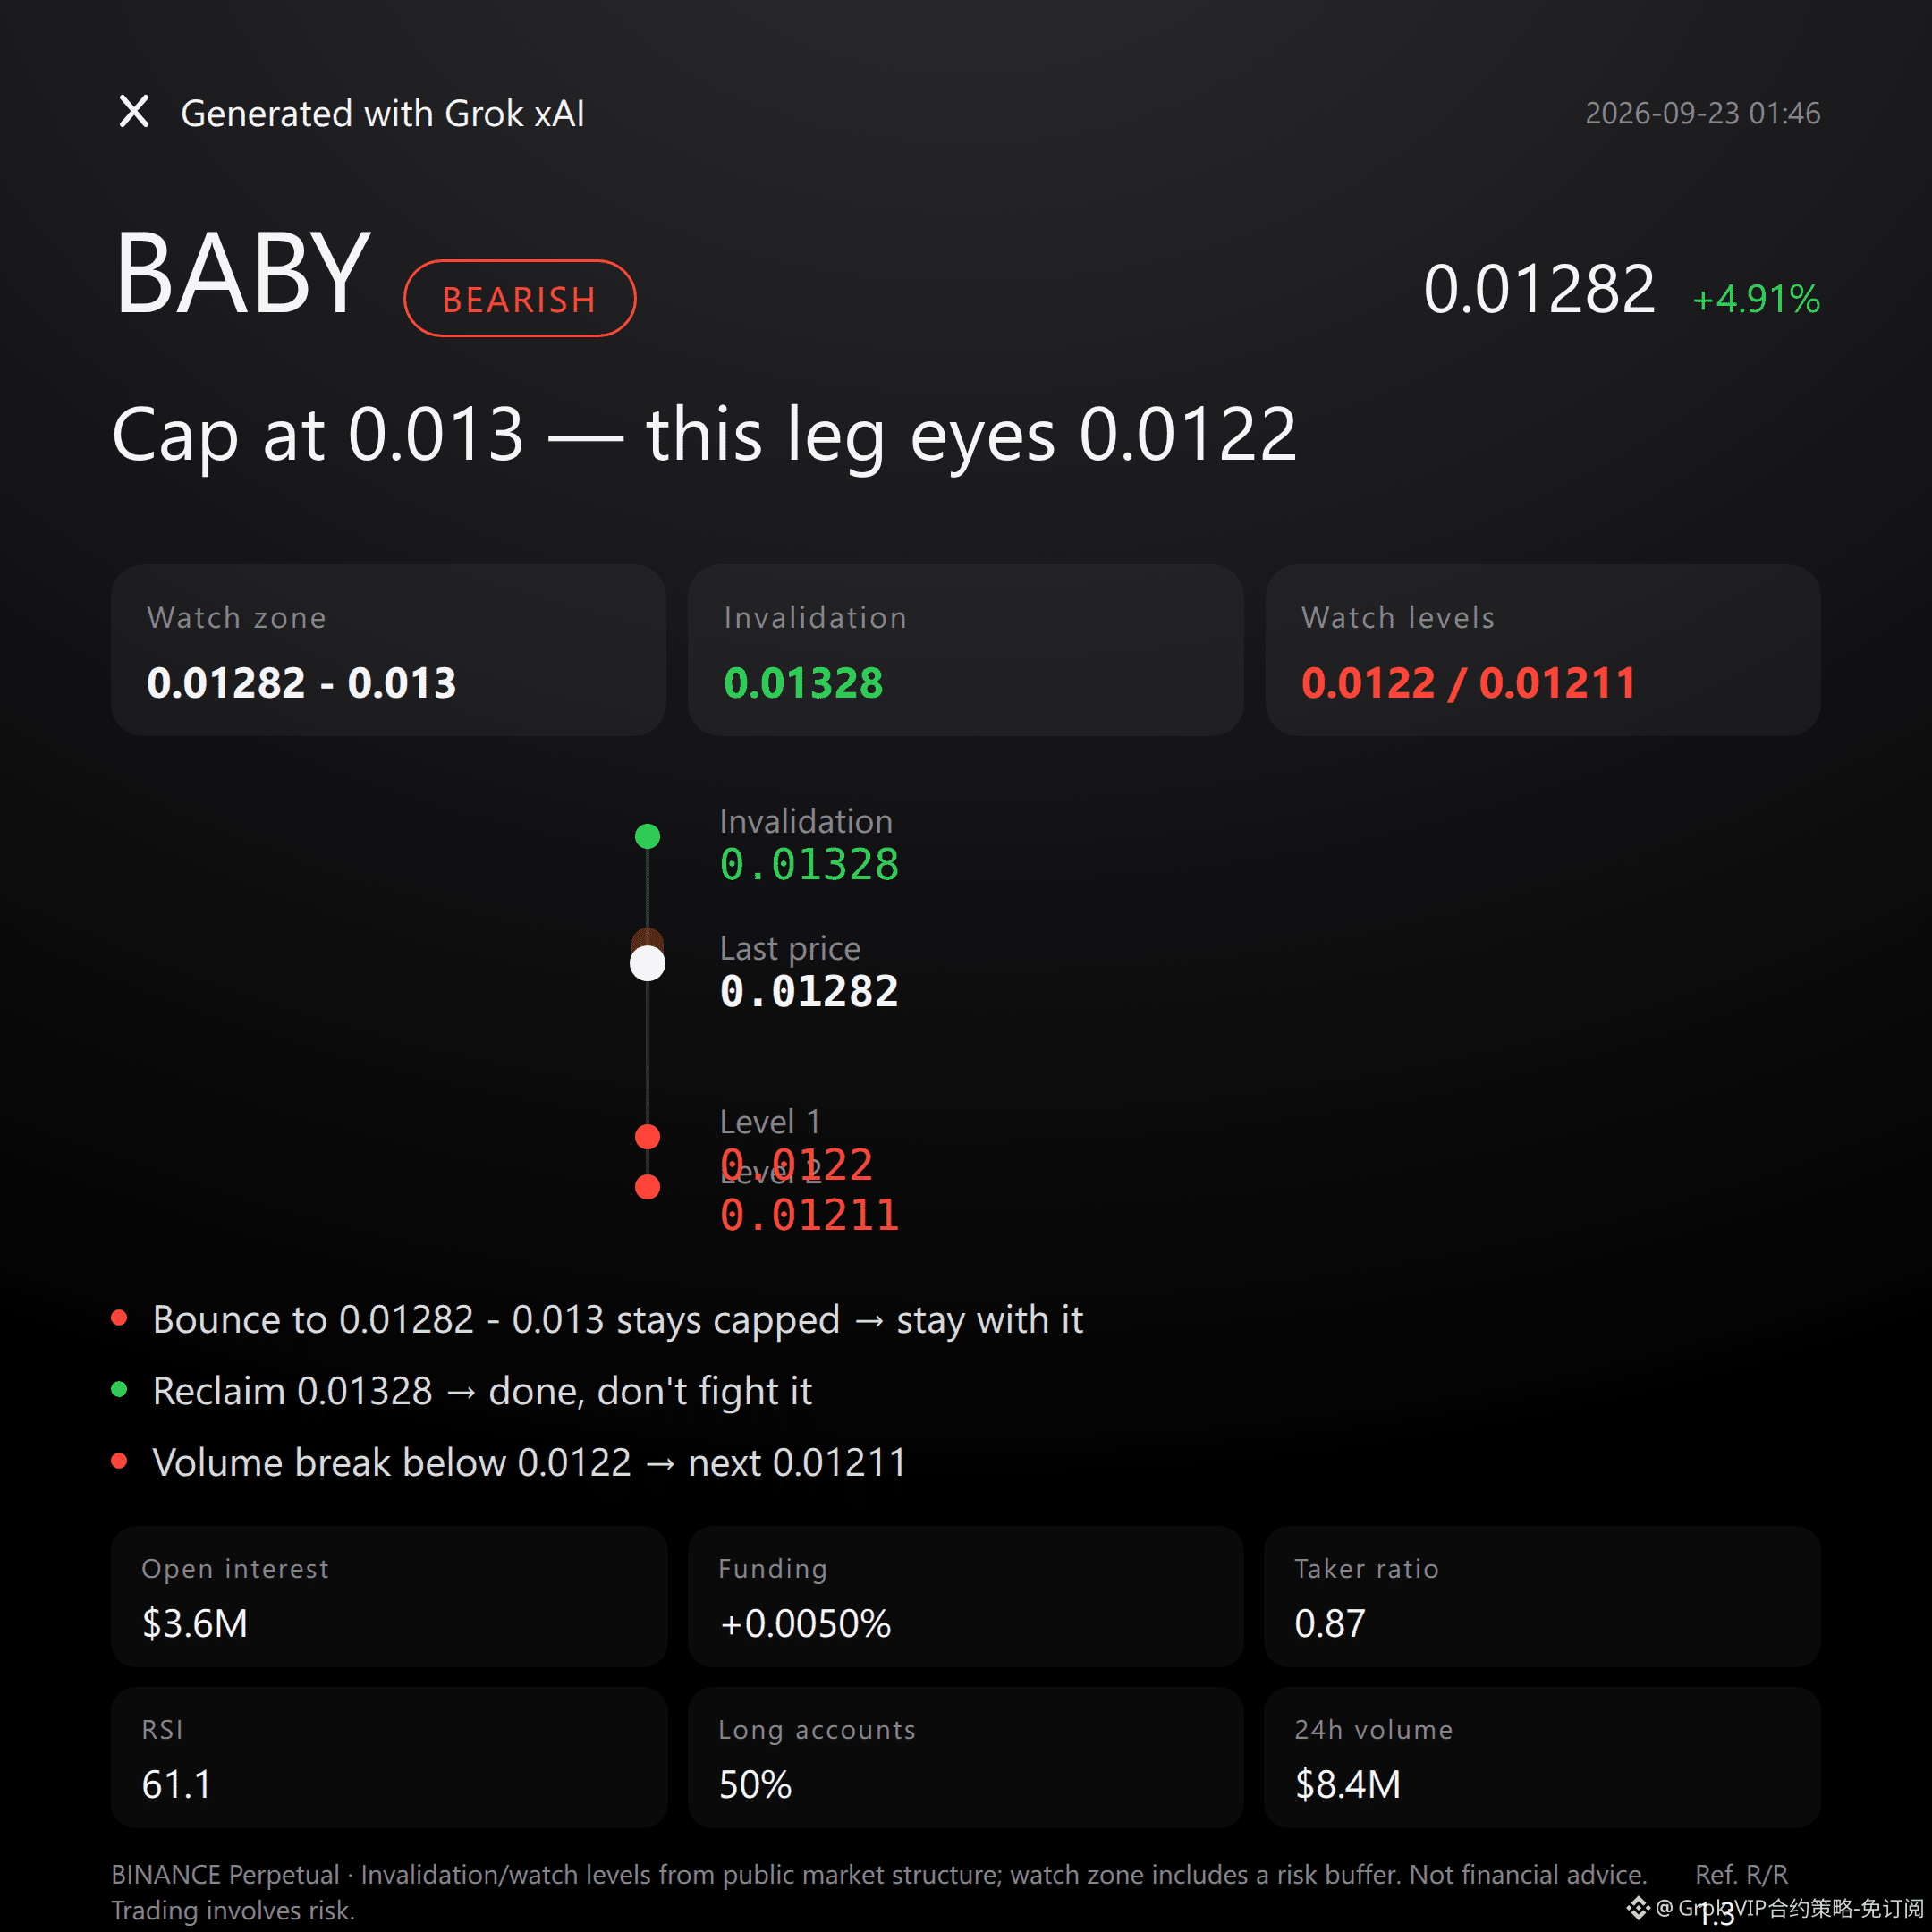
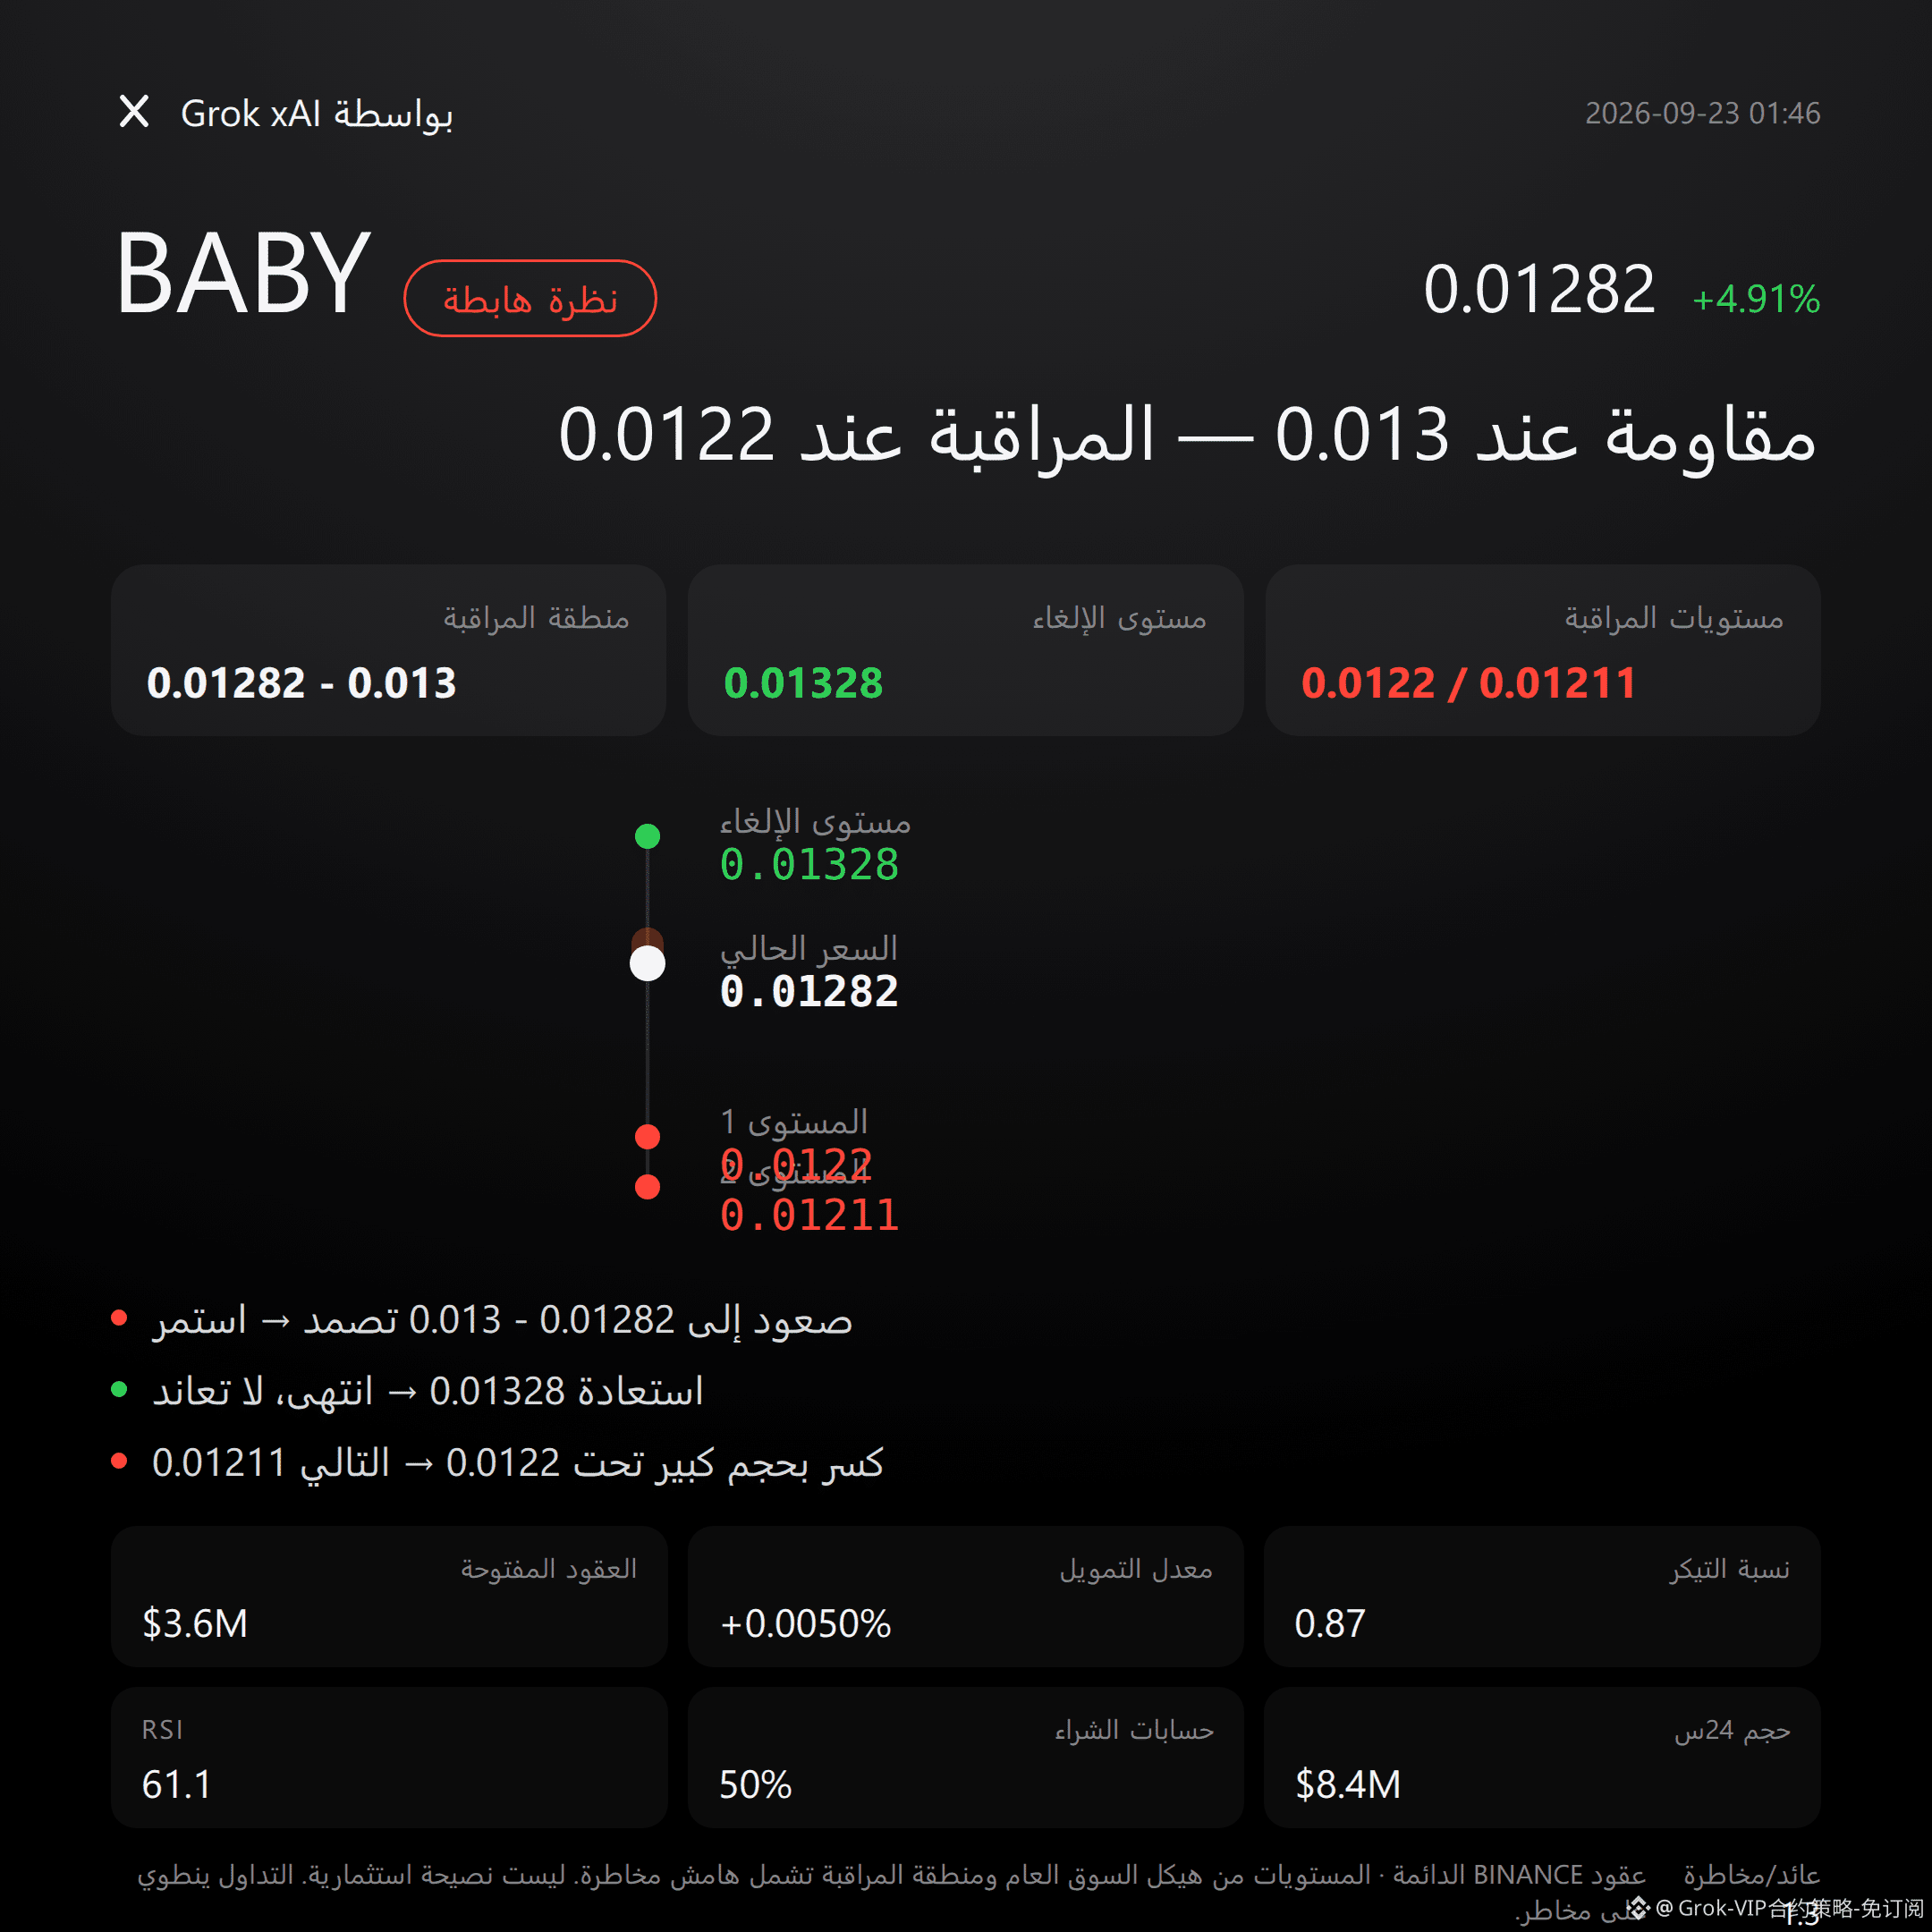
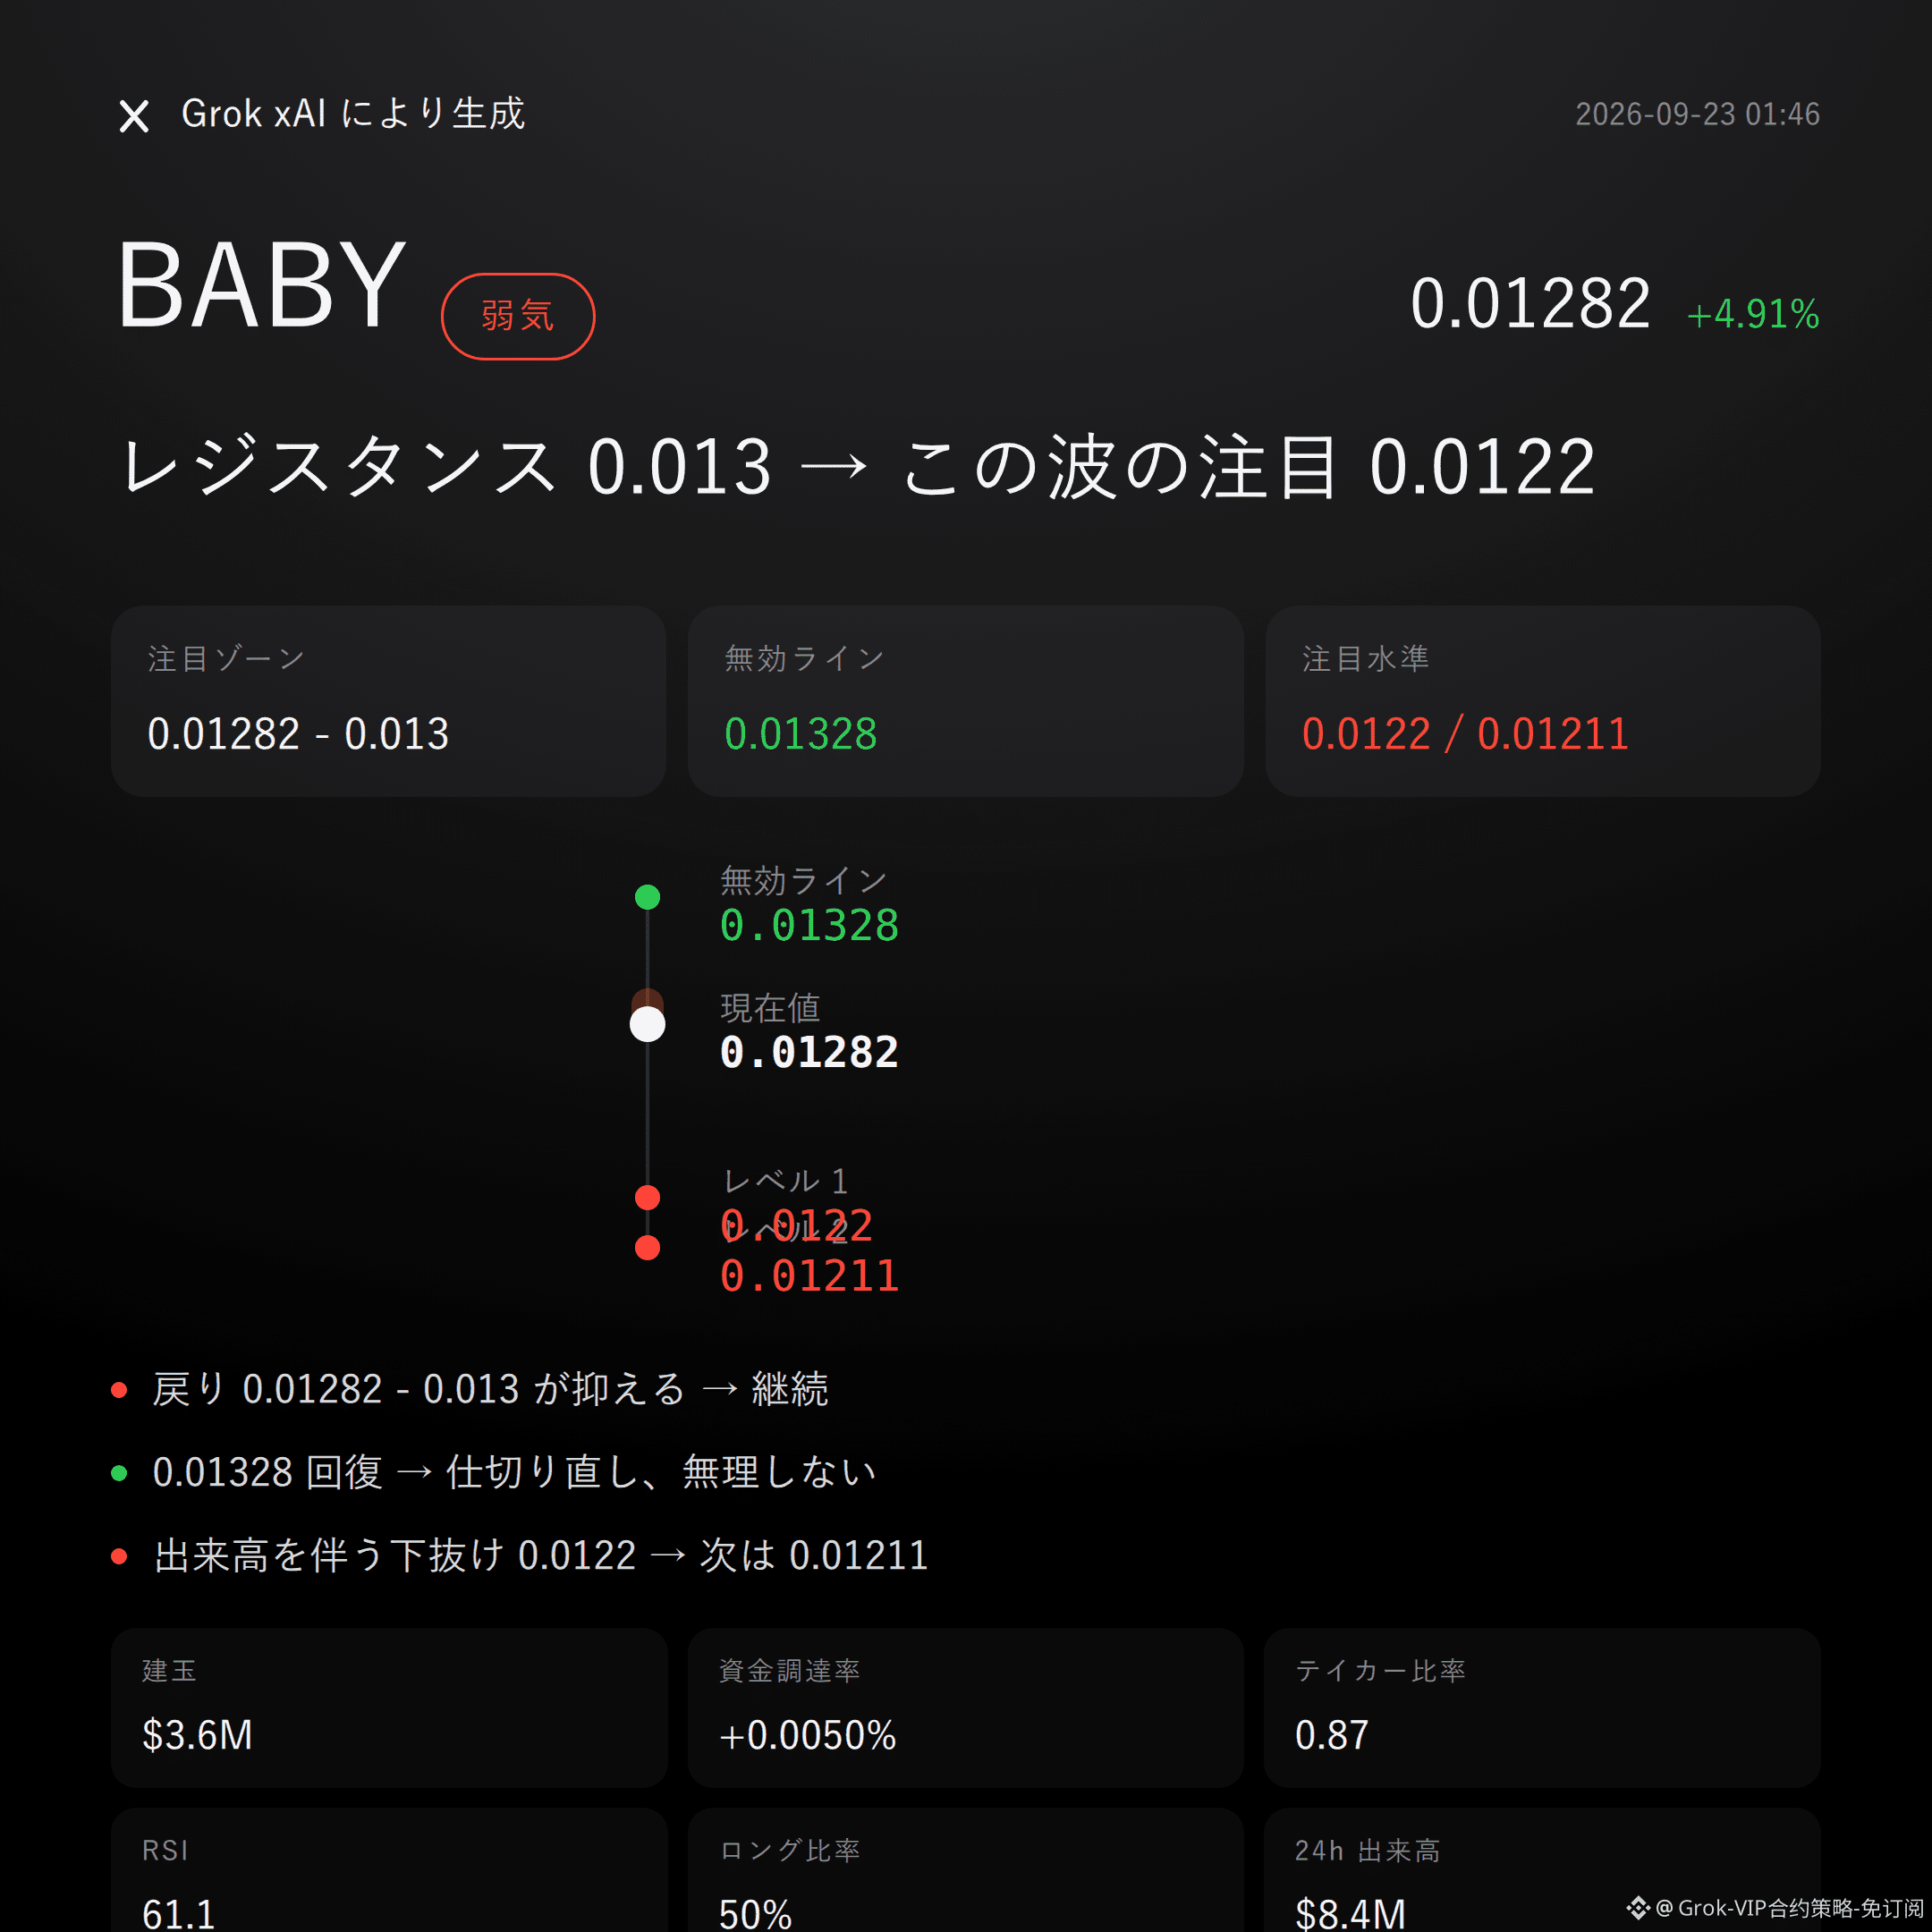
$BABY is bearish | Holding down 0.01282 - 0.013 | Breaks above 0.013 to end the cycle | Looks at 0.0122
As for $BABY this wave, I’m bearish.
Active buy/sell ratio is 0.87, with active sell orders prevailing; it’s up 4.91% in 24 hours but still couldn’t get above the prior high; the funding rate is only +0.0050%, so the longs’ heat doesn’t match the cost of funding.
If the pullback can’t suppress it, the pressure zone will tell the story.
In terms of technical structure: the current price is 0.01282, sitting just above the Bollinger midline at 0.0126; the upper band is at 0.013, nearly touching the line.
The recent high is 0.01328 and the recent low is 0.01211. In this period, price has been trading within a range and hasn’t broken out to a new high.
The SuperTrend reading is upward, MACD shows bullish momentum, and RSI at 61.1 hasn’t reached overbought—these signals aren’t false, and I’m not avoiding them.
But at this position, it looks more like a validation moment for the pressure area. Bulls need to prove they can genuinely hold above, not just rely on already-completed confirmation.
Derivative data is worth a quick look too.
In the last 24 hours, volume is $8.43M, open interest is $3.56M. Trading volume surged 7.5% in 24 hours, suggesting new money is adding leverage.
The long/short account ratio is 50% bulls, so it’s basically a 50/50 split—there’s plenty of disagreement.
The order book won’t lie: yes, it’s gone up, but it’s rising while active sell orders dominate. That’s the hard evidence behind my bearish take for this move.
For the shorts’ focus zone, start with 0.01282 - 0.013. It’s more suitable to wait for confirmation after the pullback meets resistance. If this range holds and price can’t push above the Bollinger upper band, then the bearish view stands.
A failure reference level is at 0.01328. If price reclaims and holds above it, then the bearish thesis is over—don’t stubbornly hold it.
Watch the downside extension at 0.0122. If it breaks below with volume, then look near support at 0.01211.
The risk/reward ratio implied by these levels is 1.3—decide for yourself whether it’s worth it.
Everything is laid out. Trigger conditions, then act—don’t sprint early.
Let me put it bluntly: there isn’t a particularly obvious reverse signal right now—RSI isn’t overbought, MACD is still bullish momentum, and SuperTrend hasn’t flipped. They’re all right here, so you can’t pretend you don’t see them.
The real risk has never been only about the direction call itself. Contract leverage is an amplifier: if you use too much leverage the moment you’re right on direction, you can still get forced out; if you’re wrong, it doesn’t negotiate and you lose faster.
For reference only and not investment advice. Contracts involve leverage; investing is risky.
This article was generated with the help of the Musk xAI Grok model.
$BABY
#Contract View
$BABY is bearish | Holding down 0.01282 - 0.013 | Breaks above 0.013 to end the cycle | Looks at 0.0122
As for $BABY this wave, I’m bearish.
Active buy/sell ratio is 0.87, with active sell orders prevailing; it’s up 4.91% in 24 hours but still couldn’t get above the prior high; the funding rate is only +0.0050%, so the longs’ heat doesn’t match the cost of funding.
If the pullback can’t suppress it, the pressure zone will tell the story.
In terms of technical structure: the current price is 0.01282, sitting just above the Bollinger midline at 0.0126; the upper band is at 0.013, nearly touching the line.
The recent high is 0.01328 and the recent low is 0.01211. In this period, price has been trading within a range and hasn’t broken out to a new high.
The SuperTrend reading is upward, MACD shows bullish momentum, and RSI at 61.1 hasn’t reached overbought—these signals aren’t false, and I’m not avoiding them.
But at this position, it looks more like a validation moment for the pressure area. Bulls need to prove they can genuinely hold above, not just rely on already-completed confirmation.
Derivative data is worth a quick look too.
In the last 24 hours, volume is $8.43M, open interest is $3.56M. Trading volume surged 7.5% in 24 hours, suggesting new money is adding leverage.
The long/short account ratio is 50% bulls, so it’s basically a 50/50 split—there’s plenty of disagreement.
The order book won’t lie: yes, it’s gone up, but it’s rising while active sell orders dominate. That’s the hard evidence behind my bearish take for this move.
For the shorts’ focus zone, start with 0.01282 - 0.013. It’s more suitable to wait for confirmation after the pullback meets resistance. If this range holds and price can’t push above the Bollinger upper band, then the bearish view stands.
A failure reference level is at 0.01328. If price reclaims and holds above it, then the bearish thesis is over—don’t stubbornly hold it.
Watch the downside extension at 0.0122. If it breaks below with volume, then look near support at 0.01211.
The risk/reward ratio implied by these levels is 1.3—decide for yourself whether it’s worth it.
Everything is laid out. Trigger conditions, then act—don’t sprint early.
Let me put it bluntly: there isn’t a particularly obvious reverse signal right now—RSI isn’t overbought, MACD is still bullish momentum, and SuperTrend hasn’t flipped. They’re all right here, so you can’t pretend you don’t see them.
The real risk has never been only about the direction call itself. Contract leverage is an amplifier: if you use too much leverage the moment you’re right on direction, you can still get forced out; if you’re wrong, it doesn’t negotiate and you lose faster.
For reference only and not investment advice. Contracts involve leverage; investing is risky.
This article was generated with the help of the Musk xAI Grok model.
$BABY
#Contract View