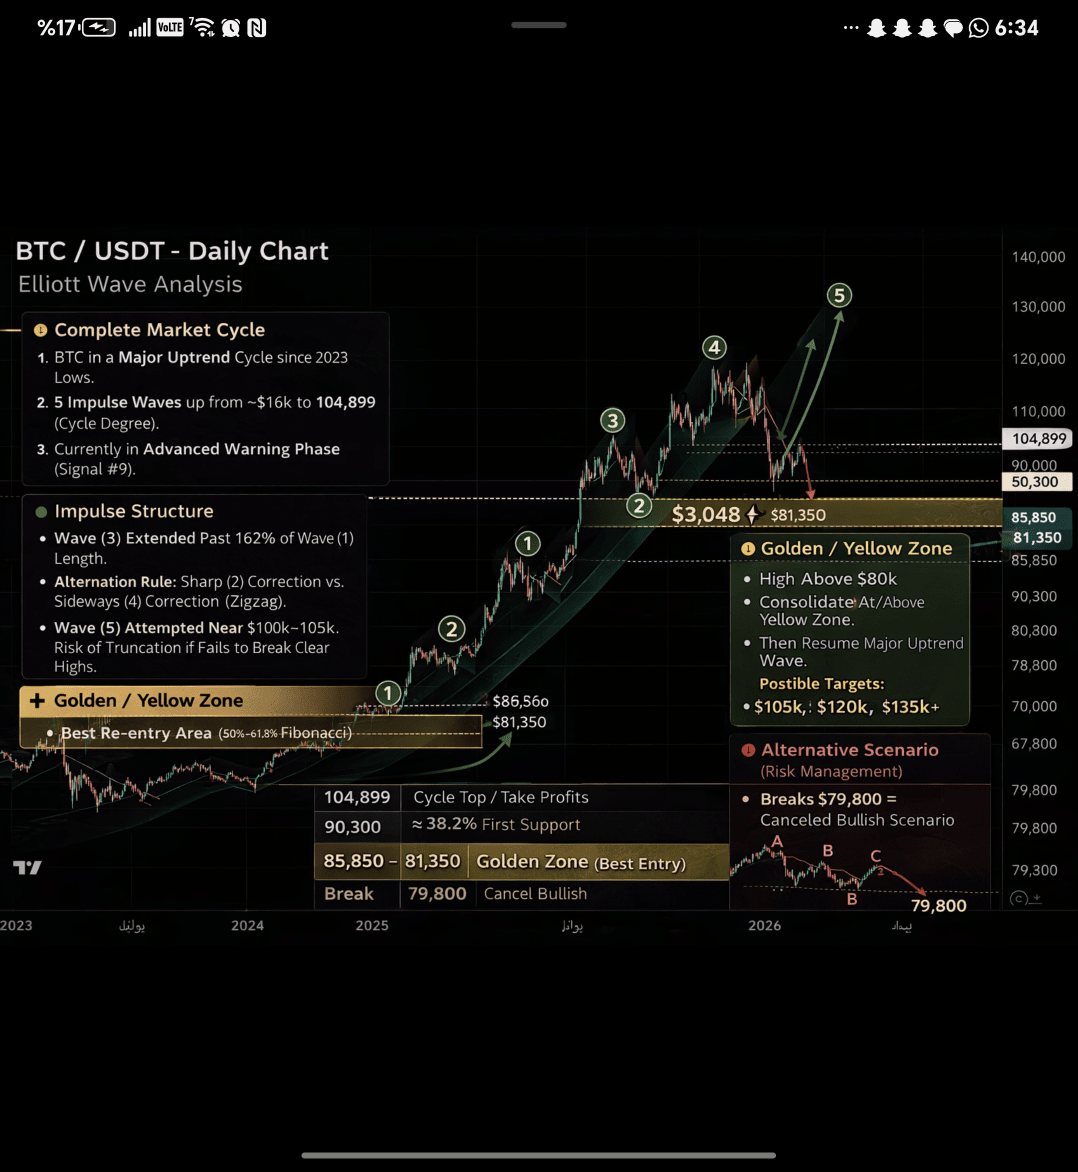
📊 BTC/USDT Analysis – Daily Time Frame
According to Elliott Wave Theory (complete numbering + signals + yellow zone)
1️⃣ The overall market cycle (Complete Market Cycle)
Bitcoin is undergoing a major bullish cycle that started from the lows of 2023.
The upward movement is formed from 5 impulsive waves according to the classical model.
The rise from the 16,000$ area to the peak of 104,899$ represents the major impulse wave.
We are currently in an advanced alert stage indicating the end or near end of the minor fifth wave within the upward cycle.
2️⃣ Impulse wave numbering (Impulse Structure)
The third wave is clearly extended (exceeded 162% of the first wave's length), which aligns with the fundamental view of Elliott's theory.
The principle of alternation is respected:
Wave (2): Sharp and quick correction.
Wave (4): Sideways/Deviant Correction (Sideways – Flat / Zigzag).
Fifth wave:
The price attempted to complete it near 100k–105k.
There is a risk of truncation if the price fails to strongly exceed the previous peak.
3️⃣ Technical signals (Elliott Signals)
The market is currently at:
Point 7: Alert of reversal after completing the driving structure.
Point 8: Beginning of a complex corrective phase (fourth wave or beginning A).
Point 9: High-risk area after the fifth (does not mean a confirmed reversal but a warning).
The recent decline is considered a preliminary alert of a shift in price behavior from impulse to correction.
4️⃣ Yellow zone (Golden / Yellow Zone)
Highest peak: 104,899$
Beginning of the final upward wave: 66,800$
📐 Fibonacci levels:
50% ≈ 85,850$
61.8% ≈ 81,350$
🟨 Area between 81,350$ – 85,850$
Represents the best re-entry areas with minimal risk
Smart liquidity area, not an area to expect a top or bottom
5️⃣ Potential scenarios
🟢 Main scenario (most likely)
Price stability above 80k
Consolidation within or above the yellow area
followed by a new rally to continue the upward trend (larger fifth wave or new wave)
🎯 Potential targets later:
Re-testing 105k
then 120k – 135k according to momentum
🔴 Alternative Scenario (Risk Management)
Breaking 79,800$ with a clear daily close → Temporarily fails the bullish scenario → Correction turns into a deeper A-B-C model → Targeting lower areas to rebuild a new cycle
6️⃣ Executive summary
Level Significance
104,899$ Cycle peak / Profit-taking
~90,300$ First support (38%)
85,850 – 81,350$ 🟨 Yellow zone (Best entry)
Breaking 79,800$ Temporarily cancels the bullish scenario
Summary
> Bitcoin is still within a major upward trend,
But the market is currently in a testing and patience phase after a strong impulse wave.
The yellow area is a liquidity decision area, not a panic area.