On the chart $SOL a classic drama is unfolding right now. We see how the asset is struggling for life, but the technical indicators are relentless.
Situation analysis by photo:
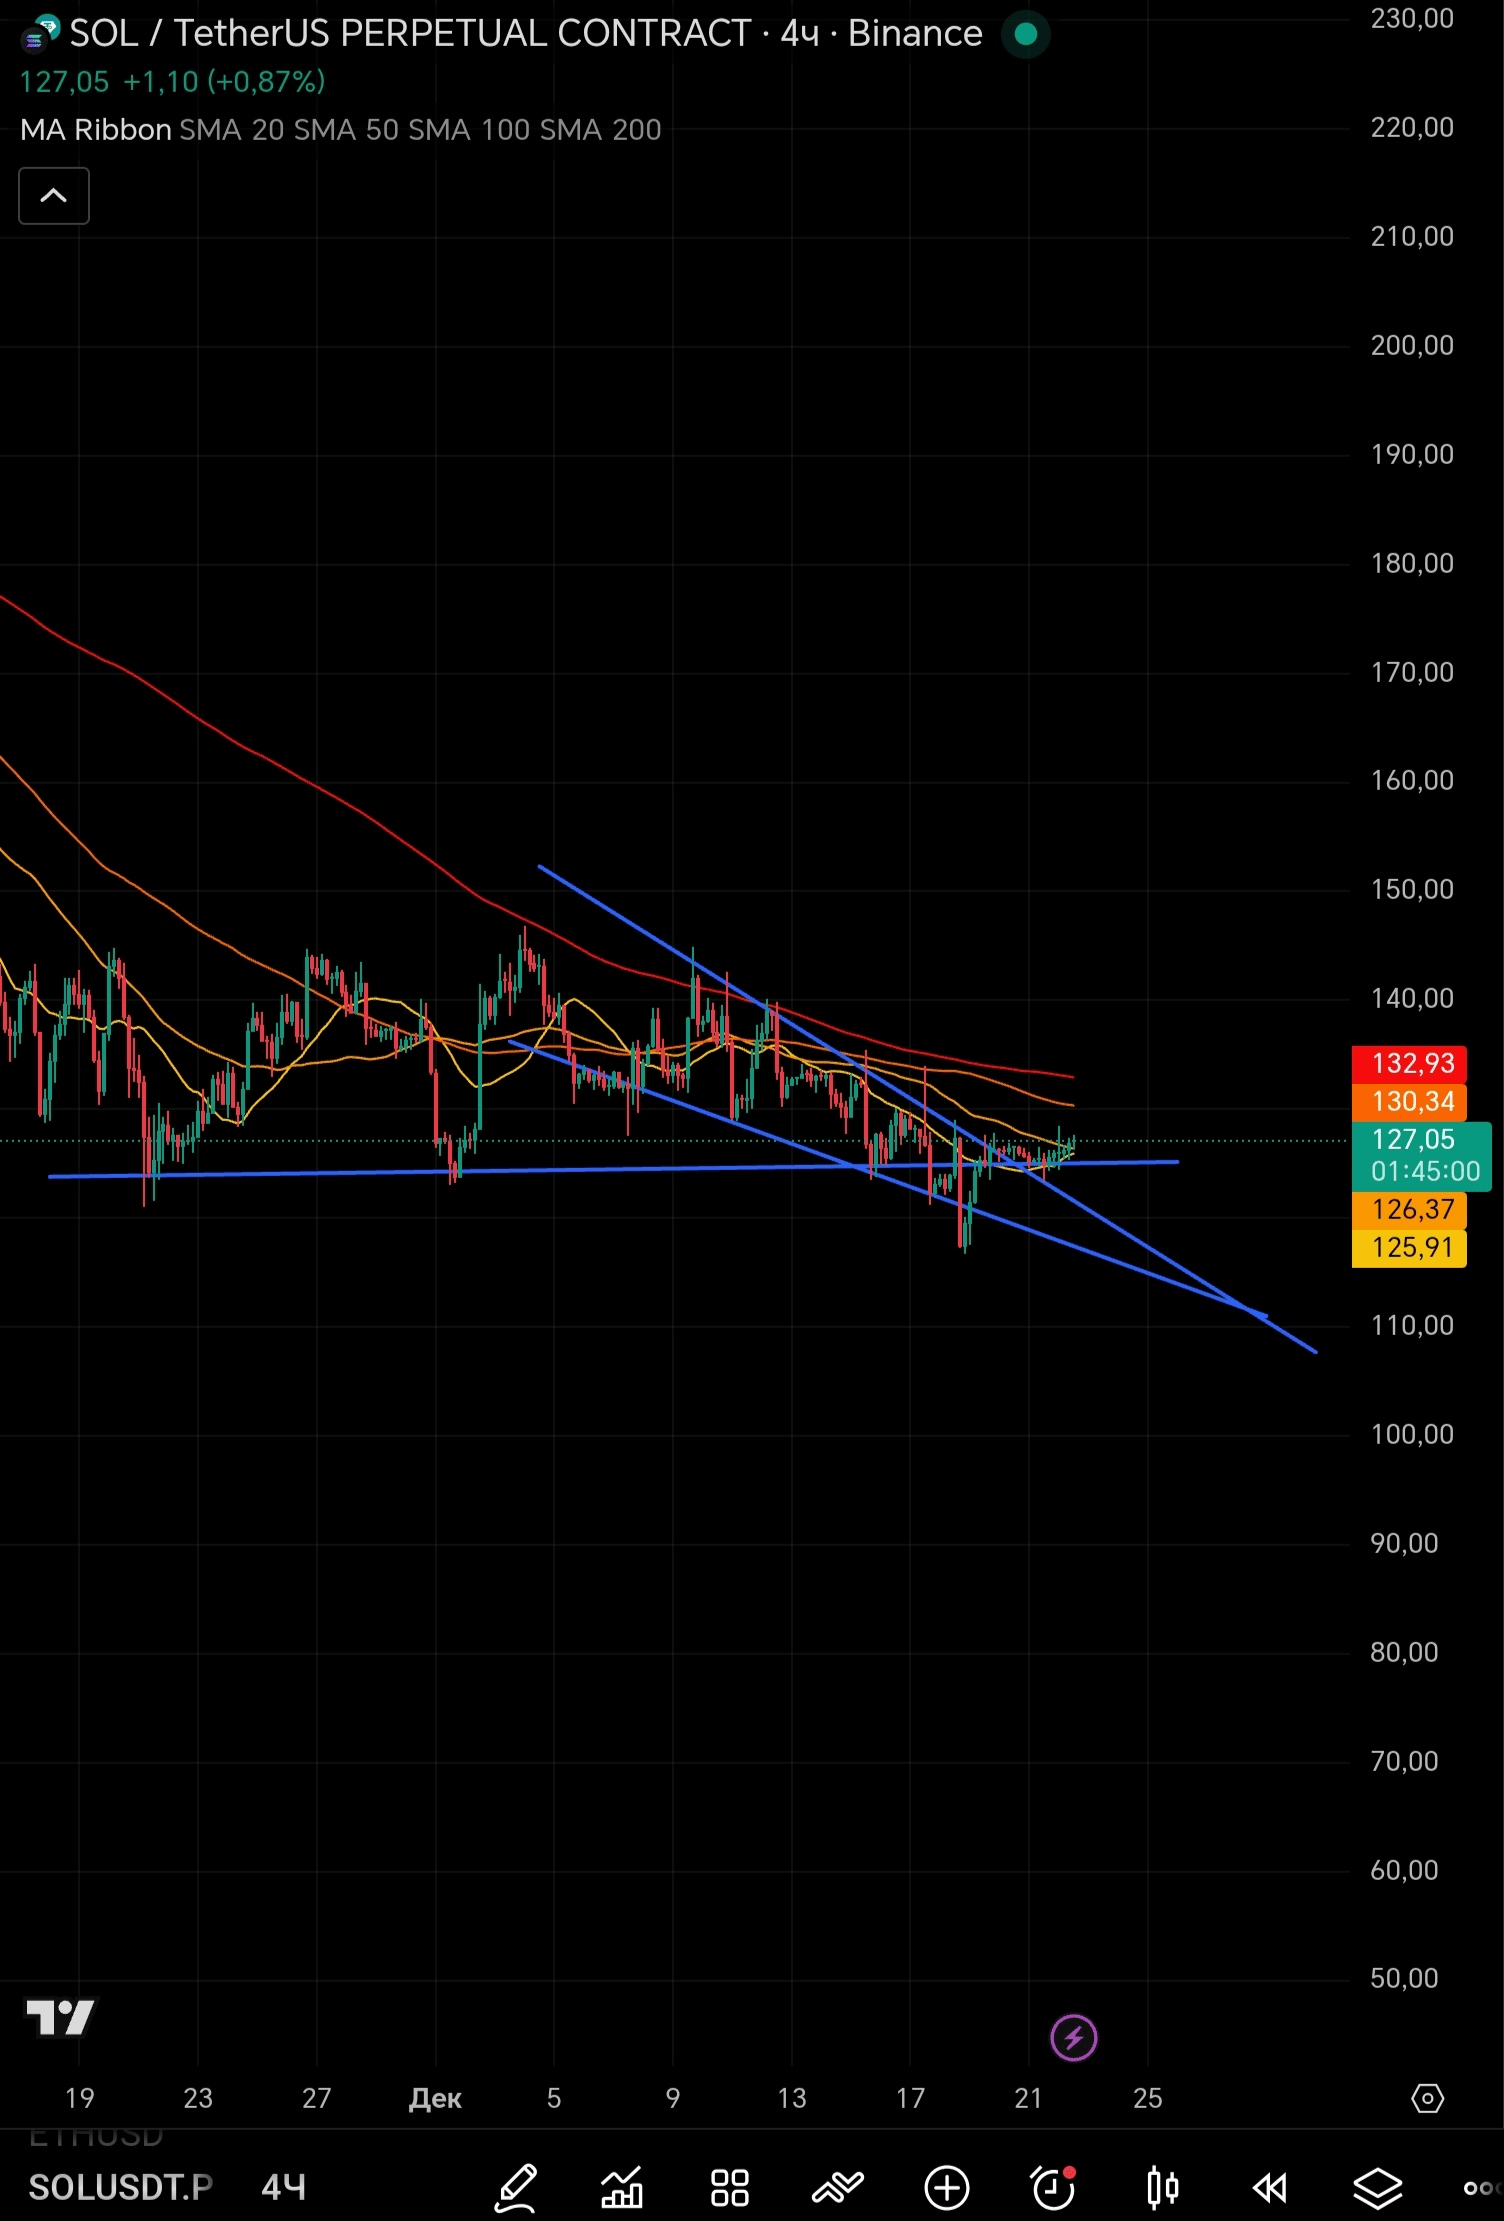
Break of dynamic support: The blue trend line, which held the price for a long time, has been broken down. We see a retest of this line from below — this is a classic bearish signal 'break + retest.'
MA Ribbon compression: The moving averages (MA ribbon) are currently acting as strong resistance. The price is below them, confirming a short-term downward trend. The ribbons have started to 'expand' downwards, increasing pressure.
Key levels: * Support: The price is currently clinging to the $126 - $127 level. If we don't hold it — the next stop is around $110 - $111.
Resistance: The zone $130 - $133 has become a 'concrete wall'. Until we return above it, it's too early to think about longs.
Inside from Smart Money:
Despite the current price, the data shows that institutions have started to take profits. The technical rating for SOL today is 'Strong Sell' (active selling).
🎓 TEACHING MOMENT: WHY IS TRENDING NOT A DOGMA?
Many beginners think that if the price touches the line, they should buy immediately. This is a mistake! * Lesson: Look at the breakout candle. In the photo, we see a confident close below the blue line. This means that buyers are no longer willing to defend this level.
Advice: Never enter a trade at the moment of touching. Wait for confirmation (retest). Right now we are seeing a retest that has turned previous support into new resistance.
What do I think❓: 🎯
If the daily candle closes below $126, we will see an acceleration of the decline to $117 and below. I remain on the sidelines and wait for the resolution.
What do you see on this chart? 🤔
Write in the comments: is this a 'false breakout' or the beginning of a deep correction by the New Year? 👇


