
EDUUSDT
Perp
0.1481
+0.68%
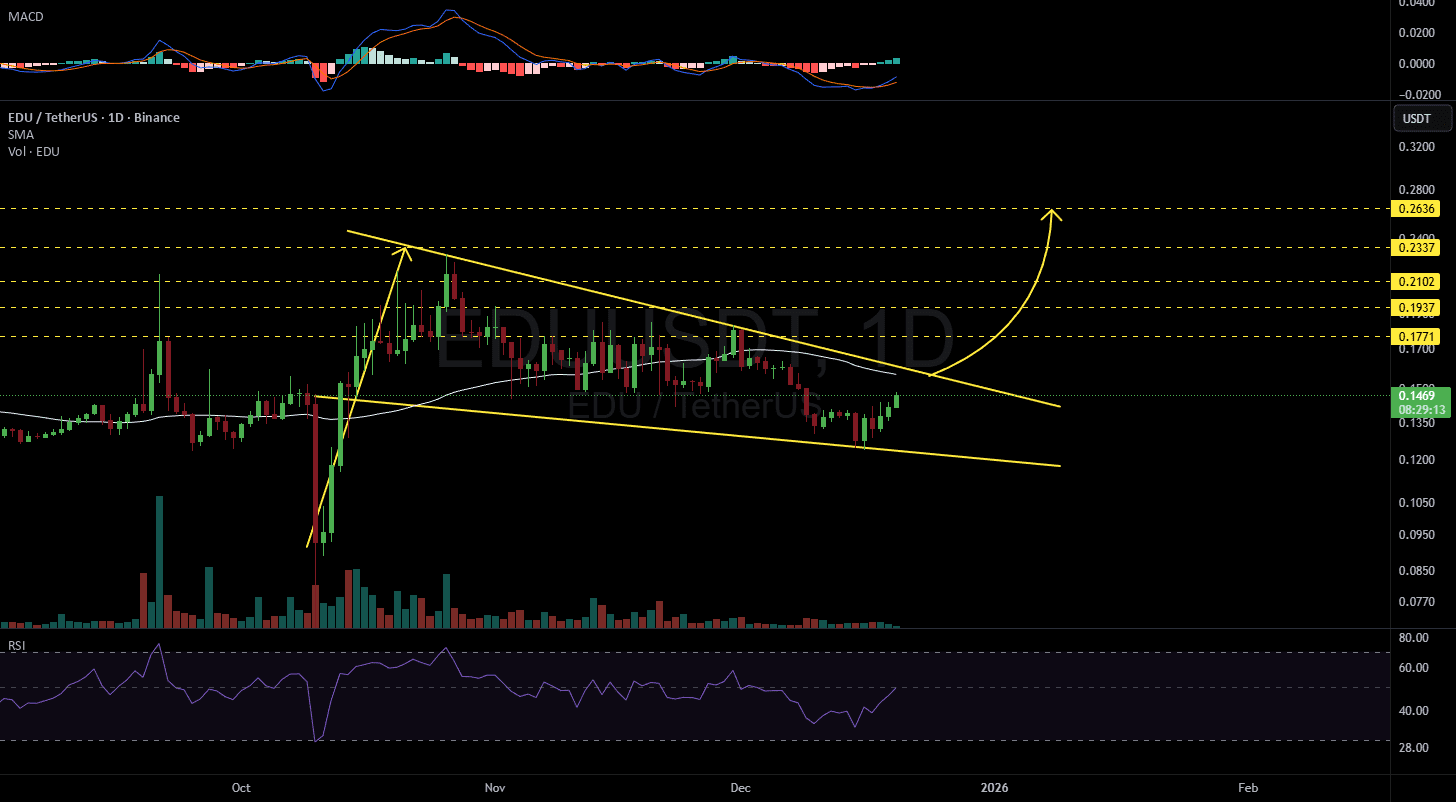 Monitor the daily chart for #EDU . The Relative Strength Index (RSI) and MACD indicator suggest a bullish momentum wave. If the price breaks above the bullish flag and the daily moving average SMA50, the potential targets for the rise are:
🎯 $0.1771
🎯 $0.1937
🎯 $0.2102
🎯 $0.2337
🎯 $0.2636
⚠️ Note:
This analysis is for educational purposes only and does not encourage trading in futures or any prohibited transactions. The aim is to illustrate potential market movements, not a direct recommendation to buy or sell.
💡 Important notes:
- This analysis is for educational purposes only.
- Please study the market and make decisions based on your ability and risk tolerance.
- The author is not responsible for others' trading or their profit results.
