On-chain data indicates that the net Ethereum flow from exchanges saw a sharp decline over the past week, which may be a potential signal that investors are accumulating.
### The net Ethereum flow from exchanges was negative over the past week
As the decentralized institutional financing provider Sentora stated in a new post on X, Ethereum experienced net outflows from exchanges over the past week. The relevant indicator here is the "net exchange flow," which measures the net amount of Ethereum moving to or from wallets associated with centralized exchanges.
When the value of this indicator is positive, it means that investors are depositing a net amount of tokens on these platforms. Since one of the main reasons holders deposit their coins on exchanges is for selling purposes, this type of trend can be bearish for the asset's price.
On the other hand, when the indicator is below zero, it indicates that outflows dominate inflows. Such a trend can be a sign that investors are in an accumulation phase, which can naturally be bullish for the cryptocurrency.
As the data shared by Sentora shows, Ethereum experienced a weekly net outflow of -978.45 million dollars, indicating that traders have withdrawn a massive net amount.
(Weekly change in Ethereum network fees and net exchange flow | Source: Sentora on X)
The large outflows came with a decline in Ethereum over the past week. As Sentora explains:
> This indicates aggressive accumulation as investors are likely "buying the dip" and pulling assets into cold storage or on-chain environments, tightening the liquid supply despite the negative price momentum.
The price drop last week was accompanied by a decrease in total transaction fees on the network, indicating that transfer activity has declined. The chain saw around $2.64 million in fees over the past week, a drop of more than 15% week-over-week.
### Ethereum saw a brief visit below $2800 before rebounding
Ethereum fell to $2780 on Thursday, but the asset managed to rebound as it now floats just below $3000.
(Price trend of the currency over the past five days | Source: ETHUSDT on TradingView)
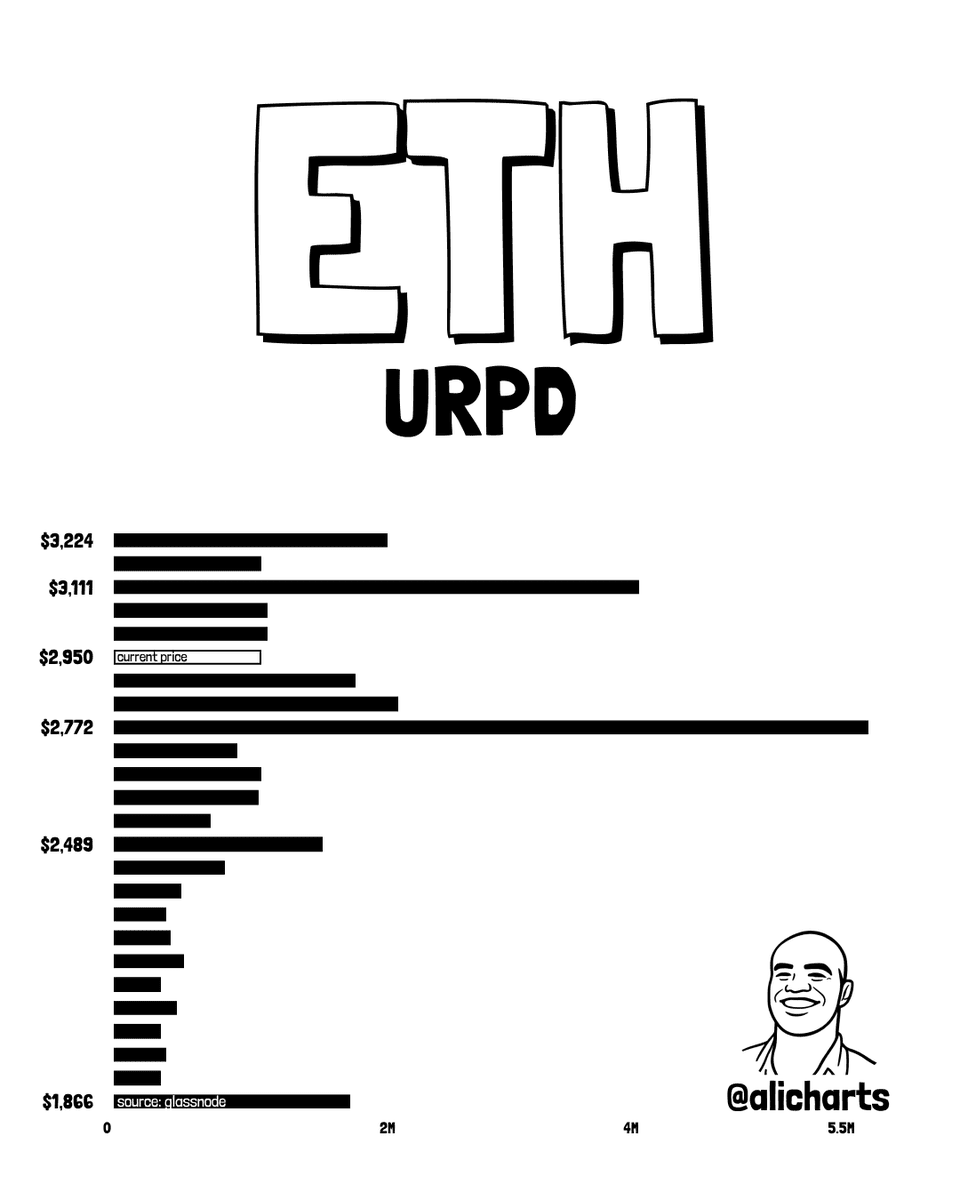
Interestingly, Ethereum's bottom was around the same level as a major on-chain supply zone, as shown in a chart shared by analyst Ali Martinez in a post on X.
(How the current UTXO price distribution looks for Ethereum | Source: @ali_charts on X)
In the chart, Martinez attached UTXO price distribution data for Ethereum from the on-chain analytics firm Glassnode. This indicator essentially tells us how much Ethereum supply had its last transaction at the various price levels that the coin has visited in its history.
There is a massive supply zone at $2772 in the distribution, indicating that a large number of investors have a cost basis at that level. Generally, such levels act as support during bearish trends, as traders who bought there buy the dip to defend it.
Disclaimer: The information on NewsBTC is for educational purposes only. It does not represent NewsBTC's views on whether to buy, sell, or hold any investments, and inherently investing carries risks. You are advised to do your own research before making any investment decisions. Use the information provided on this site at your own risk.
@Binance Angels @Binance Square Official $ETH
