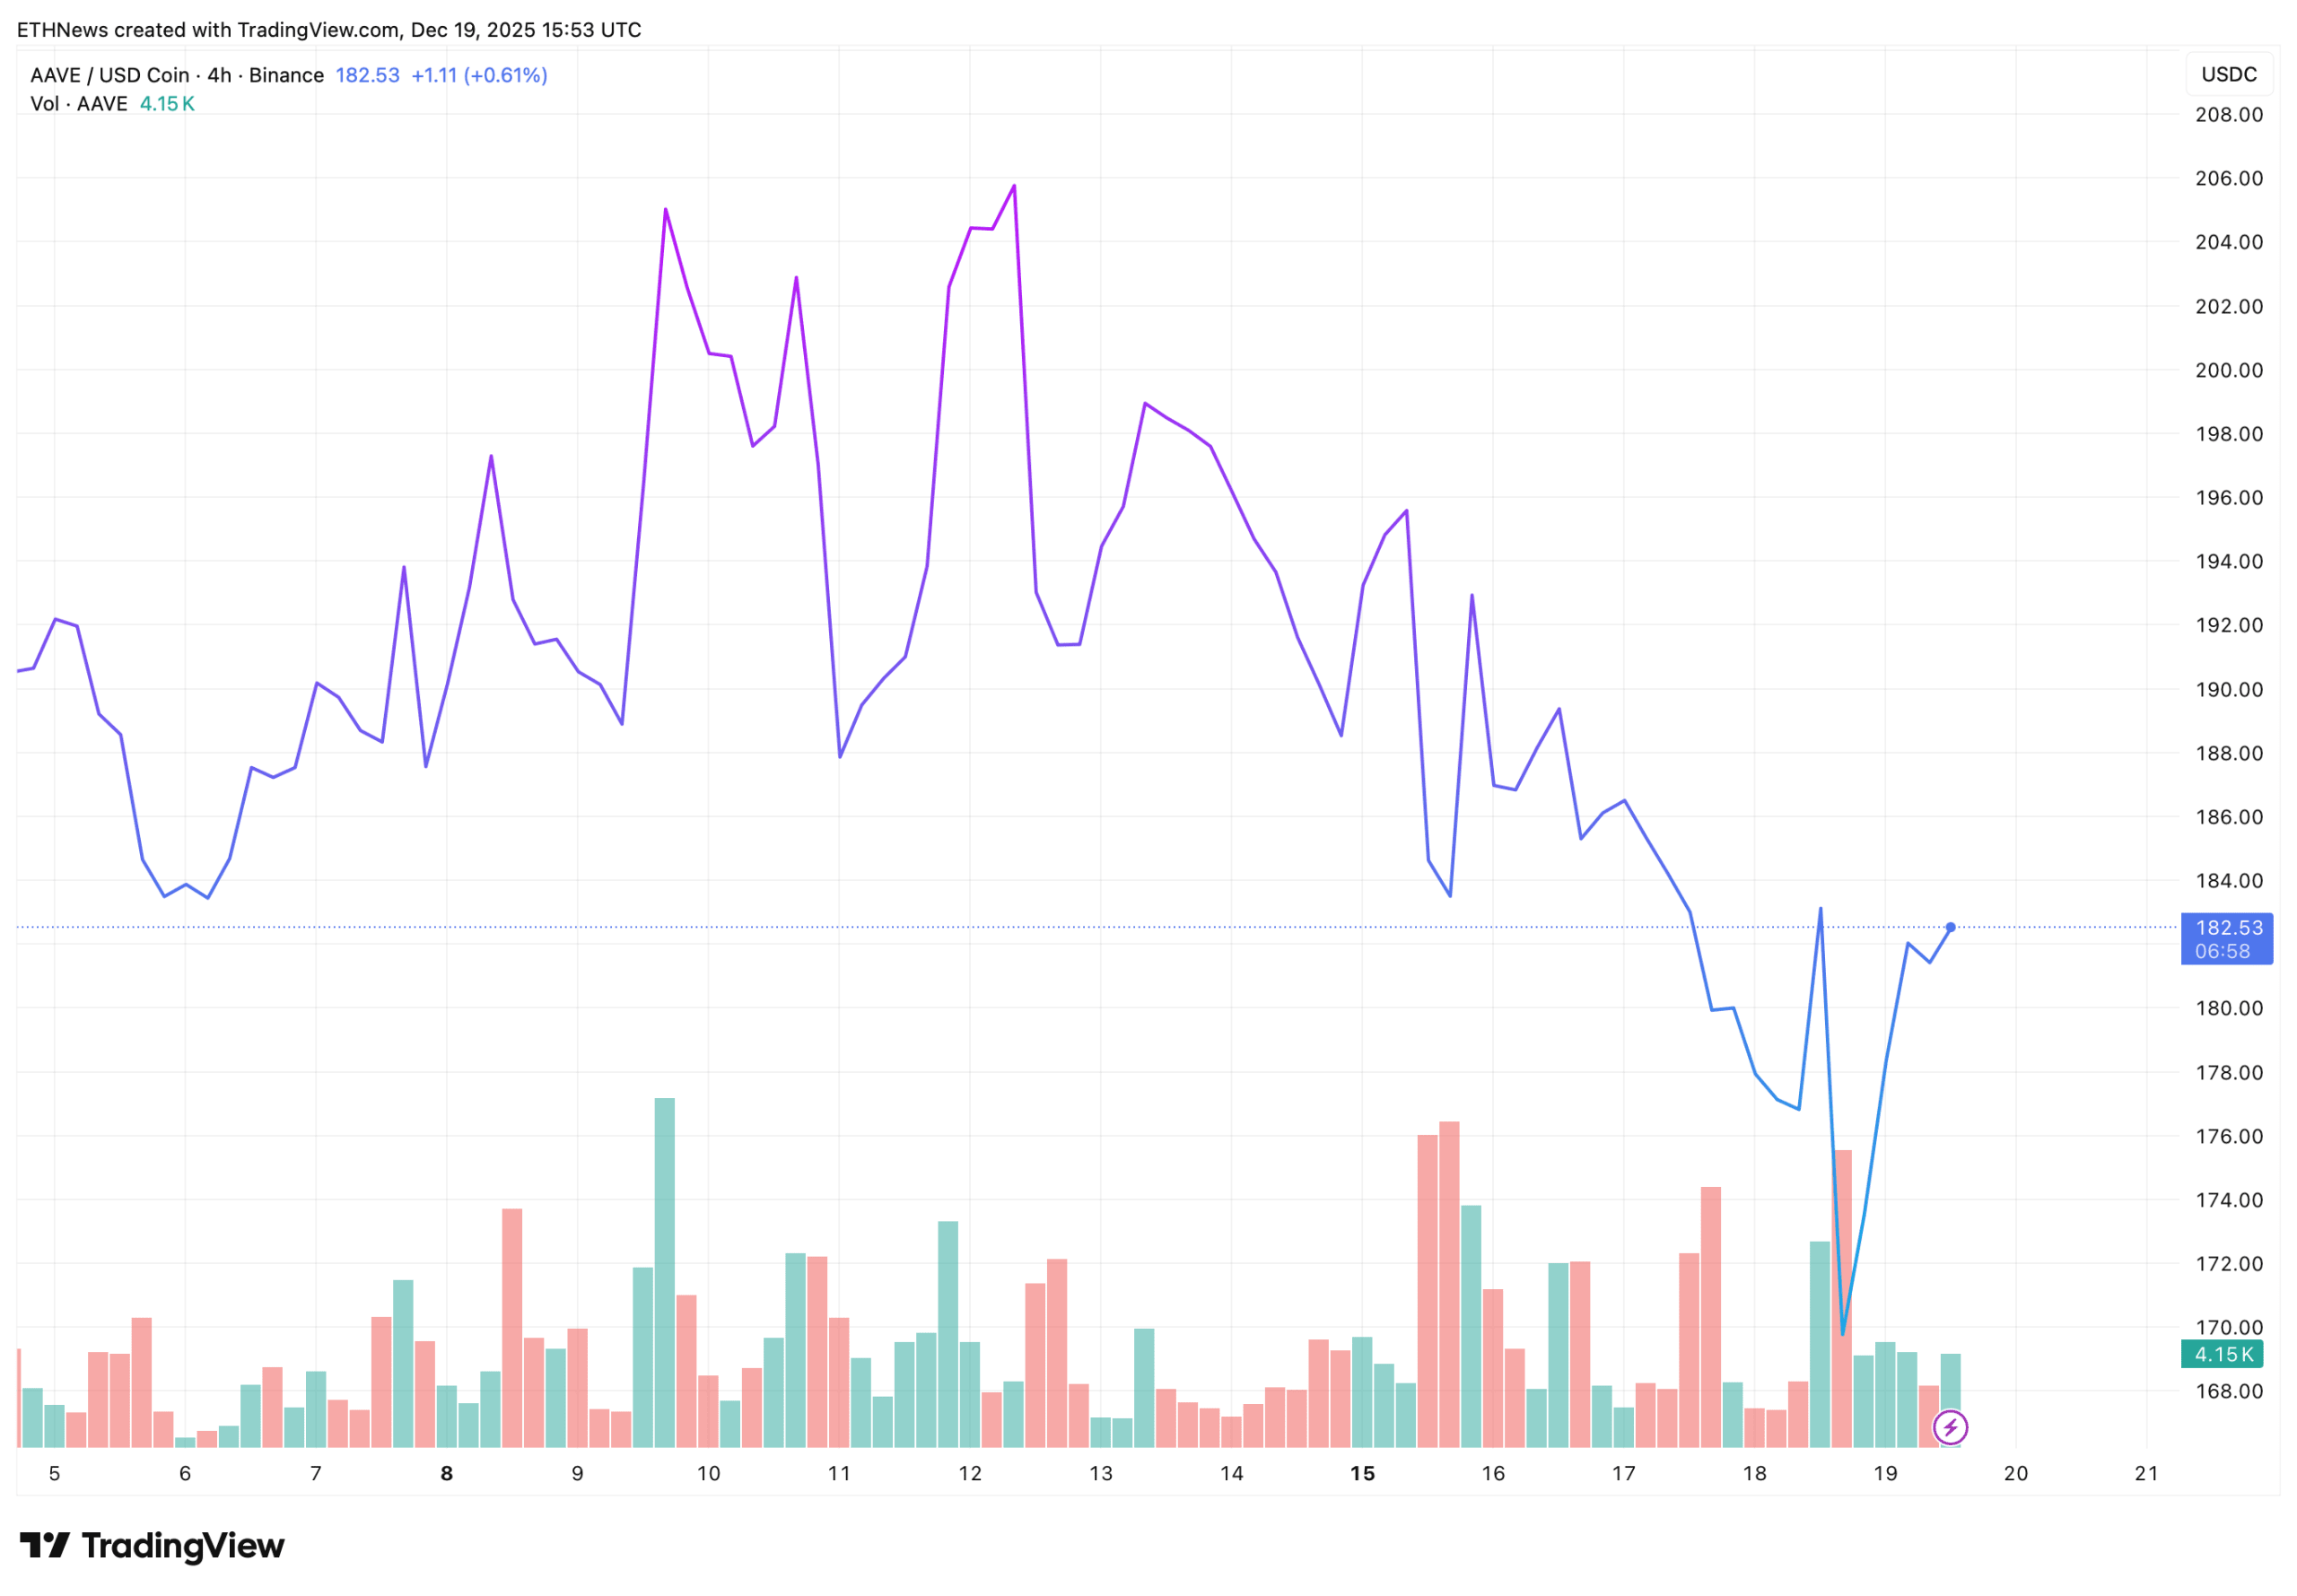
The article discusses the price movement of AAVE against USDC on the 4-hour chart, noting a sharp decline followed by a recovery. The movement is interpreted as forced selling rather than ongoing distribution, with increased volume during the decline indicating capitulation. The price bounced towards the $182 area and began to stabilize below the recent local peaks, while maintaining a broader neutral structure. The chart shows a base formation after the volatility, where buyers defended the area after the decline but without strong follow-through momentum.
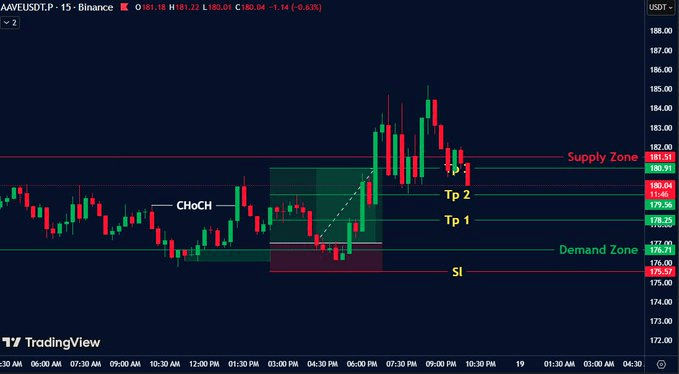
### Trading Setup for Merlijn The Trader on AAVE/USDT
Trader Merlijn The Trader shared a short-term trading setup focused on a defined structure with clear risks and precise execution, independent of the broader market direction. Key details include:
- Pair: AAVE/USDT
- Entry Point: $177.08
- Stop Loss (SL): $175.57
- Take Profit (TP): $180.91
Chart elements:
- 'Change of Character' (CHoCH) represents a short-term shift from bearish to bullish structure.
- Price moved impulsively upward from the demand area, confirming buyer strength.
- The setup places the stop loss below the demand area and targets near the overhead supply.
- Captures measured movement within the current range, without assumption of continuation beyond targets or full trend reversal.
- Risk framework is tight, focusing on risk control rather than prediction.
The setup is part of the 100K Phase 1 with a 1% risk allocation.
### Chart Integration
- The 4-hour chart depicts selling pressure volatility, with price stabilizing in broader consolidation.
- Merlijn's setup focuses on this consolidation phase for a tactical long position based on structure and invalidation levels.
- Together, they indicate short-term opportunities in a neutral to range-bound environment, without confirmation of a larger breakout.
- Staying above the recent demand area on the lower timeframe keeps the short-term structure intact; failure to do so invalidates the setup and returns to broader consolidation.
### Detailed Technical Analysis
- Timeframe: 4-hour chart for AAVE/USDC.
- Price Levels: Sharp decline followed by a rebound towards the $182 area; recent local highs above the current price; demand area (implied below entry levels); overhead supply near profit-taking.
- Indicators/Concepts: Change of Character (CHoCH) for structural shift; increased volume during bearish breakdown indicates capitulation; no other specific indicators mentioned.
- Support/Resistance: Defended demand area after the drop (stop loss at 175.57 below it); resistance near 180.91 for profit-taking and recent highs.
- Chart Description: The 4-hour chart shows an aggressive rapid bearish impulse, quick recovery, and stabilization below the highs; the lower timeframe highlights impulsive movement above the demand area.
- Outlook/View: Short-term opportunity in a consolidation phase; broader structure neutral; no assumption of trend reversal or continuation beyond targets; invalidation upon failure of the demand area returns to consolidation.
### Summary
The article concludes that AAVE's stability indicates a relief from short-term selling pressure, but the neutral structure persists without decisive bullishness. The trading setup offers a defined-risk approach to capitalize on the rebound within the range.
@Binance Square Official $AAVE
