
📊 Current Market Context
XRP price is weakening alongside broader crypto, trading roughly around the $1.90–$2.00 level amid risk-off sentiment and a broader crypto pullback.
Recent breakdown below key support suggested some technical trouble and risk of further pullback.
Broader markets (Bitcoin, Ethereum) are also soft, which has pressured altcoins like XRP.
Some analysts are seeing bearish chart patterns (e.g., double tops) that warn of resistance and lower highs ahead.
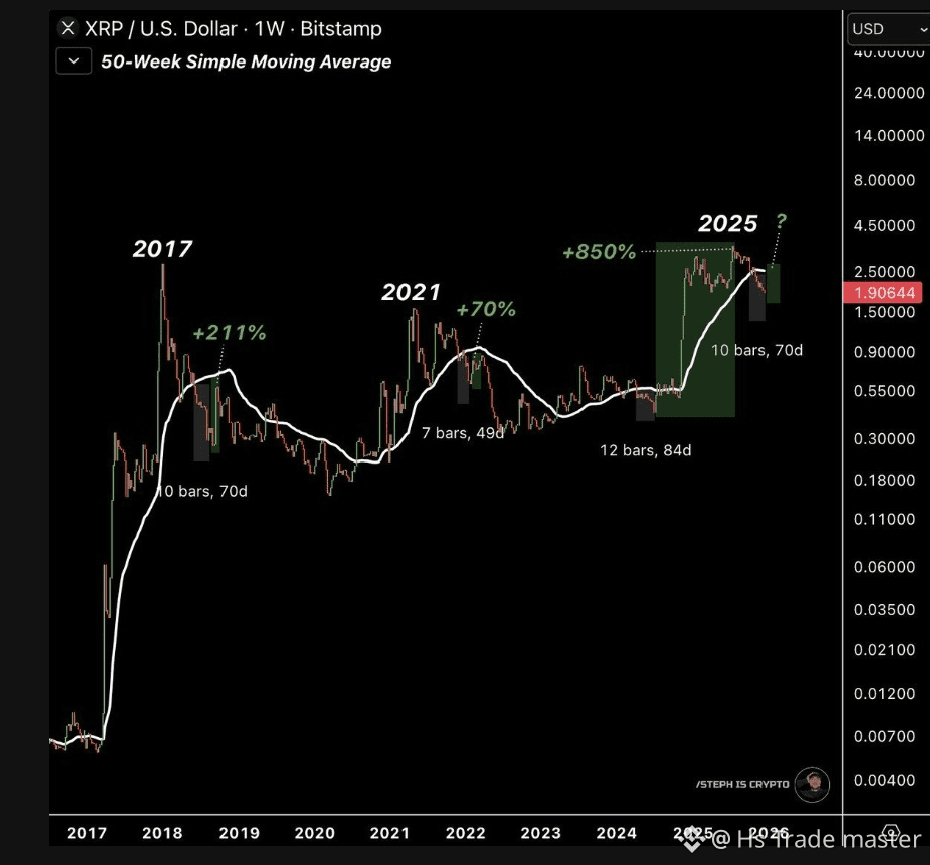
However, some analysts still believe a new bullish phase could begin in 2026 (Wave D scenario).
📈 Technical Levels to Watch
📌 Support Zones
$1.82–$2.00 — Strong support area that has historically been defended in prior pullbacks.
If $1.82 fails, deeper retracements ~$1.60–$1.70 could come into play (based on chart breakdown scenarios).
📌 Resistance Zones
$2.28–$2.31 — Immediate resistance level; a close above this is key for bullish continuation.
$2.35–$2.70 — Next medium-term resistance corridor if buyers return.
📉 Technical Indicators & Sentiment
Many technical indicators show neutral to bearish sentiment — mixed signals on momentum and moving averages.
Some on-chain and order-flow data suggest support building near $2.00 with stronger liquidity bands.
Market fear (e.g., Fear & Greed Index) is in extreme fear territory, historically a potential contrarian buy signal.
💡 Price Prediction Ranges
Depending on time horizon and market conditions:
Time FramePossible Move (Analyst Forecasts)Short-term (1–2 weeks)$2.05–$2.20 if resistance breaks; otherwise rangebound near support. End of Dec 2025$2.35–$3.67 potential recovery if bullish momentum improves. Bullish Long-term ScenariosSome analysts project higher extended targets in bull markets (2026+).
⚠️ Bearish scenarios remain plausible if key supports break. Always weigh both sides.
📉 XRP Price Chart Snapshot (latest)
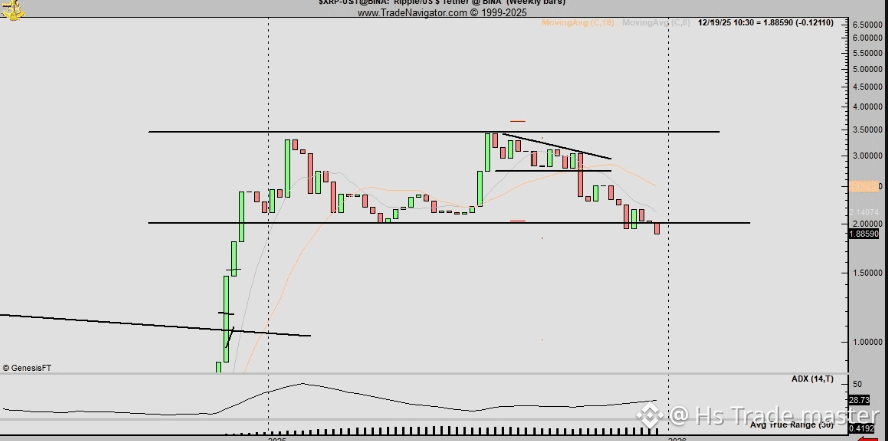
(This illustrative chart shows the recent price range and key support/resistance.)
🧠 Summary
Bullish Case: Break above $2.28 and holding support could trigger relief rallies into the $2.35–$2.70 range. Strong support near $2.00 and potential structural rebounds provide catalysts.
Bearish Case: Broader crypto sell-off and bearish chart patterns could pull XRP back toward lower support zones if current levels fail.
Neutral/Volatile: With mixed indicators and sentiment near extremes, expect choppy trading around critical levels.
💡 Trading Tip: Use stop losses near key support levels and watch how price reacts at $2.28–$2.35 — this is the current pivotal area for trend bias.
#USNonFarmPayrollReport #USJobsData #BTCVSGOLD #BinanceBlockchainWeek