


Pump.fun decreased by 12% in the last 24 hours, exposing it to a bearish breakout of a descending wedge pattern.
SPX extends its losses after a 12% drop on Wednesday, indicating the possibility of an additional decline of around 8%.
Bittensor recorded a 10% decrease over the last 24 hours, marking the fifth consecutive day of losses amid increasing selling pressure.
Pump.fun ($PUMP ), SPX6900 ($SPX ), and Bittensor ($TAO ) lead the losses in the cryptocurrency market over the last 24 hours amid an overall liquidation exceeding $500 million. The retail sector claims institutional manipulation amid the ongoing Bitcoin sell-off in the early morning U.S. market. Additionally, upcoming U.S. consumer price index data on Thursday and the Bank of Japan's interest rate hike decision on Friday may amplify volatility in the cryptocurrency market.
Technically, the downward trend in PUMP, SPX, and TAO may extend to reinforce the losing streak as momentum indicators suggest severe selling pressure.
Pump.fun may decline from a descending wedge pattern.
Pump.fun is down about 2% at the time of writing on Thursday, extending the decline by 10% from the previous day. The meme coin is approaching the support line connecting the lows of November 17 and 21, which is part of a descending wedge pattern.
If PUMP records a critical close below the pivot point S1 at $0.002000, it will confirm the bearish breakout. The downward trend in PUMP may find support at the low of October 10 at $0.001496 or the pivot point S2 at $0.001051.
The relative strength index (RSI) on the daily chart is at 29, indicating an oversold condition. Meanwhile, the moving average convergence divergence (MACD) and signal line are declining in the negative direction after Monday's crossover.
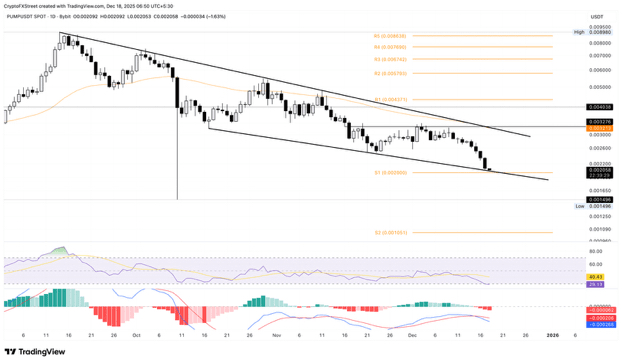
The daily logarithmic chart for PUMP/USDT.
Looking upwards, a potential rebound in PUMP may target the upper trend line connecting the highs of September 14 and November 11, near $0.003000.
SPX6900 is at risk of a sharper correction.
SPX6900 has dropped by nearly 2% at the time of writing on Thursday, extending Wednesday's decline by 12%. The lowest resistance path for the meme coin indicates a low of November 21 at $0.4375, suggesting a potential drop of about 8%.
The relative strength index at 34 continues to decline, approaching the oversold area amid increasing selling pressure. Additionally, the downward trend in the MACD and signal line indicates an increase in bearish momentum.
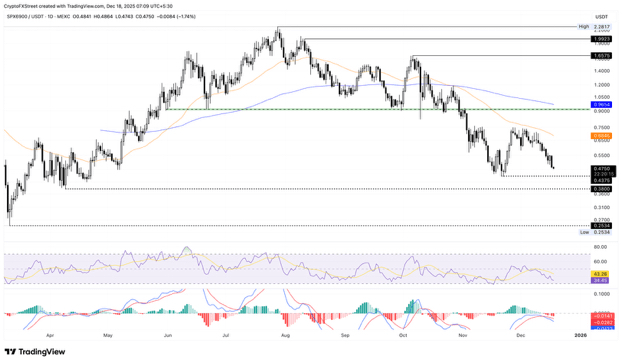
The daily logarithmic chart for SPX/USDT.
Conversely, a potential increase in SPX may find the 50-day exponential moving average at $0.6845 as immediate resistance.
Bittensor's decline is gaining bearish momentum.
Bittensor extends its decline for the fifth consecutive day, surpassing the $250 mark. At the time of writing, the smart coin has dropped nearly 3% on Thursday, adding to a 9% decline from the previous day.
The immediate support for TAO is at its lowest level on April 16 at $222, followed by the psychological level of $200.
Similar to PUMP, the relative strength index at 30 indicates oversold conditions for TAO, while the MACD remains in a sell signal after Wednesday's crossover.
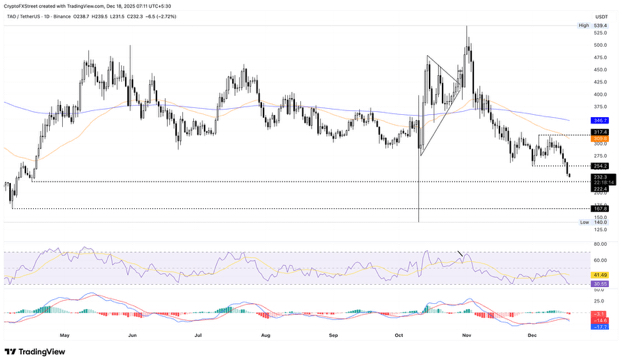
The daily chart for TAO/USDT price.
To resume recovery, TAO must rise above the low of December 1 at $254.
