The XRP (Ripple) currency has recently experienced a significant decline amid fluctuations in the cryptocurrency market, prompting investors to search for the reasons behind this drop and the upcoming trend for the currency. Below is a detailed analysis that combines fundamental and technical factors.
---
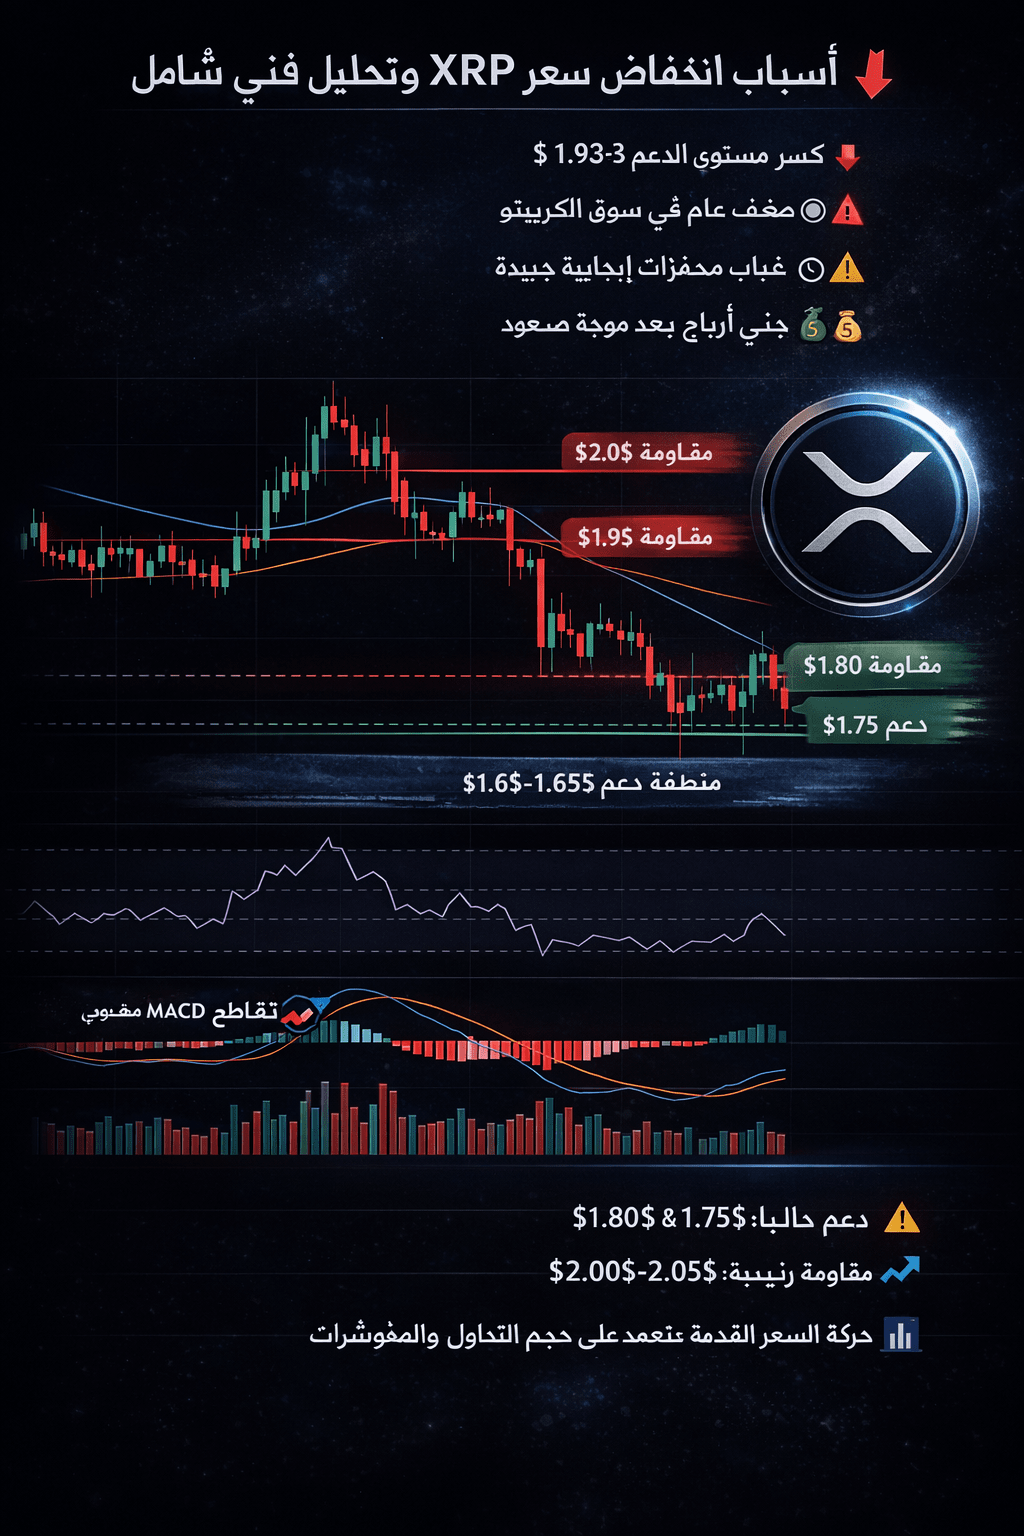
First: Breaking key support levels
XRP failed to maintain trading above the important support zone of $2.00 - $1.93.
Breaking this support has activated stop-loss orders and increased selling pressure, causing a rapid price drop.
---
Second: General market weakness
The decline of Bitcoin and Ethereum has affected investor sentiment and led to liquidity leaving alternative currencies.
Investors are turning to more stable currencies during periods of volatility.
---
Third: Absence of positive catalysts
The lack of significant news or major partnerships for Ripple recently has left price action under the pressure of technical analysis only.
---
Fourth: Profit-taking
A previous upward wave prompted investors to take profits at resistance levels, contributing to the drop.
---
📊 Current technical analysis of XRP
1️⃣ Short-term trend
Current trend: Short-term bearish
Technical indicators:
RSI is at ~38, indicating that the currency is approaching the oversold area, and we may see a short-term correction.
MACD shows a negative crossover, reinforcing the current bearish trend.
2️⃣ Support levels
First support: $1.80
Second support: $1.75
Strong long-term support: $1.60 – $1.65, any break of this area could open the way for further declines.
3️⃣ Resistance levels
First resistance: $1.95
Second resistance: $2.05
Any clear breakout above the $2.00 level with a daily close could change XRP's short-term trend to bullish.
4️⃣ Trading volume
Current trading volume is relatively low, indicating investors' hesitance and cautious entry.
Increased trading volume with any upward movement will confirm the strength of the positive trend.
---
🧠 Summary
The current drop of XRP is a natural correction within a broader trend.
Fundamental and technical factors suggest continued price volatility in the near term.
Monitoring support and resistance levels, along with indicators like RSI, MACD, and trading volume, will help make better investment decisions.