Guys, today we will analyze a tool that every beginner should know — the Liquidation Map! 🗺️ This is your GPS in the crypto market. It shows where the crowd is going and where whales are setting traps. 🛑
🔥 What is this?
The numerous green and yellow stripes on the map indicate areas where stop-losses or liquidation prices for long and short positions are set. This is literally a 'money map' on the battlefield! 💰📈
🏦 Analysis using example #PTB and (Growth +100!)
Yesterday, PTB reached an all-time high. The growth was manipulative, and ordinary trend lines did not work here. 📉 Let's take a look at the liquidation map and our 3 white lines:
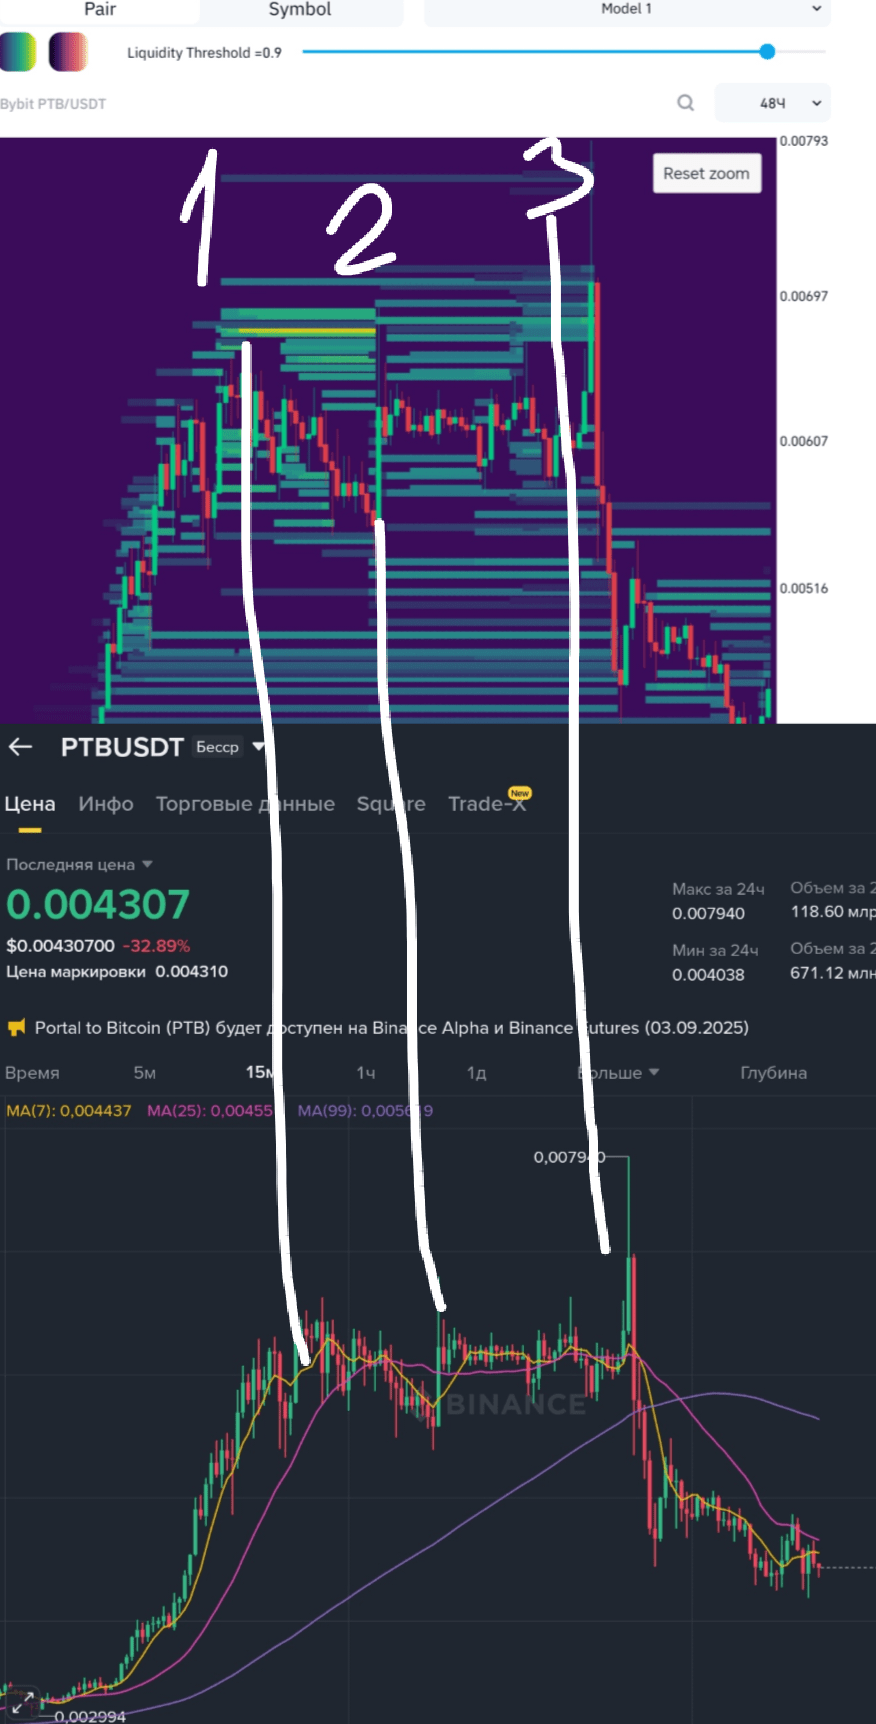
1️⃣ Line 1 (Trap): The growth seems huge, and everyone is opening SHORT positions. 🐻 The map shows that there are too many short sellers. Remember: the market often plays AGAINST the majority! ❌
2️⃣ Line 2 (Liquidation): In just 15 minutes, the price increases by +20%! 🚀 All short sellers are liquidated. They were waiting for a drop but forgot to move their stop-loss in time. 💸
My lesson: Yesterday I was in a long position, I was stopped out, but on this candle, I exited at ZERO. Remember: ZERO is better than a loss! 0️⃣ > -100. Don't hold onto profits too long and never tolerate large losses!
3️⃣ Line 3 (Sideways): After the liquidation, the coin is stuck in sideways movement. ✨ Entering in a sideways market is like a lottery (50/50). But the map gives a hint: if many short sellers have accumulated at the top, wait for another upward impulse to liquidate them, and only then — a drop down! 📉
💡 Important tips:
Application: Use Coinglass. 📱
Traps: If you see a small red candle in a sideways market — it could be a bait for a short! 🪤
Different exchanges: Sentiment on different platforms can vary. Choose the exchange with the highest liquidity! 🌊
For whom is this? The tool works best on coins from the TOP-10 by growth, where there is a lot of hype. Especially on those that do not respond to ordinary technical analysis. 📈
Conclusion: Conduct your own research and befriend the liquidation map! 🔍
✅ Liked the post? Give it a LIKE! ❤️ Your reactions help promote useful information!
💬 Write in the comments: Do you use the liquidation map? Do you believe in this tool? Let's show newcomers the community's opinion! 👇🦁
And let's watch the leaders of today's growth👇

