
It is truly rare for me to see a chart that clearly illustrates a trend like this. It is the long-term resistance trendline of Bitcoin, spanning multiple cycles. Each time $BTC touches this line in the past, it has created a peak and then been pushed down. Based on historical data, it is indeed not off by a bit.

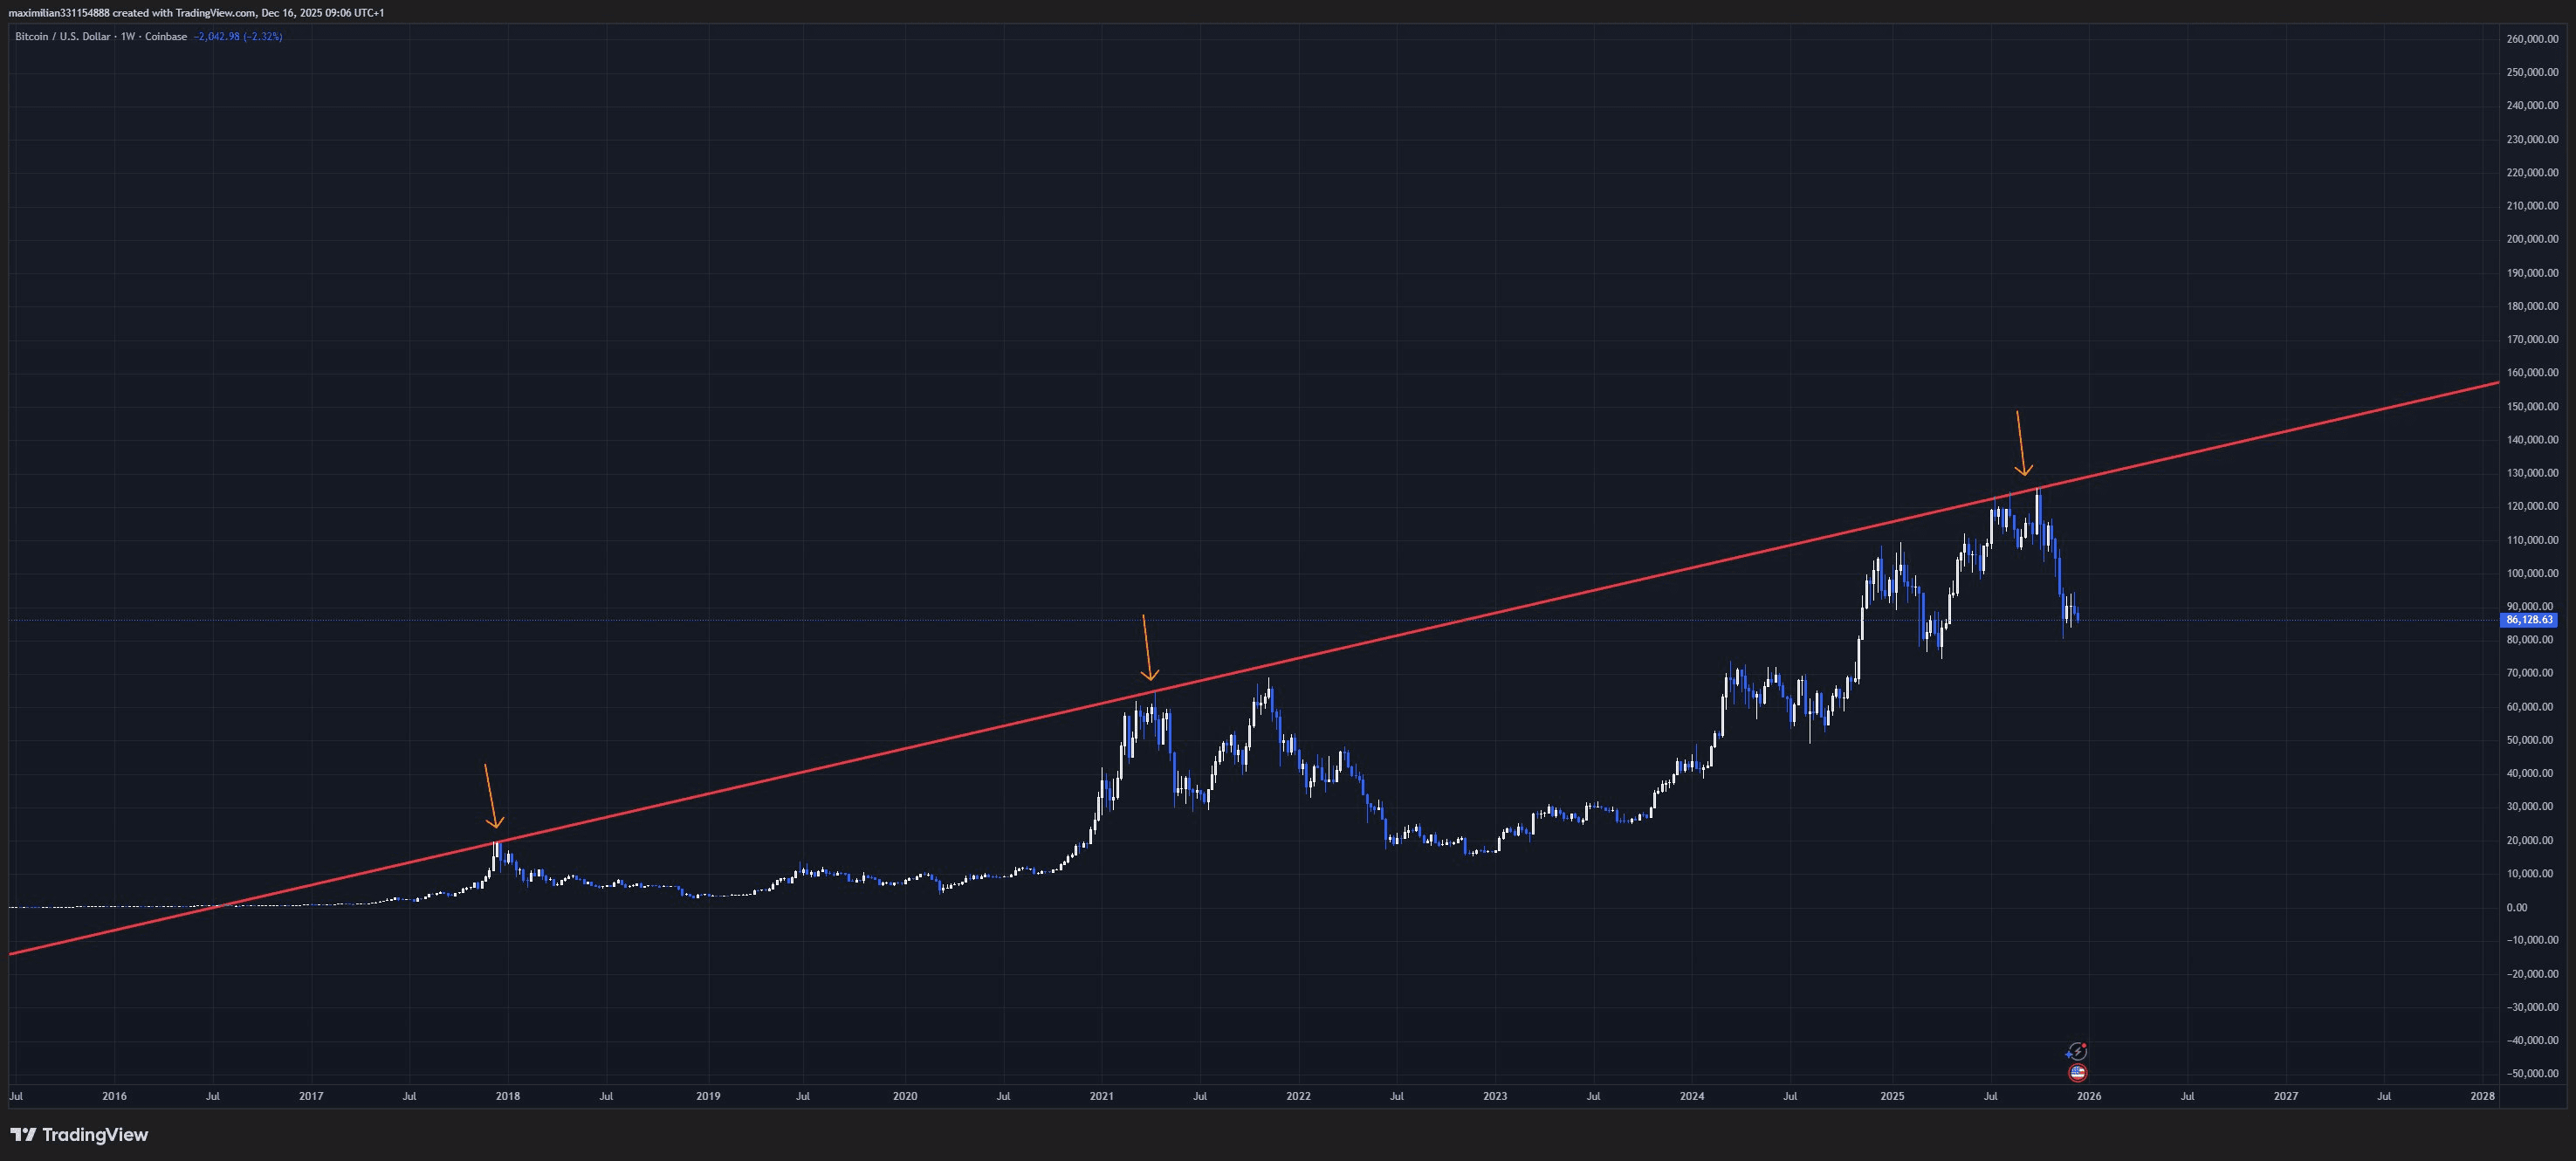
But precisely because it is so perfectly aligned, there is one thing that is almost certain: a beautiful trendline like this will sooner or later be broken. And when it is broken, the story will no longer be the same as before.
From a long-term investment perspective, this is a very interesting point. No matter what price you buy Bitcoin at over the next year, whether the market still experiences further drops or creates more panic, the probability is very high that in the end, BTC will still significantly exceed this trendline.
In other words, the market is giving us a perspective that
Long-term risk is low
Clear price structure
The moment Bitcoin breaks this trendline, I believe that BTC will find it very difficult, if not nearly impossible, to return below the current price range in the LONG TERM. I’m saying this in the long term, so be very careful.
To understand quickly, keep in mind that in the short term there may still be noise, bad news, and fluctuations that make many people lose patience. But if we look at a larger frame, this picture is heavily leaning towards long-term holders.