Family! Can you imagine that Bitcoin is not only "about" to explode, but the BREAKOUT HAS OFFICIALLY BEEN CONFIRMED and the targets being considered are between $120,000 and $150,000? 🤯 Catch me because I'm falling!
Look, you and I who already understand this, know that the price of BTC has been dancing close to a downward trend line that had us with our hearts in our hands. So hold on: last Tuesday, the price broke that barrier and, most importantly, on Thursday the breakout was confirmed! This is not a simple movement, it is the signal that the trend is ready to make a 180-degree turn. 🚀
The Technical Detail That Matters (Without Breaking a Sweat)
We have to be honest, there is always a minimal chance that the "bears" (the pessimists) want to force the drop again, but the charts tell us that this is unlikely. Why?
The Magic Bounce: After the breakout, the price returned to the line to "confirm" that it left it behind. Now, a bounce back to the upper part of the channel is expected.
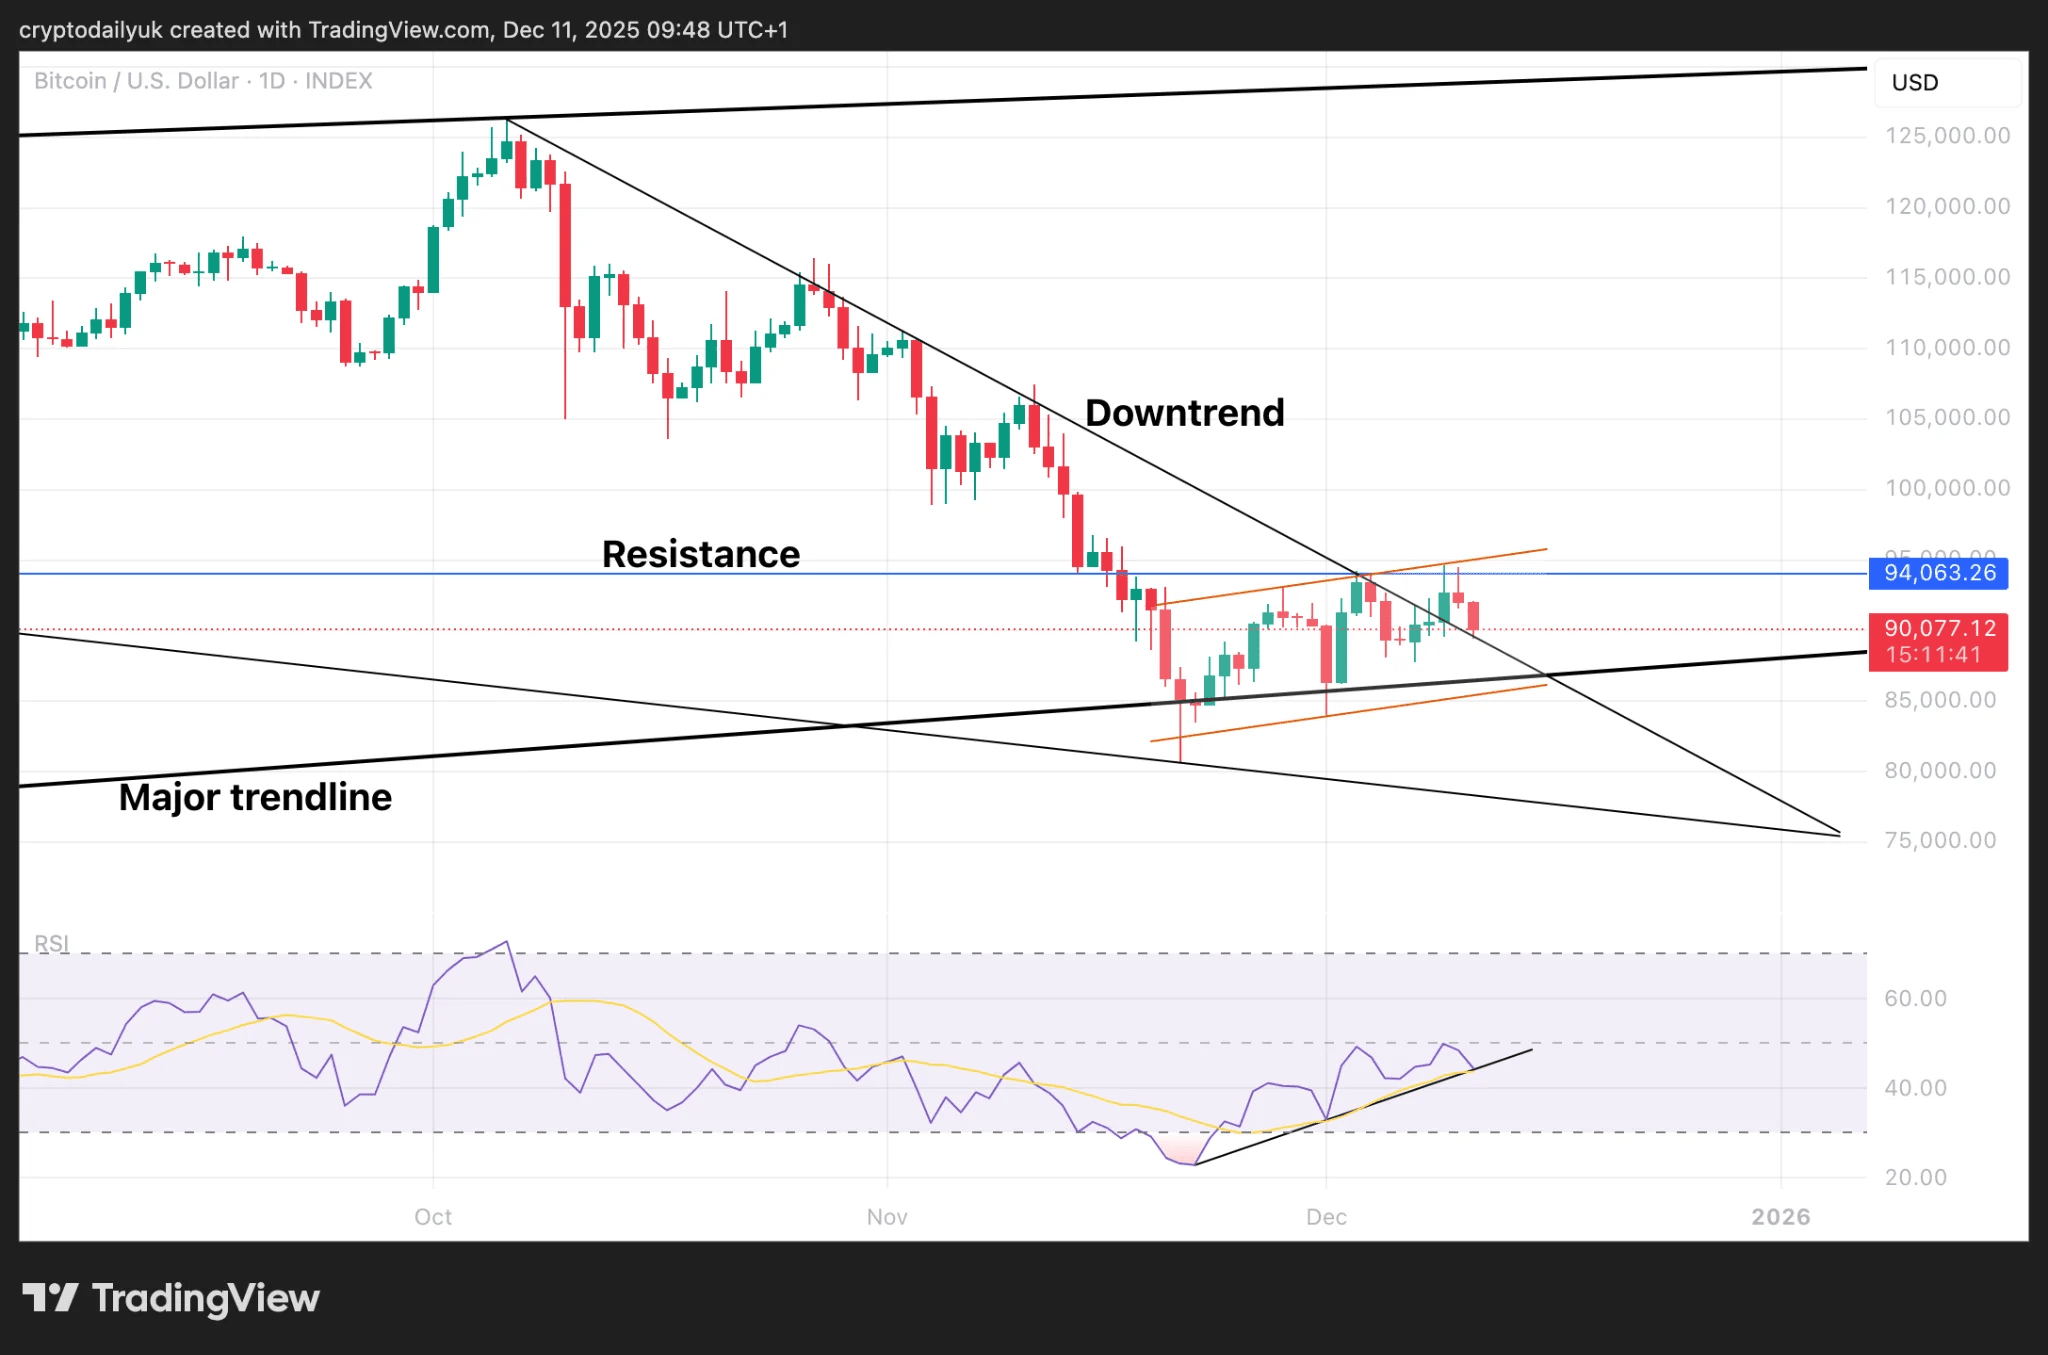
The Silent Indicator (RSI): Below, the RSI indicator is also moving with an upward trend. As long as that line remains above, the price has a clear path. If it falls, be careful! But for now, the way is green. 🚦
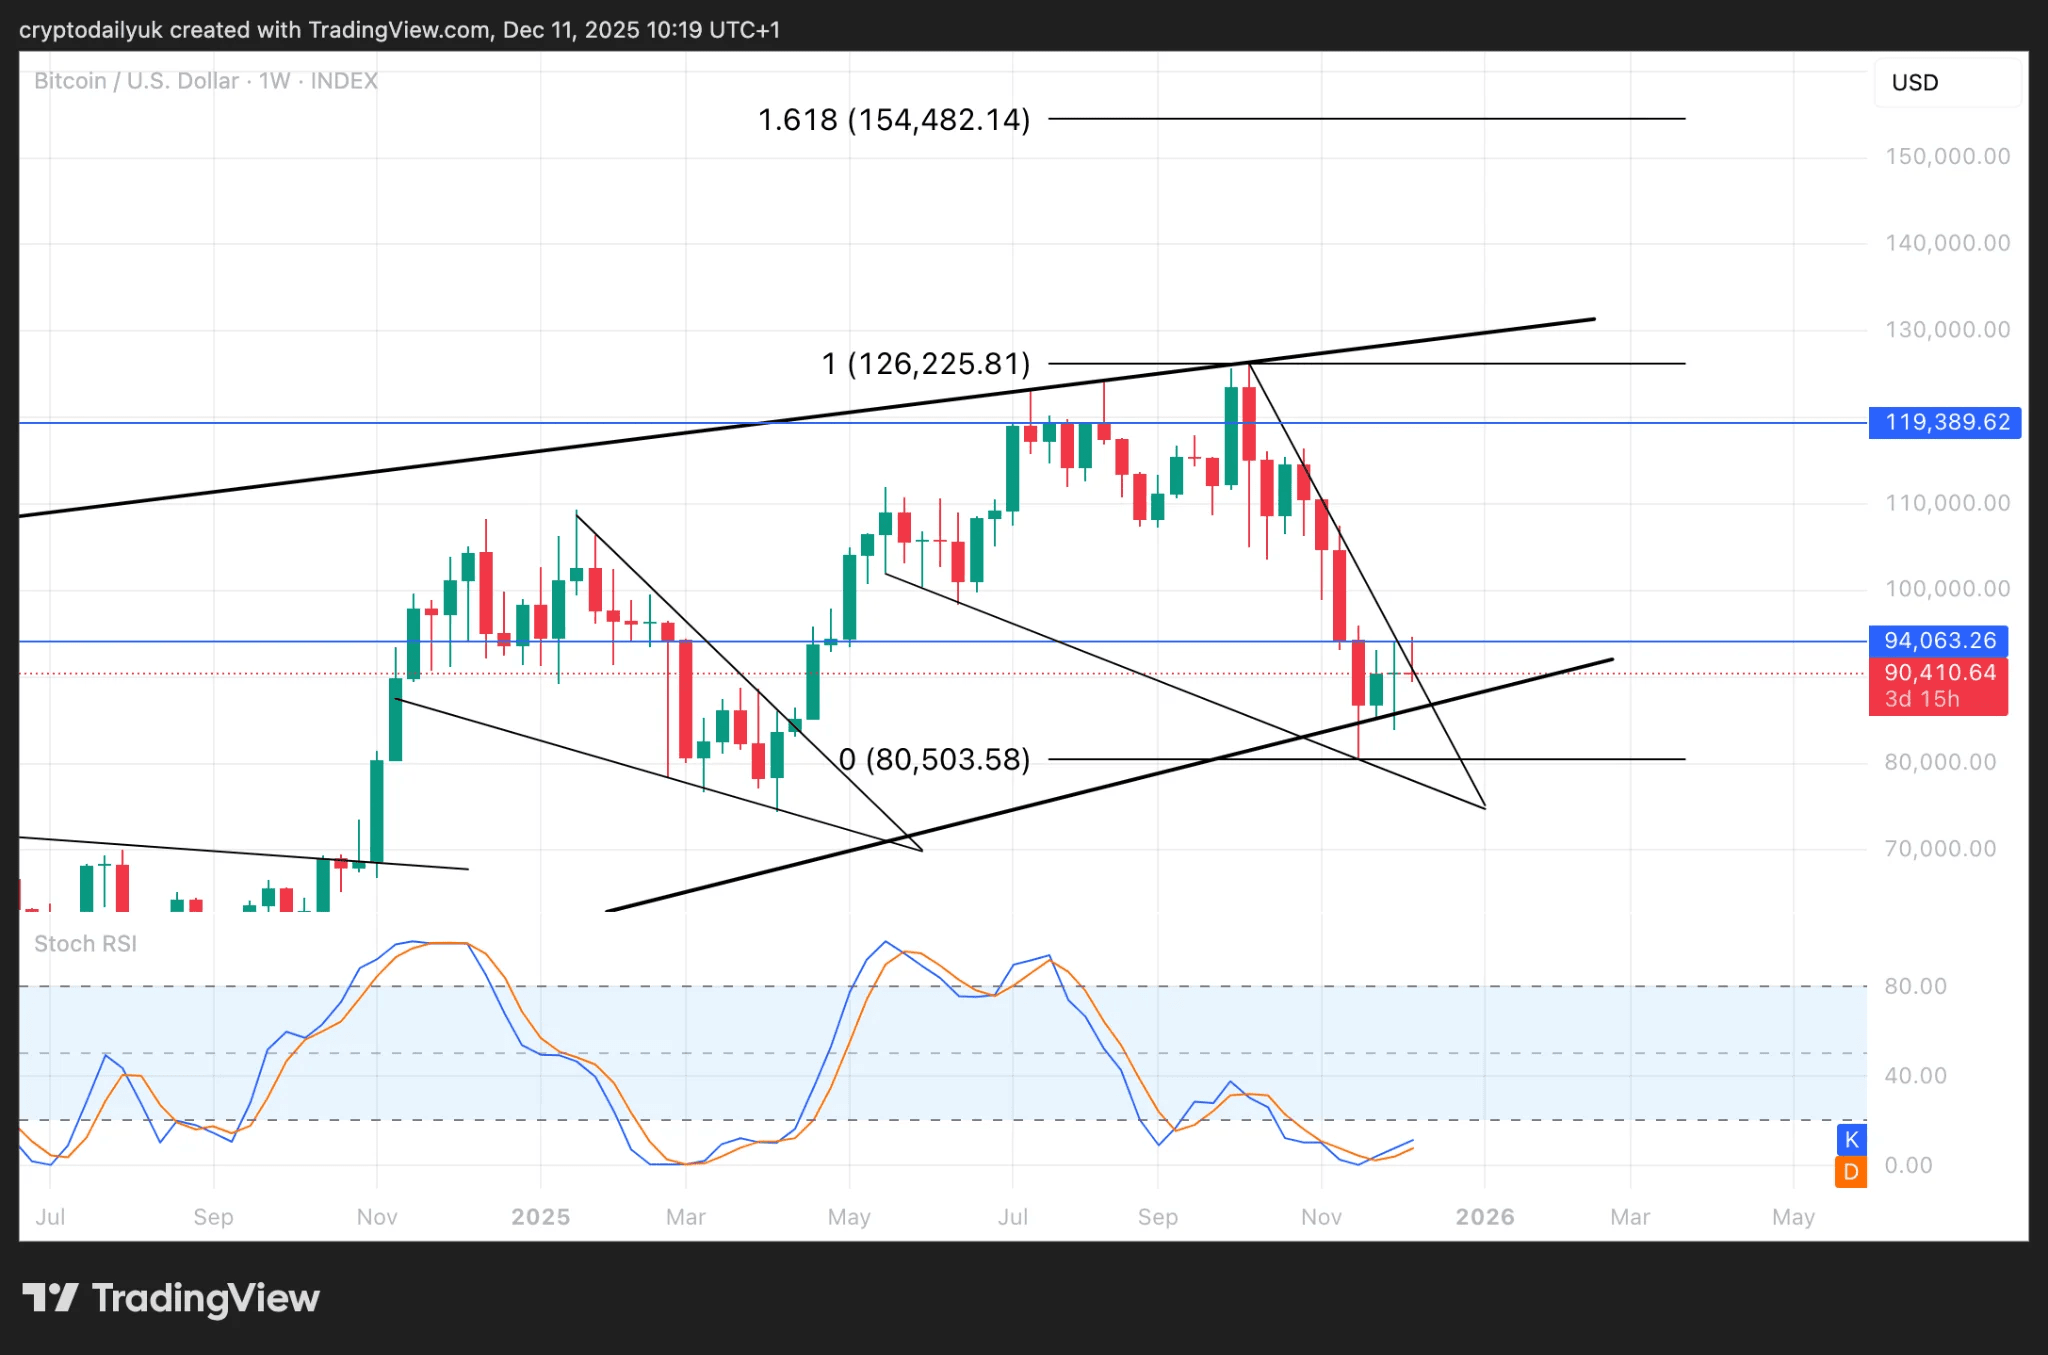
And Where Do Those Numbers Come From?
When we talk about $120k to $150k, we are not daydreaming; we are looking at the weekly chart:
The last resistance before hitting the historical maximum is at $119,400. Think of it as the last level of a video game.
The objective of $154,500 is the famous Fibonacci extension level of 1.618. This is a level that serious analysts look at and that, if reached, is pure glory. 🏆
The fuel for this launch will be provided by the Stochastic RSI. Right now they are rising and about to cross the 20.00 level. When those indicators say "Let's fly!", expect a bullish impulse that will take us straight to that historical maximum.
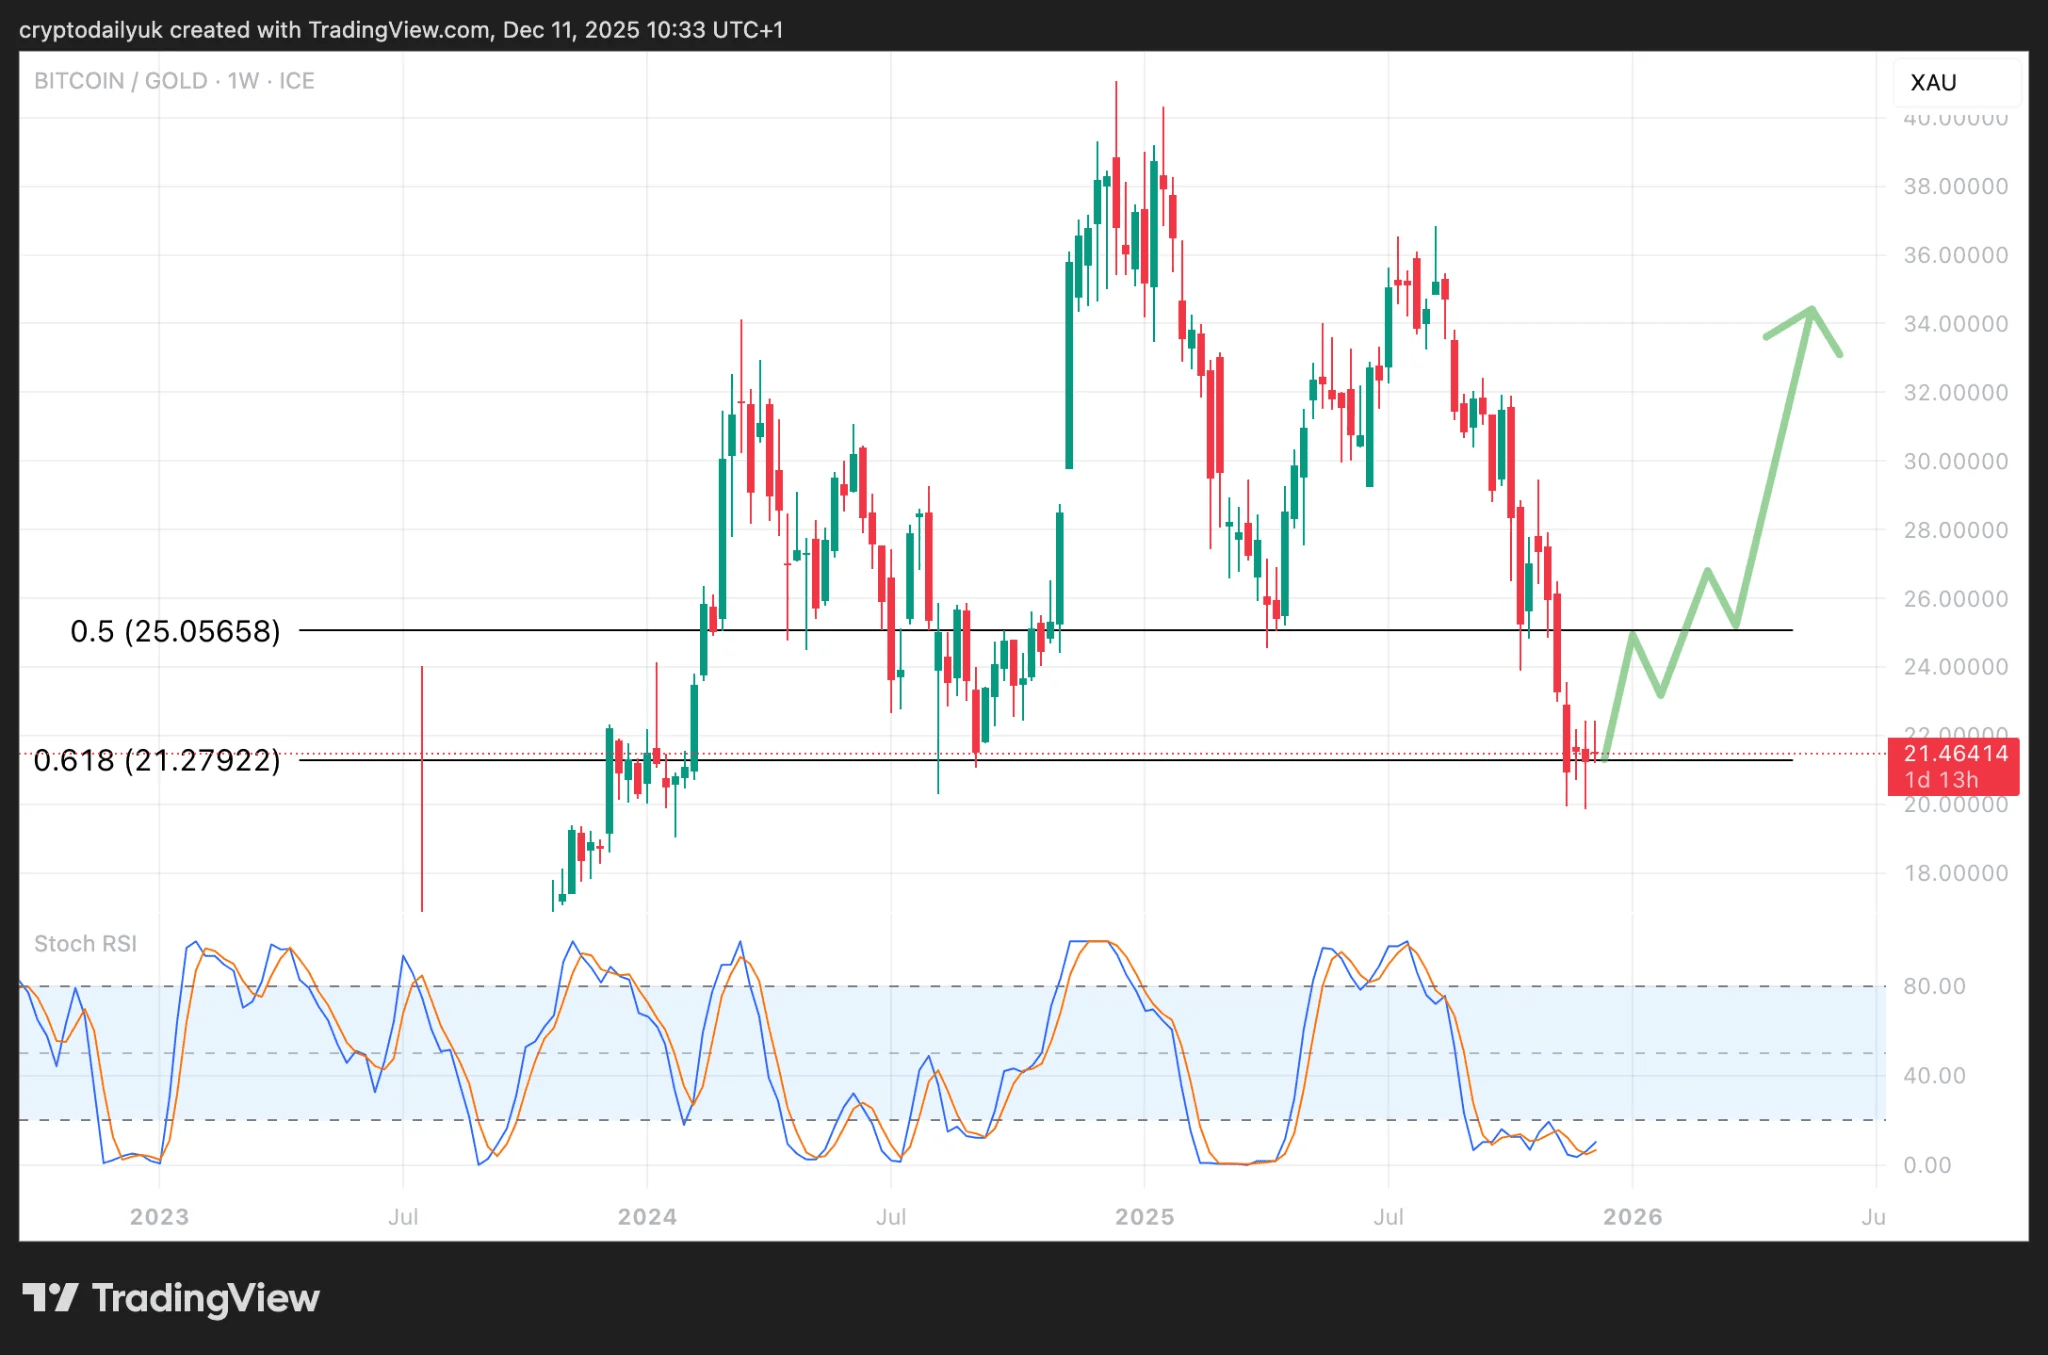
The Battle of Giants: Bitcoin vs. Gold 🥇
Gold has been unstoppable, outperforming Bitcoin since late 2024. An additional 48%! But, my people, the BTC/GOLD ratio hit a key support point (the Fibonacci level 0.618) and the indicators of $BTC are at the lows of the larger periods (weekly, biweekly, monthly). This is like a spring that has been compressed to the maximum. It is Bitcoin's turn. Be alert, because that ratio is going to change and $BTC will start to dominate the precious metal.
We are at a historic moment. Not only was a trend broken, but the technical scenario and the battle against gold point to the same thing: a powerful rally. What do you think? How quickly will we see that $120,000 level? 🧐 Let's closely follow this launch!$BTC
