

The price of Solana is trading lower on Thursday after rejecting the upper limit of its downward wedge trend line.
The cautious and hawkish interest rate cut from the Federal Reserve in December affects risk assets, such as SOL.
Chain data indicates bearish momentum, with the CVD indicator for instant traders showing clear dominance on the sell side and an increase in retail activity.
The price of Solana ($SOL ) is trading at $130 at the time of writing this report on Thursday, after being rejected at the upper limit of its descending wedge pattern. Broader market weakness following the Fed's hawkish interest rate cut has added to the bearish momentum. Additionally, on-chain data for Solana indicates further declines, with selling side dominance increasing.
The Federal Reserve's cautious interest rate cut affects riskier assets.
The broader cryptocurrency market declined following the Federal Open Market Committee (FOMC) meeting on Wednesday. In a widely anticipated move, the U.S. Federal Reserve (Fed) cut interest rates by 25 basis points to 3.50%-3.75% at the end of its two-day policy meeting but indicated a potential pause in January.
Adding to the cautious tone, policymakers expect only a 25 basis point cut in 2026, the same expectations as in September, which eased market expectations and contributed to pressure on risky assets in the short term. This hawkish interest rate cut and the Federal Reserve's cautious stance have stimulated a slight risk-off sentiment, impacting riskier assets, as major cryptocurrencies like Bitcoin, Ethereum, Ripple, and Solana traded lower as of Thursday.
The series data shows bearish signs
CryptoQuant data, as shown in the chart below, indicates selling pressure on Solana. The CVD (Cumulative Volume Delta) for immediate traders of SOL turned negative on Wednesday. This indicator measures the cumulative difference between buying and selling volumes in the market over three months. When the 90-day CVD is positive and increasing, it signals a buying dominance phase, while a negative and decreasing value indicates a selling dominance phase.
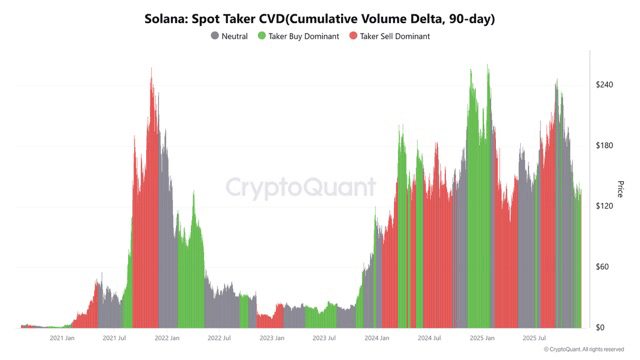
CVD indicator chart for SOL immediate traders. Source: CryptoQuant
The future order volume average indicator from CryptoQuant - which tracks the average volume of executed futures contracts for $SOL - shows an increase in small order volumes, indicating heightened retail activity in the market, which bodes ill for SOL's price.
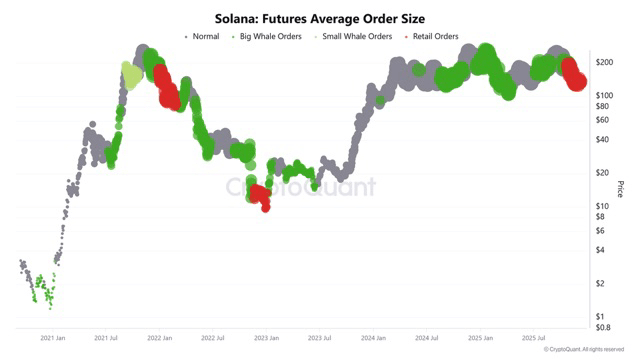
Future order volume average indicator chart for Solana. Source: CryptoQuant
Solana Price Forecast: SOL faces rejection from a key level.
The price $SOL faced rejection from the upper limit of the trendline in the descending wedge pattern (illustrated) on Wednesday. As of Thursday, SOL declined by 3.87% to around $130.99.
If SOL continues its downward trend, the decline may extend toward the low of November 21 at $121.66.
The Relative Strength Index (RSI) is at 40 on the daily chart, below the neutral level of 50, indicating a bearish trend.
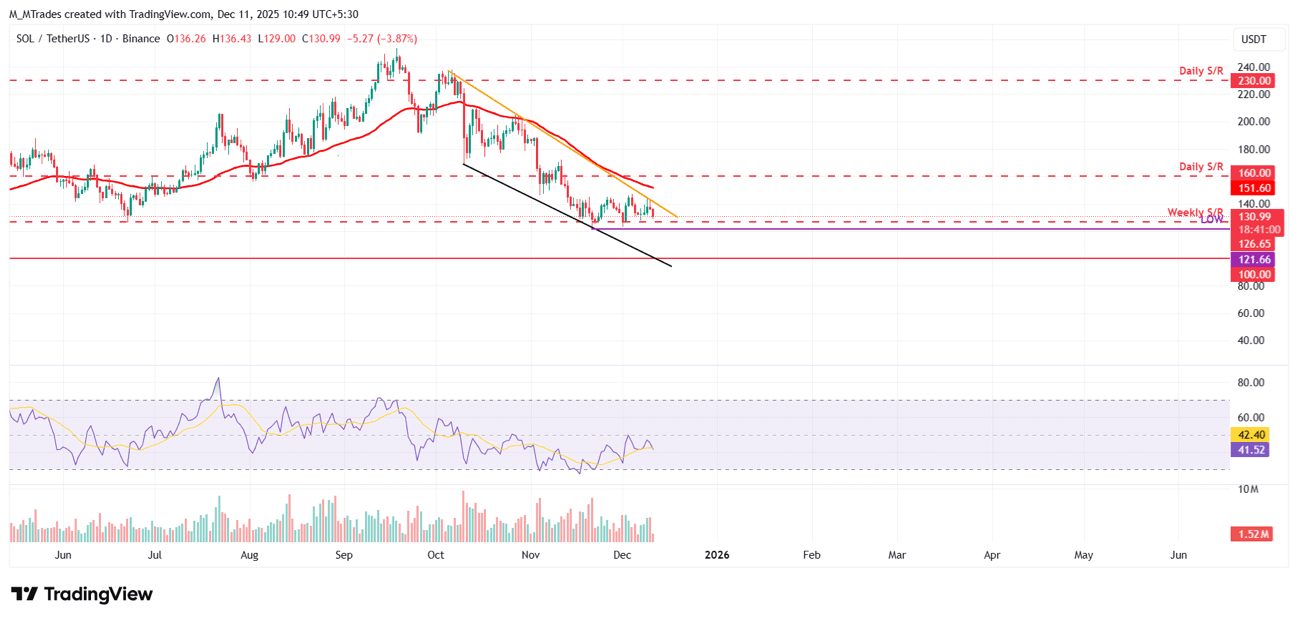
The daily chart for SOL/USDT
However, if SOL recovers, the rebound may extend toward the 50-day exponential moving average at $151.60.