
Many people lose money in trading not because the direction was wrong, but because they often "do not understand and still force it".
When the shape still seems ambiguous, rushing in with a heated head will only result in losses.
After many years of trading, you will understand a principle: do not look at chaotic lines, do not buy scattered shapes; we prefer not to trade shapes that are disorganized and unclear in direction.
When the market transitions from chaos to clarity, and a standard shape appears, we can take action, which will significantly increase our winning rate.
Today, I will discuss these three points:
1: Why "do not look at chaotic lines, do not buy scattered shapes"?
2: What kind of patterns are worth trading?
3: Clear pattern practical cases.
Teach you how to make simplicity extreme, how to find high-probability structures.
The article is quite long, it is recommended to save and read it. If you find it helpful, you can give it a thumbs up. For more trading techniques and insights, you can visit my public account (Eight-Digit Garden Articles).
1. Why 'don't look at messy lines, don't buy scattered shapes'?
Everyone, first look at a chart.
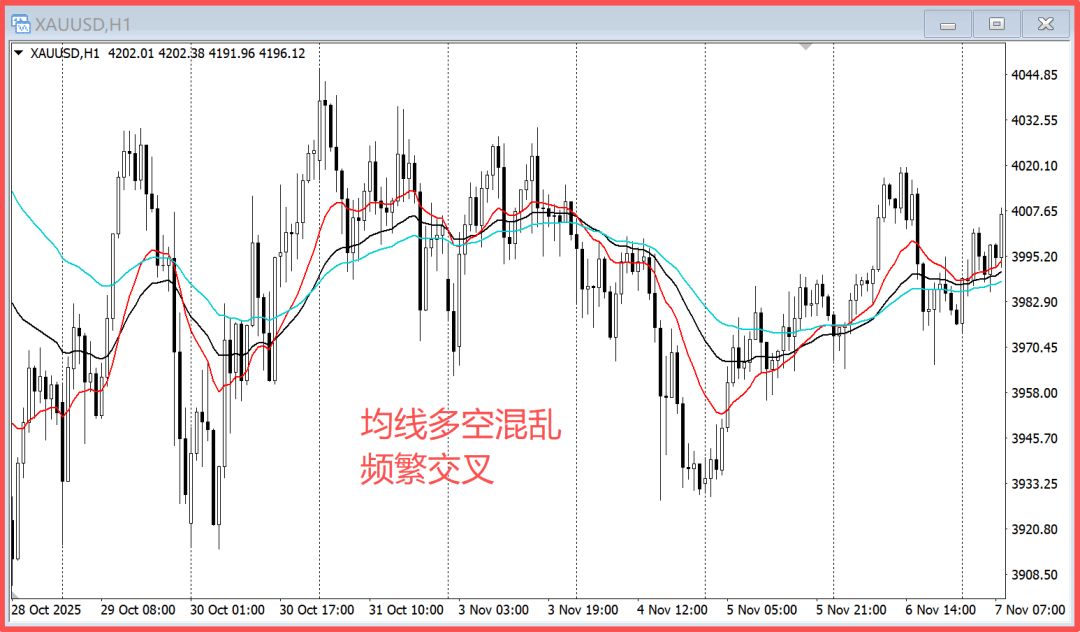 The chart shows the gold 1-hour candlestick chart. In the trend of nearly 8 trading days, the moving averages frequently cross, the direction is chaotic, and the high and low points are unclear, making it difficult to find clear entry, stop-loss, and exit points.
This kind of moving average shape and candlestick structure is very difficult to trade.
Let's look at another chart.
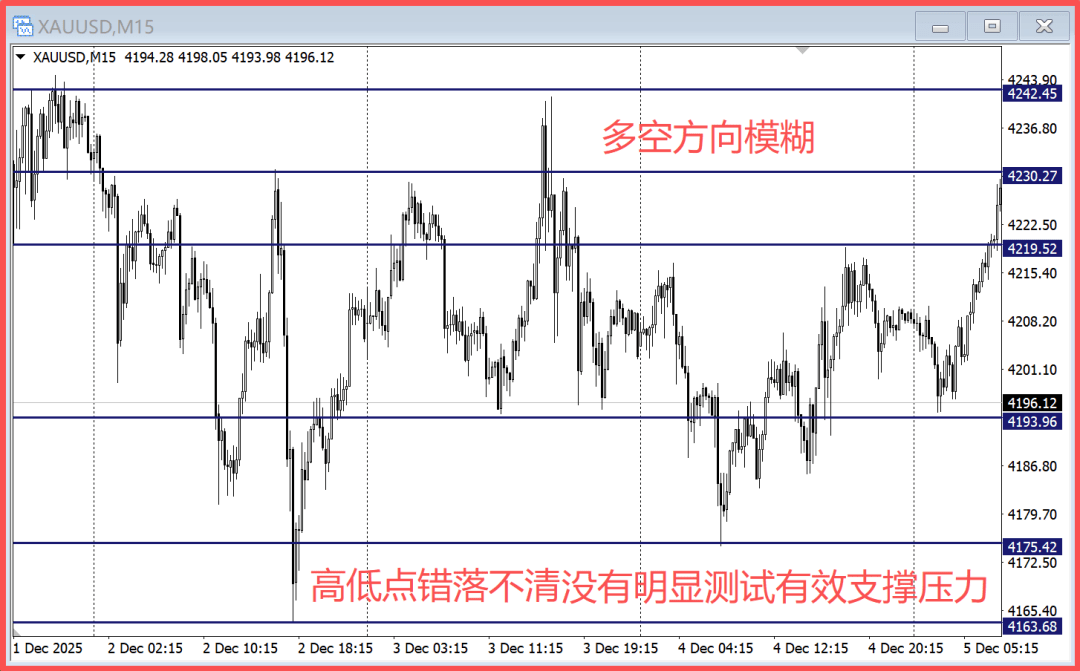 The chart shows the gold 15-minute candlestick chart. At first glance, one cannot find a clear and effective support and resistance position; the high and low points are disordered, and there is no support or resistance that has been continuously tested and confirmed. The long and short directions are very vague.
This 'scattered' pattern, lacking both support and direction, makes trading very difficult.
I've been trading for 15 years, and I can't understand this kind of pattern either, can't find a position to act on. This raises a question: when you don't understand, should you act or not?
Of course, don't act.
(1) If you don't understand, don't know where to enter, don't know where to exit, and don't know where to set the stop-loss when wrong, the result of forcing trades is losing money.
(2) Trading is for making money, not to see who can make it harder. Find simple patterns that you are familiar with, good at, and can understand at a glance, and you can still make money. Earning 1000 from simple patterns is of the same value as earning 1000 from complex patterns.
Of course, the above are just two common examples. There are many situations in the trend that we cannot understand, which are all unnecessary to forcefully analyze long or short and place orders.
With so many market trends, we just need to find the ones we can understand, can recognize at a glance, that have clear standards, and are valuable for trading, and that will be enough for us to earn abundantly.
2. What kind of patterns are worth trading?
01. Appears at the right position.
A truly worthwhile trading pattern must appear at key points in the market structure, such as reversal patterns formed at the end of a trend, continuation patterns that appear clearly when a trend is obvious, and breakdowns of key support levels during long-term consolidations.
Even the most standard patterns appearing in randomly fluctuating markets are unlikely to produce effective trends, because the position determines whether the pattern has value. With the correct position, the success rate of the pattern naturally increases.
Everyone, take a look at the chart below.
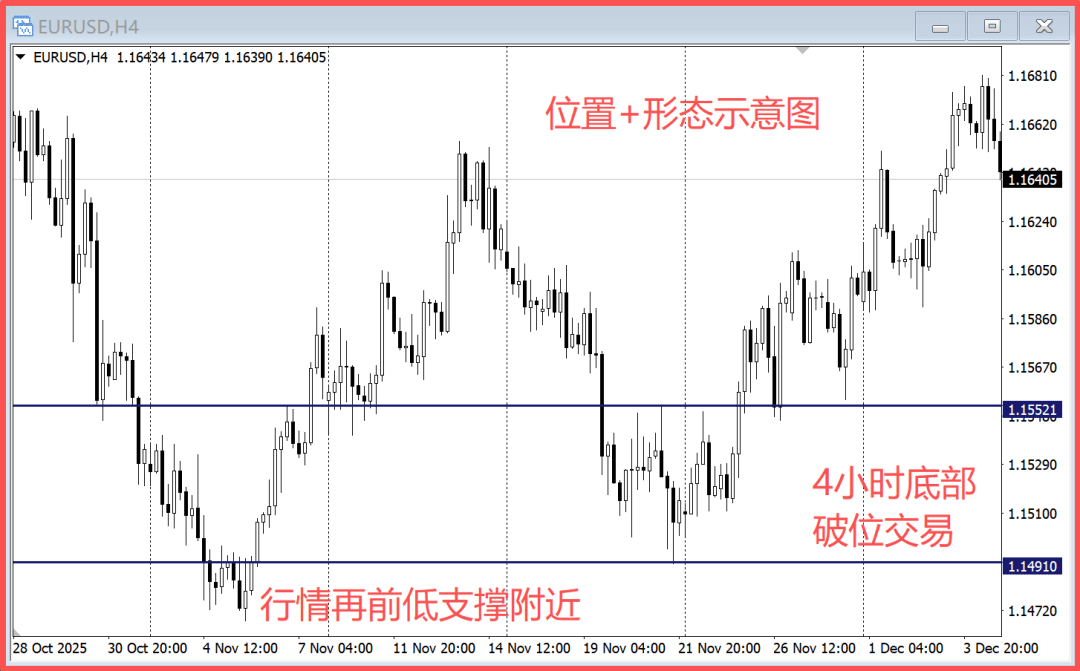 The chart shows the EUR/USD 4-hour candlestick chart, the market has been continuously declining, reaching a low of 1.14910. This position serves as a support zone for previous lows, and this range provides support.
At this position, the 4-hour level formed a pattern of breaking upwards from the bottom, with the breakout price being 1.15521, followed by a significant market rise.
With the support of the position, the pattern has trading value.
02. Structure is clear and can be understood at a glance.
Good patterns are clear and direct; you can act without guessing. For example, clear high and low points, necklines or trendlines are easily discernible, and the feeling they give you is that you can act without hesitation.
If you have an ambiguous thought about a pattern, like 'it seems possible, but also seems not', this often means that the market's strength is not concentrated. Patterns that you can understand at a glance and act on without hesitation are the truly worthwhile ones.
03. Simple execution.
The pattern ultimately needs to be translated into trading execution. Good patterns can be planned in advance, and when the signal appears, you can make the decision to enter without hesitation.
At least three points must be clearly satisfied: where to enter, where to set the stop-loss, and what the first target position is after entering.
Patterns as simple as elementary school math problems can be executed mechanically. Patterns that are unmistakably clear are the most valuable.
Everyone, take a look at the chart below.
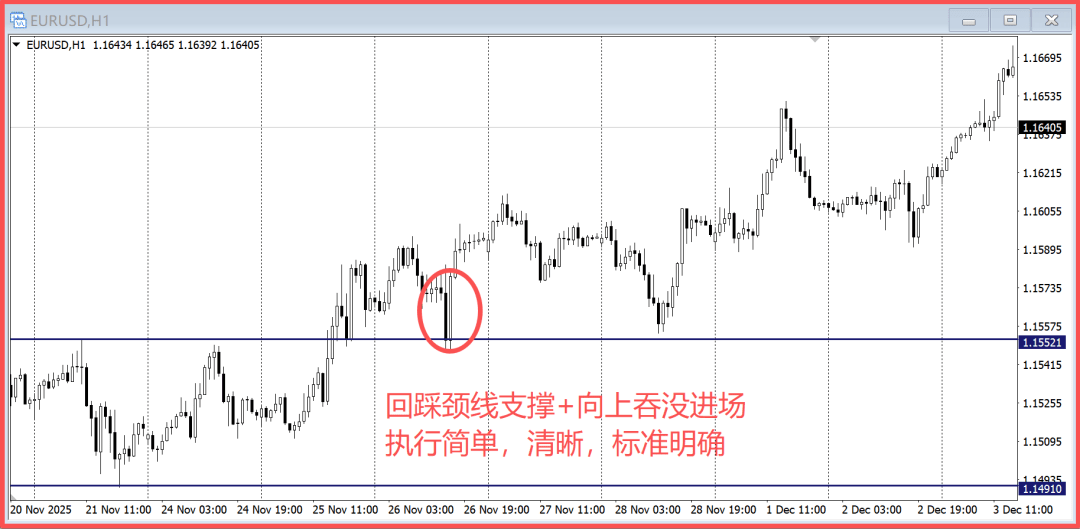 The chart shows the EUR/USD 1-hour candlestick chart, and the trend is the 1-hour market after the bottom was broken in the 4-hour chart above.
After the neckline of 1.15521 broke, the market retested the neckline and formed a clear upward engulfing pattern. Enter to go long based on the pattern, with the stop-loss set at the low point. The exit has a very clear reference standard, with the bottom breakout aiming for a take-profit of twice the space. The space at the bottom is 600 points, with the take-profit set at 120 points above the neckline.
Bottom breakout, retest the neckline + reversal pattern to enter, how simple and clear is this logic? Any trader who understands technical analysis a bit knows this, and this pattern also has a position in the bullish trend after a 4-hour bottom breakout.
Complete logic, clear technique, simple operation.
04. Has repeatability, appears frequently enough, and has strong universality.
A truly worthwhile trading pattern is certainly a structure that appears repeatedly in the market, just like the bottom breakout mentioned above is often seen. Only when the frequency is high enough can it produce an accumulative profit effect.
Conversely, if a pattern appears only once or twice a year, it cannot support long-term profits.
Moreover, this pattern must have universality, applicable to different instruments and different timeframes, so that trading has flexibility. The key is that frequently occurring patterns allow you to continually practice and strengthen in real trading, thus truly enhancing your judgment and execution.
3. Clear pattern practical cases.
When you finally understand the previously confusing market; when you spot a valuable pattern in an unclear trend, that's the time to enter.
The rhythm of the market itself is an alternation of consolidation and trend. Extremes must reverse, which is the norm for trends. As mentioned at the beginning of the article, 'market conditions we don't understand' arise almost every day. But most people overlook one point: the market conditions we don't understand hide the best opportunities.
Because what is often called 'not understanding' often means that the candlesticks are compressing, the fluctuations are narrowing, and the space is being squeezed. And the end of compression is the beginning of a breakout and trend. Once the breakout is successful, the trend often shifts from chaos to clarity, which is ironically the lowest risk and highest cost-performance entry position.
Everyone, take a look at the chart below.
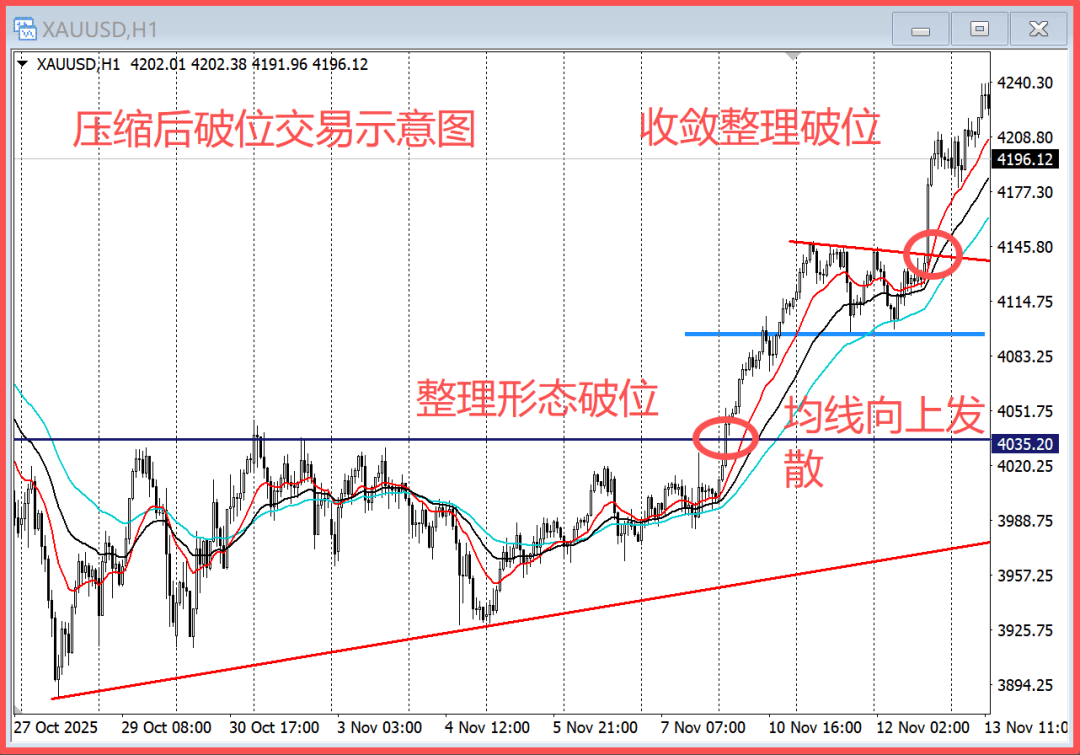 The chart shows the gold 1-hour candlestick chart. This trend is the connection after the first chart's trend in today's article.
The pattern lasted for 9 days.
At the tail end of the consolidation pattern, the low points of the candlesticks are continuously rising, indicating that the entire pattern is bullish, and the bullish trend is gradually becoming clearer.
When the market broke through the 4035 consolidation pattern resistance, the bullish trend was further established, and one could enter to go long. This position is clearly identifiable, with clear standards.
If you feel that entering at this position is a bit aggressive, after the market rises for one day, it enters a consolidation phase. This pattern is a standard triangular consolidation, with the descending trendline above the consolidation pattern clear and the breakout point easily identifiable. Enter on the breakout, with clear stop-loss and take-profit standards, followed by a significant market rise.
Traders often experience a common state where many are continuously trading in a consolidation, continuously hitting stop-losses, damaging their mindset, ignoring the overall structure. When the market breaks out and becomes clear, they ironically lack a good mindset to welcome simple and easy-to-trade markets.
So, no matter when, after making three mistakes in a row, stop, switch to a higher timeframe candlestick to observe if the market has entered a consolidation phase. If it has, exit in a timely manner and wait for the market to clarify before trading.
Weak water three thousand, only take a ladle; many markets, only do one.
Maturity in trading is not about understanding many indicators or theories, but about evolving from wanting to do everything to only doing what you can.
Find a set of structures that you can truly understand, execute smoothly, and repeat, delve into it, and take it to the extreme. Only by trading the patterns you are most familiar with, the patterns you can trade, can you stand on the high probability side of trading.
Trading is not about covering all aspects, but rather about focus and trade-offs.
Everyone, take a look at the chart below, only doing moving average divergence, and the clear triangular consolidation after the market starts.
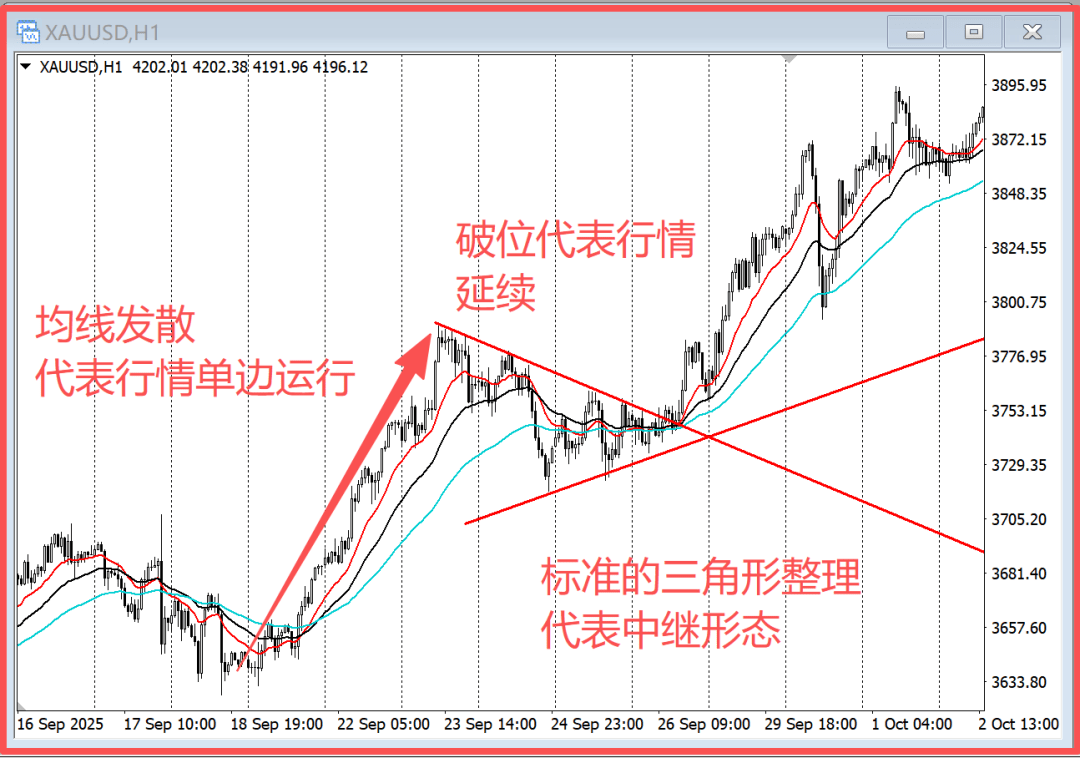 The chart shows the gold 1-hour candlestick chart.
After three days of consolidation on the left side of the market, it broke upwards, with three moving averages diverging upwards, running in a single direction, and then entering consolidation, forming a triangular consolidation pattern. The triangle converges increasingly narrowly, enter after the breakout, followed by a significant market rise.
Why set trading standards this way?
Because the divergence of moving averages is easily recognizable, it represents the running trend of the market; the consolidation triangle represents market continuation, and the two contracting trendlines are also very simple; the breakout represents the continuation of the trend, with clear and unique entry standards.
We cannot decide how the market will move, but we can decide when to participate, at what position to participate, and in what way to participate.
Focus your energy on those patterns that you can understand at a glance, can repeat, and can execute; the win rate will be more stable, the mindset will be steadier, and the profit curve will look better.
I am Little Egg Tart, a professional analyst and teacher, a mentor and friend on your investment journey! As an analyst, the most basic thing is to help everyone make money. I will help you solve confusion and issues, speaking with strength. When you feel lost and don't know what to do, follow Little Egg Tart, and Little Egg Tart will guide you #加密市场反弹 $ETH.

