#加密市场观察 The advisor discusses hot topics:
Last night when that pile of data came out, to be honest, what happened in September is already meaningless. It's all old accounts before the Americans halted, just take a look. What's worth mentioning is the ADP non-farm payroll, this data is simply outrageous. The previous value was revised from 42,000 to 47,000, did you think it was still stable?
As a result, the latest directly turned into -32,000, employment didn't rise but dropped instead, this is the real employment environment in America right now. Once the data was released, the market immediately smelled blood, and the CME's probability of a rate cut in December skyrocketed to 89%. This wave is not just poor employment, it's poor enough to corner the Federal Reserve.
However, the current market play is also ruthless; the higher the unemployment, the more assets rise. Because everyone has already psychologically prepared for such terrible employment, it is instead seen as a betting chip for a rate cut. In short, the Fed hasn't acted yet, and the market has already rebounded on its own.
As for the December interest rate meeting, if the hawkish rate cut operation really happens, it must also have some drama to hedge. For example, changing the Fed chairman and releasing some labor and inflation data favorable for a January rate cut after the meeting.
As for Japan, whether to raise interest rates around December 18, as long as they don't throw cold arrows at the market, it's fine. In fact, everyone already has expectations in their hearts, so it won't suddenly plunge.
The real main uptrend I still see after January, by then not only the interest rate cut hype will continue. The SEC chairman also jumped out to say that in January next year, there will be innovative exemptions for crypto companies, which clearly means pouring oil into the market.
Whether the trend recovery can be formally established will depend on that time, and the hardest technical line is that Bitcoin's candlestick must stand above 101K; if it doesn't stand, don't talk about trend reversal.
Back to the market, the most important thing right now is two words: volatility. Don't smash down, just keep the emotions stable. Yesterday, the two expected patterns I gave were both bullish, and now 93.4K has already broken through. The direction is very clear, continue to look up, the next target is first aimed at 99K.
But here I still want to say, don’t think about taking off in one go all day long. There is obvious liquidity accumulation above 96.K, remember to sell part of the longs when approaching that area, otherwise, when it pulls back, you'll start crying again.
But ultimately, I still define the current trend as a rebound rather than a reversal. The current rebound has already reached the third stage, with the first stage rebound dropping from 116.4K to pull back to 93K and then consolidating.
Now it is a larger level, a rebound since the drop from 126.2K. The next pressure of the expanded level is at 98K, which just overlaps with the Fibonacci 0.382 of the 4-hour decline. Whether this level can rebound past is the core factor in determining whether the rebound can upgrade to a reversal.
On the Ethereum side, my analysis yesterday said that breaking 3060 would aim for 3230. Sure enough, Ethereum seemed to be on steroids, faster and more elastic than Bitcoin, and the first target of 3230 has already been hit.
The upper pressure level is looking at 3660, and from the exchange rate structure, after the daily breakthrough of Ethereum, its performance will definitely be stronger than Bitcoin, which is a highly certain trend.
Master looks at the trend:
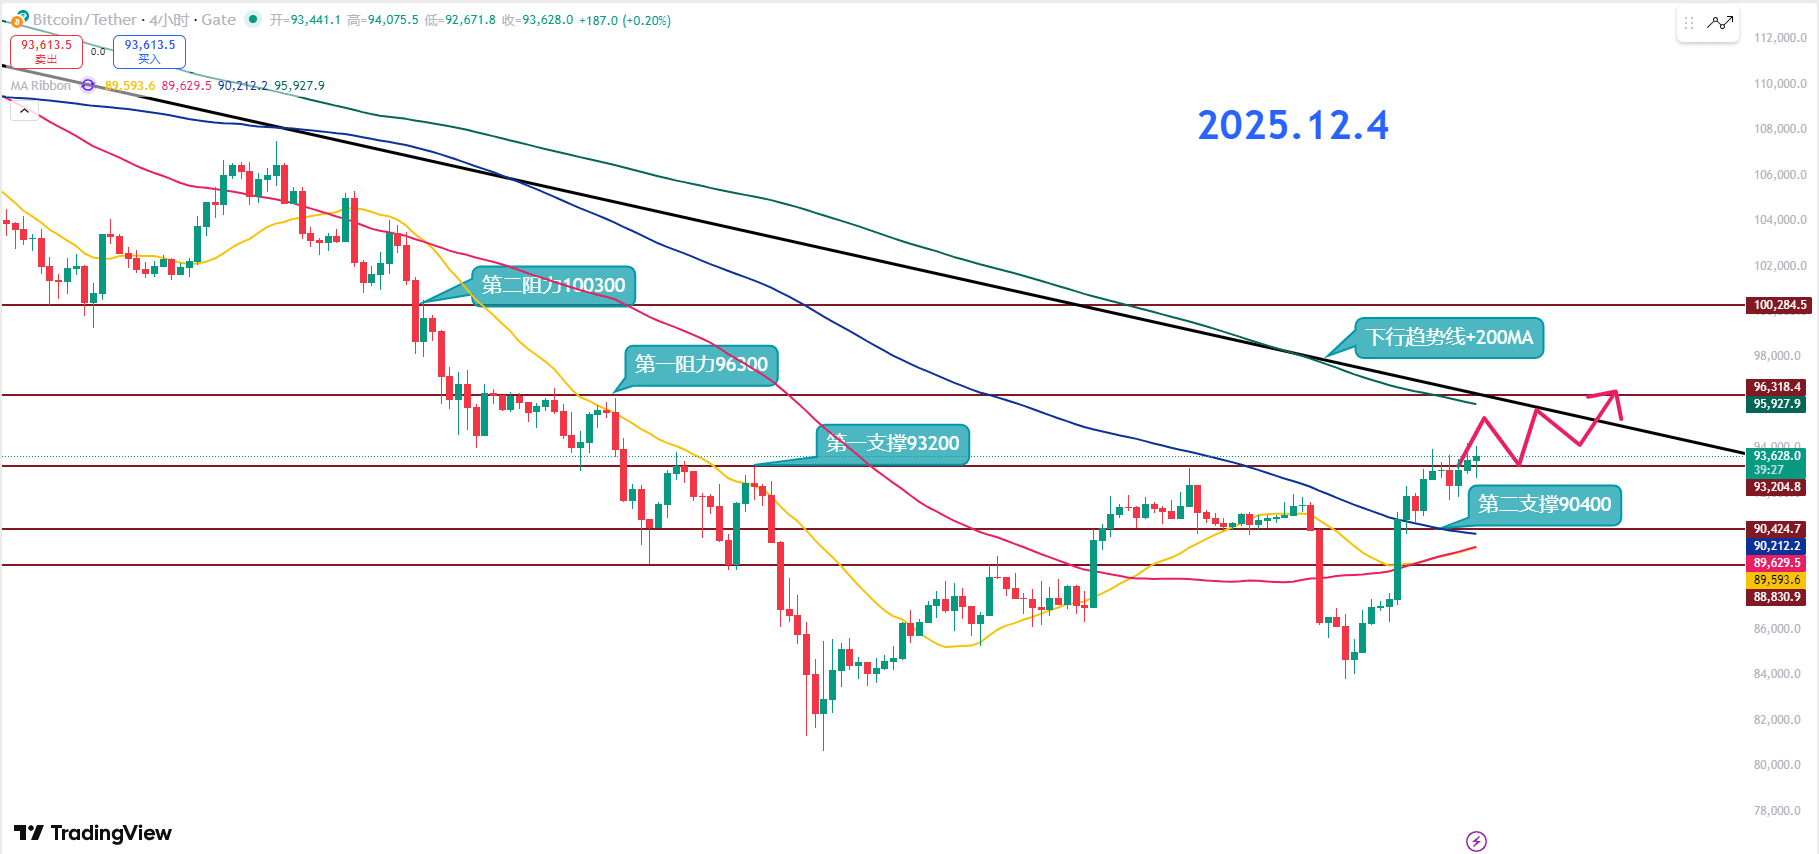
Resistance level reference
Second resistance level: 100300
First resistance level: 96300
Support level reference:
First support level: 93200
Second support level: 90400
The first resistance at 93.2K that was focused on yesterday has now become short-term support, and 90.4K to 93.2K is a standard support dense area. The bulls are in this pile of chips, and the upward target is first set at 96.3K.
The first resistance at 96.3K is the key pressure point where the 200MA and the downward trend line overlap; such positions are generally not passed through in one go. Most likely, it needs to touch it first, then pull back to wash out, and then continue to push up.
The current market needs a slight correction; as long as it does not break the previous low and raises the low points again, it can produce a second test of 96K. The short-term first support is 93.2K, and the second defensive line is at 92.5K, both of which are positions that can be gradually laid out.
The theoretical maximum support is at 90.4K, but if it really falls there, the bullish momentum will be cut off, which is not conducive to further attacks. Therefore, the more critical factor is whether the 92.6K area can continue to raise the lows.
If the first resistance at 96.3K touches and gives a reasonable pullback without breaking the level, then the probability of breaking through again will significantly increase. Once 96.3K breaks through and stabilizes, a second test above the second resistance at 100K is likely to come.
12.4 Master’s wave cycle pre-embedded:
Long entry reference: light positions in the range of 92500-93200, target: 94500-96300
Short entry reference: not currently referenced
If you really want to learn something from a blogger, you need to keep following them, rather than jumping to conclusions after watching a few market situations. This market is filled with performance players; today there’s a long position screenshot, and tomorrow there’s a short position summary, which looks like 'catching tops and bottoms every time,' but in reality, it’s all after the fact. A truly worthy blogger will have trading logic that is consistent, self-consistent, and withstands scrutiny, rather than jumping in only when the market moves. Don’t be blinded by exaggerated data and fragmented screenshots; long-term observation and deep understanding are required to distinguish who is a thinker and who is a dreamer!

