It seems that the cryptocurrency market is playing that game of blind man's bluff: Bitcoin continues to steal all the attention, and while the giant dances, other projects like Injective (INJ) remain in the shadows, waiting for a little liquidity to kickstart again. But watch out, the chart tells us a story with a happy ending.
Is Injective (INJ) the next gem that is about to make a big impact? 💎
The truth is that Injective (INJ) has had some spicy days, falling by 2.00% while most of the crypto market moved positively. This is like your neighbor throwing a party and you having to clean the street. But it's not bad luck; it's strategy and structure, and the future could be spectacular if it "hits the nail on the head" with the breakout.
The Analysis on the Field: Why is INJ Deflating a Bit? 📉
Here are the three blows that have it against the ropes, for easier understanding without too much jargon:
The "Bitcoin Season" Effect: The money, which is not stupid, is going to safety. Bitcoin is in dominant mode (58.72% of the entire market), which means that investors are pulling liquidity from the "altcoins" (alternative coins, like INJ) to measure it against the strongest asset. In layman's terms: people have "Extreme Fear" (index 20/100) and in fear, they seek the biggest one.
The Technical Wall: INJ fails to stay above its key moving averages ($5.88 and $6.64). To understand it, these averages are like the "floor" of the house; if the price is below, it means that sellers (those betting on a decline) have the upper hand.
Fatigue in the Traffic: Trading volume (people buying and selling) dropped by 23.82%. This is like driving and running out of gas: if there is no activity, the price lacks the strength to move with conviction.
The Image that Changes Everything: The Success Pattern 🚀
Now, the most important thing is not what happened, but what is about to happen.
The chart shows INJ trapped in a pattern that analysts call "Falling Wedge". This is one of the most bullish figures in technical analysis. Imagine the price as a ball bouncing inside a funnel, getting squeezed tighter and tighter.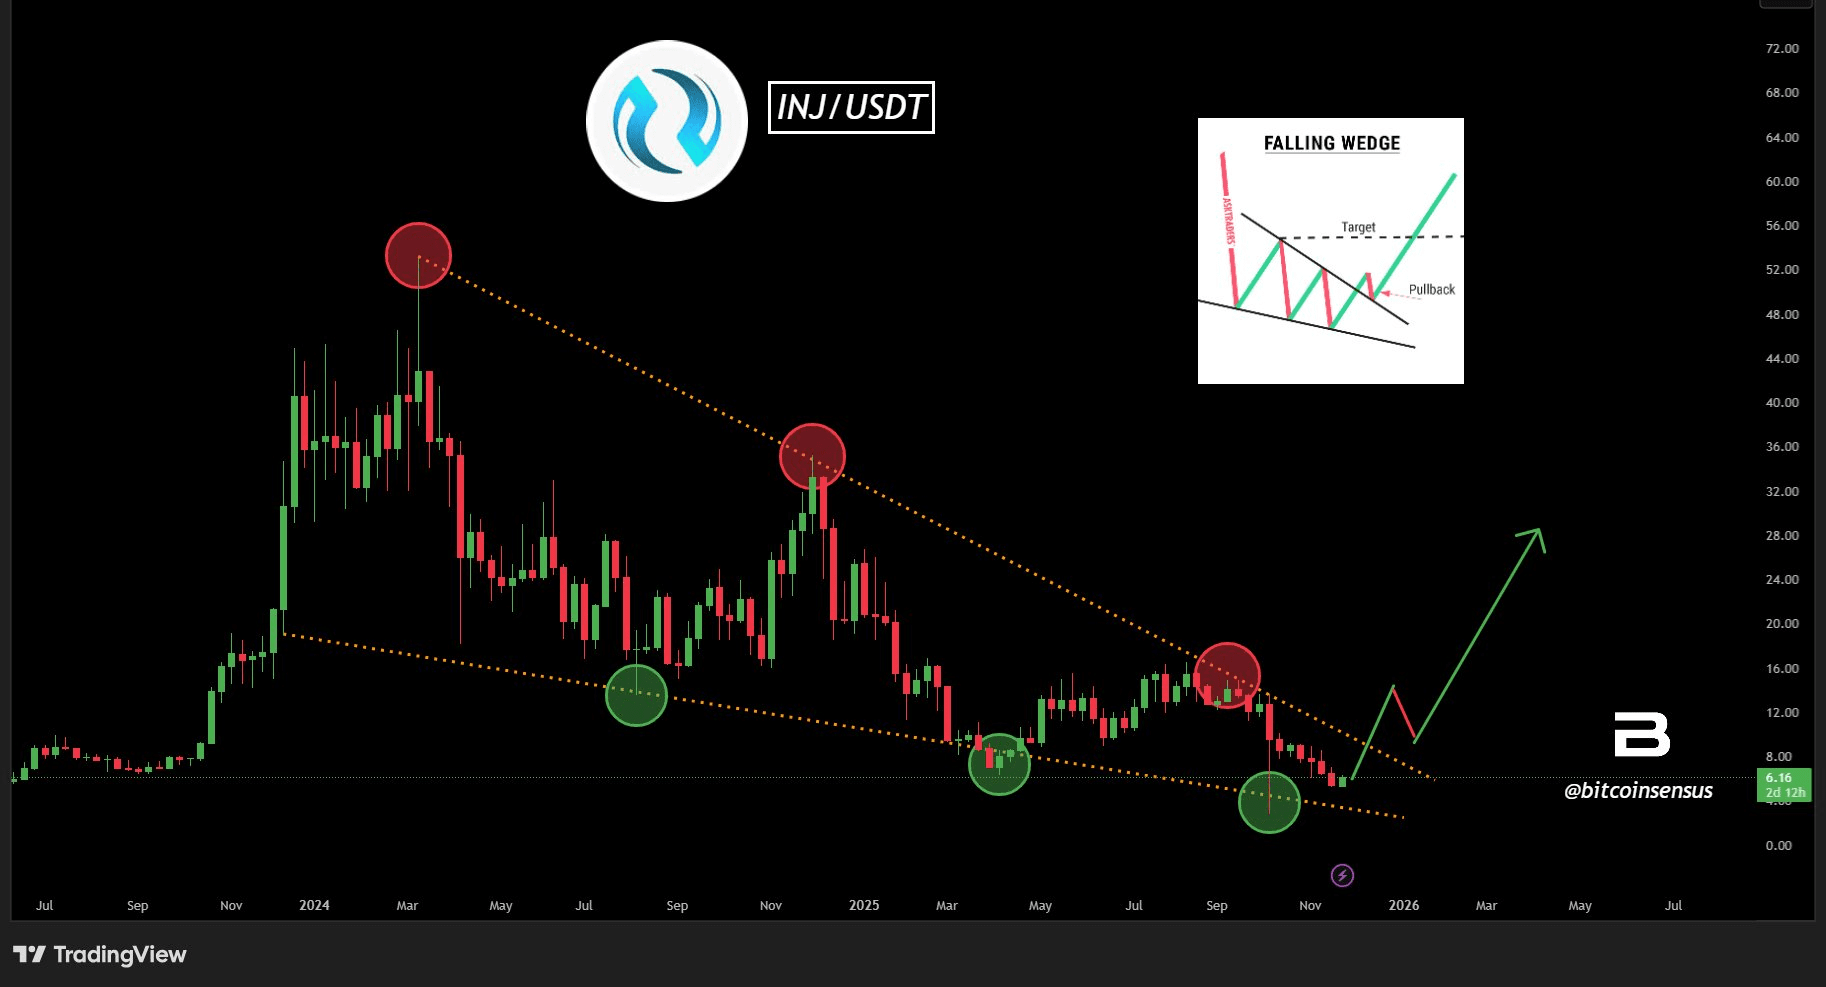
What does it mean? Historically, this pattern indicates that the selling pressure is running out. The price has touched the support line (below) several times, and each time it does so with less force.
The Breakout: The chart shows us that INJ is breaking that upper resistance line right now (the dotted line that descends from the all-time highs). This is the key moment.
The Target: If it manages to be confirmed (that is, if the price stays outside the wedge), theory says that the price of INJ should aim for the "Target" zone that you see in the reference drawing, which would imply a brutal upward movement.
The Game of Patience and Fundamentals 🧠
And here comes the cultural touch. Despite the war drums in the market, Injective developers are not sitting idly.
They launched their EVM mainnet (a giant step to attract more projects).
They are doing massive buybacks (burning $39.5 million in November), which is like reducing a company's shares so that the remaining ones are worth more.
How does this affect you?
If you have INJ, you must be a strategist, not a player. The fundamentals (network upgrades and burns) say that this has value in the long term. Technical analysis (the descending wedge) says we are one step away from a price explosion.
Key point to watch: If Bitcoin falls below $88,000, panic could erase this bullish breakout of INJ and we would see it test the support of $5.21. But if the market holds and the pattern is confirmed, Injective is ready to hit the nail on the head and be that gem that brings a smile to your face. The altcoin party hasn't started yet, but INJ is knocking at the door.

