Alright team, let's break down this juicy ETH chart and see what's cooking. The daily chart is signaling a massive opportunity after a necessary correction.
Technical Analysis
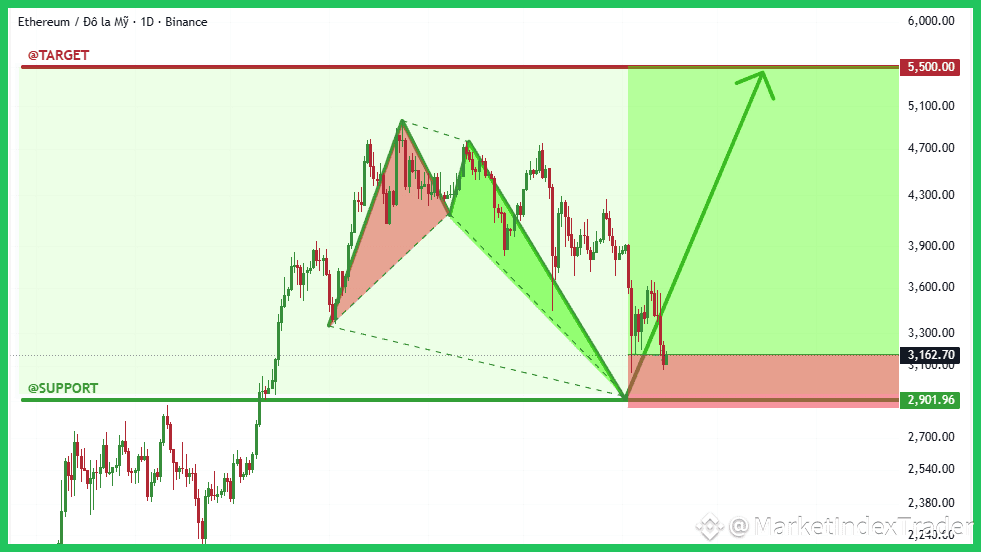
ETH has perfectly tagged the critical $2,900 structural support zone, initiating a sharp bounce from the completion point of a bullish reversal pattern. This suggests selling pressure is exhausted at this level. As long as we maintain price action above the $2,900 support, the outlook remains extremely bullish. We are currently consolidating around $3,160, aiming to break the initial resistance around $3,400. The ultimate chart target is marked clearly at $5,500.
Fundamental Analysis
Fundamentally, Ethereum remains incredibly robust. Institutional excitement is growing around the potential for spot ETH ETFs later this year, mirroring the success of Bitcoin ETFs. Furthermore, the thriving Layer 2 ecosystem (like Arbitrum and Optimism) continues to drive massive transaction demand, sustaining the deflationary economics of the ETH token.
This dip looks like a prime accumulation opportunity. I am entering long positions near current levels. The risk/reward ratio on this setup is highly favorable for holders.
Highly recommend HOLD and Stacking ETH at Binance
Feel free to comment the altcoin you are holding and we will check it for you!
#ETH #Ethereum #TechnicalAnalysis #Crypto #BinanceSquare #Bitcoin


