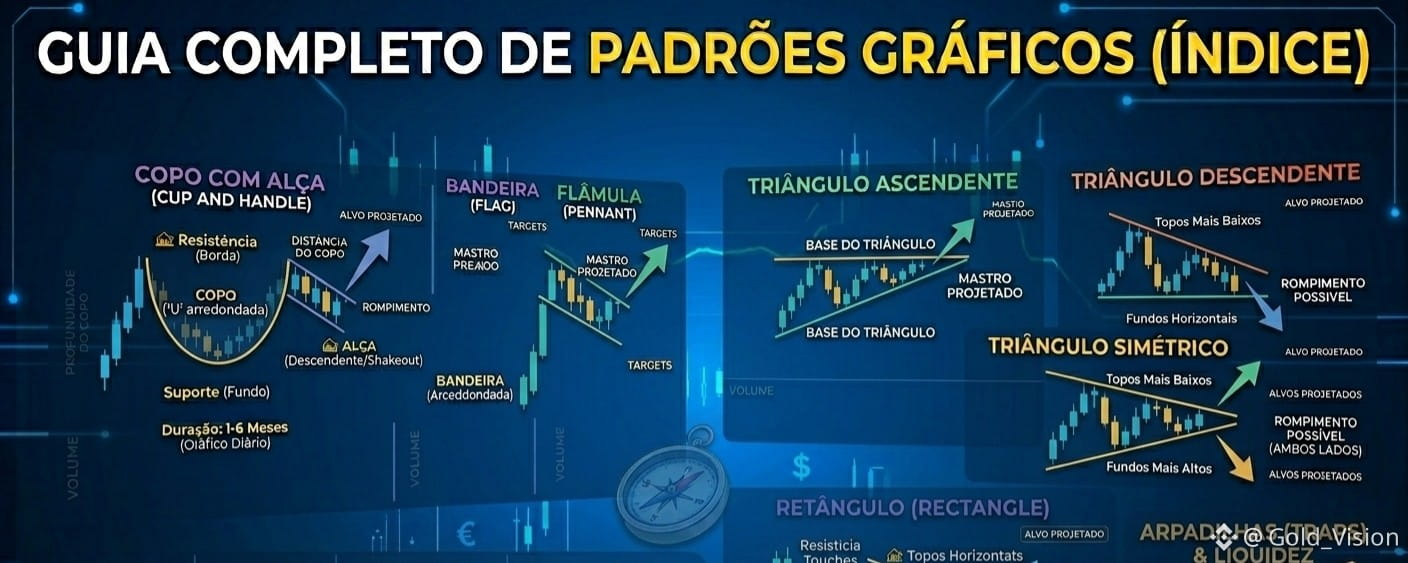
Here's a neatly organized index of all chart patterns and market concepts that can be explored here. You can use this guide as a "quick reference sheet" for your studies and trading.
📘 Chart Patterns Index
1. Reversal Patterns
Indicates that the current trend is losing momentum and the price is likely to change direction.
Double Top ("M"): Bullish to bearish reversal.__Double Bottom ("W"): Bearish to bullish reversal.
2. Continuation Patterns
They indicate a temporary pause (consolidation) before the price resumes the original trend.
Bullish Flags: Quick rectangular consolidation against the main trend.
Pennants: Small triangular consolidation after an explosive move (flagpole).
Cup and Handle: Long-term rounded consolidation with a bullish bias.
3. Consolidation Patterns (Triangles and Rectangles)
They can act as continuation or reversal patterns, depending on the breakout.
Rectangle (Box): Sideways movement between parallel support and resistance.
⚠️ Concepts of Manipulation and Traps
Fundamentals to understand why breakouts fail.