
#smc
smc
1.6M views
16,076 Discussing
Hot
Latest

·
--
Bullish
🌊 RIVERUSDT – Bullish Recovery or Bearish Continuation?
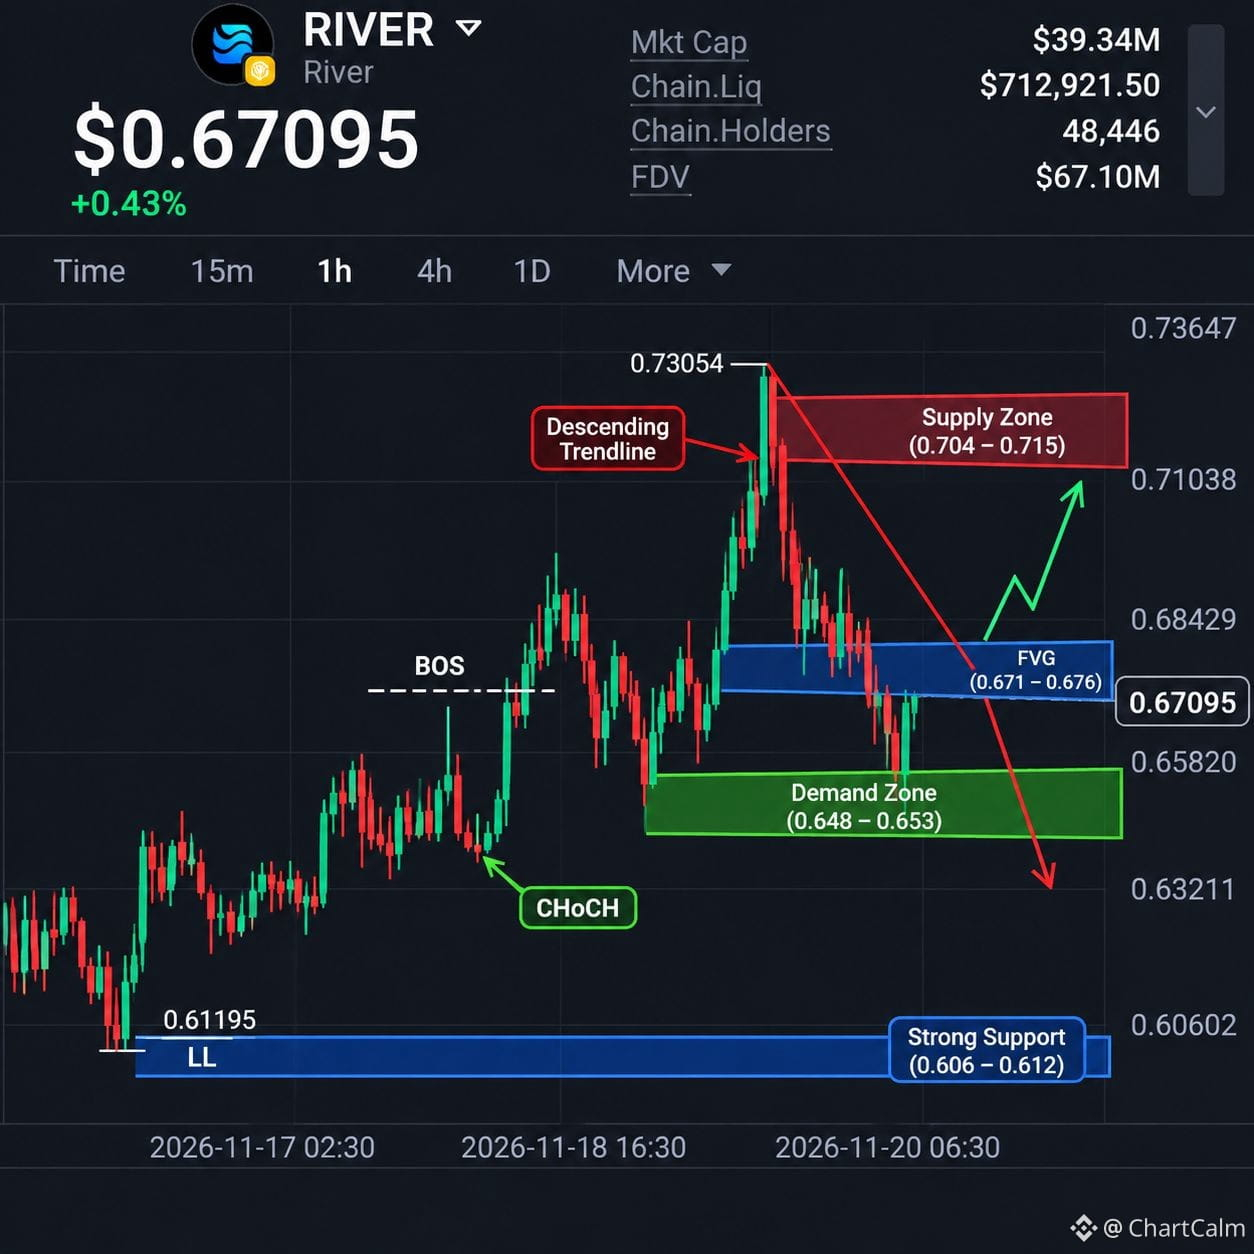
RIVER is showing a pullback after reaching the recent high of $0.73054.
📊 SMC + ICT Breakdown
🔴 Supply Zone: $0.704–$0.715
🔵 FVG Watch Zone: $0.671–$0.676
🟢 Demand Zone: $0.648–$0.653
🔵 Strong Support: $0.606–$0.612
Market Structure
- Previous bullish BOS.
- Recent bearish displacement.
- Price is attempting a recovery from demand.
- Watch the descending resistance trendline.
📉 Bearish Scenario
Rejection near $0.676 could bring another test of demand.
📈 Bullish Scenario
A confirmed move above $0.684 could indicate recovery towards higher resistance.
🎯 My Observation
RIVER is at an important decision area. I want to see confirmation before deciding the next direction.
🐂 Bullish or 🐻 Bearish? What's your view?
⚠️ Educational analysis only. Not financial advice.
$RIVER
{alpha}(560xda7ad9dea9397cffddae2f8a052b82f1484252b3)
#RIVER #CryptoAnalysis #SMC #PriceAction
🌊 RIVERUSDT – Bullish Recovery or Bearish Continuation?
RIVER is showing a pullback after reaching the recent high of $0.73054.
📊 SMC + ICT Breakdown
🔴 Supply Zone: $0.704–$0.715
🔵 FVG Watch Zone: $0.671–$0.676
🟢 Demand Zone: $0.648–$0.653
🔵 Strong Support: $0.606–$0.612
Market Structure
- Previous bullish BOS.
- Recent bearish displacement.
- Price is attempting a recovery from demand.
- Watch the descending resistance trendline.
📉 Bearish Scenario
Rejection near $0.676 could bring another test of demand.
📈 Bullish Scenario
A confirmed move above $0.684 could indicate recovery towards higher resistance.
🎯 My Observation
RIVER is at an important decision area. I want to see confirmation before deciding the next direction.
🐂 Bullish or 🐻 Bearish? What's your view?
⚠️ Educational analysis only. Not financial advice.
$RIVER
#RIVER #CryptoAnalysis #SMC #PriceAction
RIVER is showing a pullback after reaching the recent high of $0.73054.
📊 SMC + ICT Breakdown
🔴 Supply Zone: $0.704–$0.715
🔵 FVG Watch Zone: $0.671–$0.676
🟢 Demand Zone: $0.648–$0.653
🔵 Strong Support: $0.606–$0.612
Market Structure
- Previous bullish BOS.
- Recent bearish displacement.
- Price is attempting a recovery from demand.
- Watch the descending resistance trendline.
📉 Bearish Scenario
Rejection near $0.676 could bring another test of demand.
📈 Bullish Scenario
A confirmed move above $0.684 could indicate recovery towards higher resistance.
🎯 My Observation
RIVER is at an important decision area. I want to see confirmation before deciding the next direction.
🐂 Bullish or 🐻 Bearish? What's your view?
⚠️ Educational analysis only. Not financial advice.
$RIVER
#RIVER #CryptoAnalysis #SMC #PriceAction
1
521

·
--
📚 SMC SERIES | DAY 2
🧱 ORDER BLOCKS: Where Smart Money Enters
Ever noticed price returning to the same zone
before continuing its move? That zone is
often an Order Block. 🎯
🧠 WHAT IS AN ORDER BLOCK (OB)?
An Order Block is the LAST opposite candle before
a strong, impulsive move.
It marks an area where big players likely placed
large orders, so price often reacts there again.
🟢 BULLISH OB (Demand)
The last RED candle before a strong move UP.
Price returns to this zone → look for buys.
🔴 BEARISH OB (Supply)
The last GREEN candle before a strong move DOWN.
Price returns to this zone → look for sells.
✅ WHAT MAKES A STRONG OB?
🔸 Strong, fast move away from the zone
🔸 It breaks market structure (BOS)
🔸 It sweeps liquidity before the move
🔸 It leaves a Fair Value Gap behind
🔸 Price has NOT returned to it yet (fresh)
⚠️ WHEN AN OB FAILS
🔸 Price closes fully through the zone
🔸 The zone was already tested many times
🔸 It goes against the higher-timeframe trend
💡 HOW TO USE IT
1️⃣ Find the trend on the 1D chart
2️⃣ Mark the OB on the 4H chart
3️⃣ Wait for price to come back to the zone
4️⃣ Enter on confirmation, SL beyond the zone
No OB is 100% guaranteed. Always use a stop loss. 🛡
🎯 TODAY'S TASK
Open BTC on the 4H chart. Find one bullish OB
and one bearish OB. Comment which one is
closer to current price. 👇
⏭ Tomorrow → DAY 3: Break of Structure (BOS)
Follow BIT Badger so you don't miss it! 🔔
Educational purposes only. Not financial advice.
Ever wondered why price keeps reacting from the
same zone again and again? 🤔
That's the Order Block at work.
Do you mark OBs before entering a trade?
Comment YES or NO 👇
#cryptouniverseofficial #smc #cryptoeducation
📚 SMC SERIES | DAY 2
🧱 ORDER BLOCKS: Where Smart Money Enters
Ever noticed price returning to the same zone
before continuing its move? That zone is
often an Order Block. 🎯
🧠 WHAT IS AN ORDER BLOCK (OB)?
An Order Block is the LAST opposite candle before
a strong, impulsive move.
It marks an area where big players likely placed
large orders, so price often reacts there again.
🟢 BULLISH OB (Demand)
The last RED candle before a strong move UP.
Price returns to this zone → look for buys.
🔴 BEARISH OB (Supply)
The last GREEN candle before a strong move DOWN.
Price returns to this zone → look for sells.
✅ WHAT MAKES A STRONG OB?
🔸 Strong, fast move away from the zone
🔸 It breaks market structure (BOS)
🔸 It sweeps liquidity before the move
🔸 It leaves a Fair Value Gap behind
🔸 Price has NOT returned to it yet (fresh)
⚠️ WHEN AN OB FAILS
🔸 Price closes fully through the zone
🔸 The zone was already tested many times
🔸 It goes against the higher-timeframe trend
💡 HOW TO USE IT
1️⃣ Find the trend on the 1D chart
2️⃣ Mark the OB on the 4H chart
3️⃣ Wait for price to come back to the zone
4️⃣ Enter on confirmation, SL beyond the zone
No OB is 100% guaranteed. Always use a stop loss. 🛡
🎯 TODAY'S TASK
Open BTC on the 4H chart. Find one bullish OB
and one bearish OB. Comment which one is
closer to current price. 👇
⏭ Tomorrow → DAY 3: Break of Structure (BOS)
Follow BIT Badger so you don't miss it! 🔔
Educational purposes only. Not financial advice.
Ever wondered why price keeps reacting from the
same zone again and again? 🤔
That's the Order Block at work.
Do you mark OBs before entering a trade?
Comment YES or NO 👇
#cryptouniverseofficial #smc #cryptoeducation
🧱 ORDER BLOCKS: Where Smart Money Enters
Ever noticed price returning to the same zone
before continuing its move? That zone is
often an Order Block. 🎯
🧠 WHAT IS AN ORDER BLOCK (OB)?
An Order Block is the LAST opposite candle before
a strong, impulsive move.
It marks an area where big players likely placed
large orders, so price often reacts there again.
🟢 BULLISH OB (Demand)
The last RED candle before a strong move UP.
Price returns to this zone → look for buys.
🔴 BEARISH OB (Supply)
The last GREEN candle before a strong move DOWN.
Price returns to this zone → look for sells.
✅ WHAT MAKES A STRONG OB?
🔸 Strong, fast move away from the zone
🔸 It breaks market structure (BOS)
🔸 It sweeps liquidity before the move
🔸 It leaves a Fair Value Gap behind
🔸 Price has NOT returned to it yet (fresh)
⚠️ WHEN AN OB FAILS
🔸 Price closes fully through the zone
🔸 The zone was already tested many times
🔸 It goes against the higher-timeframe trend
💡 HOW TO USE IT
1️⃣ Find the trend on the 1D chart
2️⃣ Mark the OB on the 4H chart
3️⃣ Wait for price to come back to the zone
4️⃣ Enter on confirmation, SL beyond the zone
No OB is 100% guaranteed. Always use a stop loss. 🛡
🎯 TODAY'S TASK
Open BTC on the 4H chart. Find one bullish OB
and one bearish OB. Comment which one is
closer to current price. 👇
⏭ Tomorrow → DAY 3: Break of Structure (BOS)
Follow BIT Badger so you don't miss it! 🔔
Educational purposes only. Not financial advice.
Ever wondered why price keeps reacting from the
same zone again and again? 🤔
That's the Order Block at work.
Do you mark OBs before entering a trade?
Comment YES or NO 👇
#cryptouniverseofficial #smc #cryptoeducation
BIT Badger
·
--
📊 UNDERSTANDING SMART MONEY CONCEPTS (SMC)
Ever wondered why the market suddenly moves in one direction, takes out previous highs or lows, and then reverses?
This is where Smart Money Concepts (SMC) comes into the picture.
SMC is a trading approach focused on understanding market structure, liquidity and price movements to identify potential trading opportunities.
🎯 What will we learn in this series?
1️⃣ Liquidity – Where are traders' stop losses located?
2️⃣ Order Blocks – Understanding potential institutional buying and selling zones.
3️⃣ Break of Structure (BOS) – Identifying trend continuation.
4️⃣ Change of Character (CHOCH) – Spotting potential trend changes.
5️⃣ Fair Value Gap (FVG) – Understanding price imbalances.
💡 Our Goal: Learn to read price action, understand market behavior and make more informed trading decisions.
No shortcuts. No guaranteed profits. Just learning, analyzing and improving.
📌 This is the beginning of our SMC Trading Education Series.
Follow BIT Badger for the next lesson!
What should we learn first? Share your thoughts in the comments.
#smc #cryptoeducation #priceaction #cryptotrading #TechnicalAnalysis
Ever wondered why the market suddenly moves in one direction, takes out previous highs or lows, and then reverses?
This is where Smart Money Concepts (SMC) comes into the picture.
SMC is a trading approach focused on understanding market structure, liquidity and price movements to identify potential trading opportunities.
🎯 What will we learn in this series?
1️⃣ Liquidity – Where are traders' stop losses located?
2️⃣ Order Blocks – Understanding potential institutional buying and selling zones.
3️⃣ Break of Structure (BOS) – Identifying trend continuation.
4️⃣ Change of Character (CHOCH) – Spotting potential trend changes.
5️⃣ Fair Value Gap (FVG) – Understanding price imbalances.
💡 Our Goal: Learn to read price action, understand market behavior and make more informed trading decisions.
No shortcuts. No guaranteed profits. Just learning, analyzing and improving.
📌 This is the beginning of our SMC Trading Education Series.
Follow BIT Badger for the next lesson!
What should we learn first? Share your thoughts in the comments.
#smc #cryptoeducation #priceaction #cryptotrading #TechnicalAnalysis
76

·
--
Article
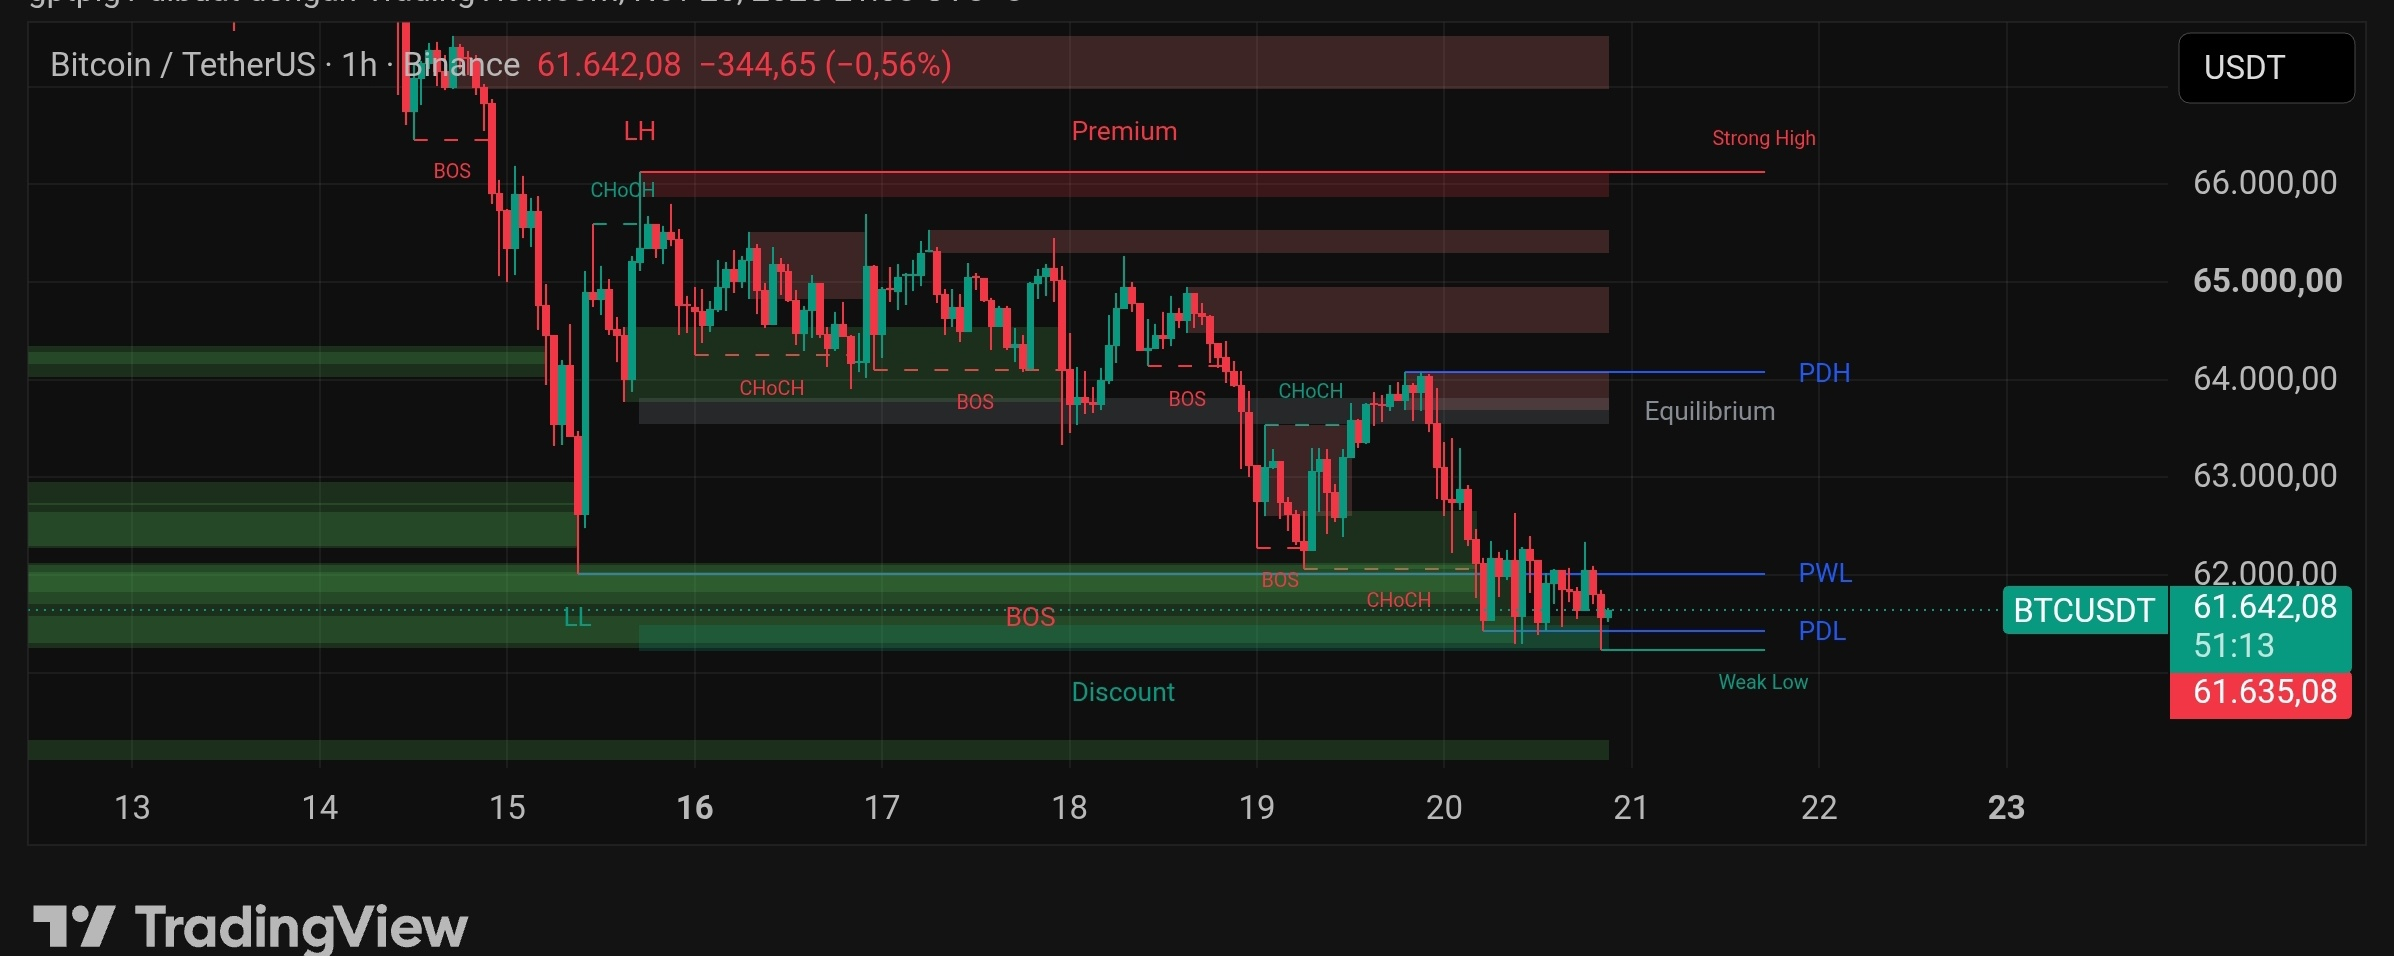
Bitcoin Technical Insight$BTC down 4.97% in 24 hours and printed a 90-day low at 61,155.0. The interesting part isn't the drop. A 5m climax candle with volume 4.7x–6.5x the average (two modules calculate it differently) closed around 70% of its range, and the current price of 61,648.3 is only 0.17% below the 3-day VAL (61,752.87).
Price is also sitting inside two opposing zones: a 5m bear FVG at 61,585.4–61,761.3 and two bullish 1H OBs. Both can't be respected at the same time. The decisive level is 61,255.6, for reasons I'll explain below.
Bitcoin Technical Insight
$BTC down 4.97% in 24 hours and printed a 90-day low at 61,155.0. The interesting part isn't the drop. A 5m climax candle with volume 4.7x–6.5x the average (two modules calculate it differently) closed around 70% of its range, and the current price of 61,648.3 is only 0.17% below the 3-day VAL (61,752.87).
Price is also sitting inside two opposing zones: a 5m bear FVG at 61,585.4–61,761.3 and two bullish 1H OBs. Both can't be respected at the same time. The decisive level is 61,255.6, for reasons I'll explain below.
Price is also sitting inside two opposing zones: a 5m bear FVG at 61,585.4–61,761.3 and two bullish 1H OBs. Both can't be respected at the same time. The decisive level is 61,255.6, for reasons I'll explain below.
371
·
--
Article
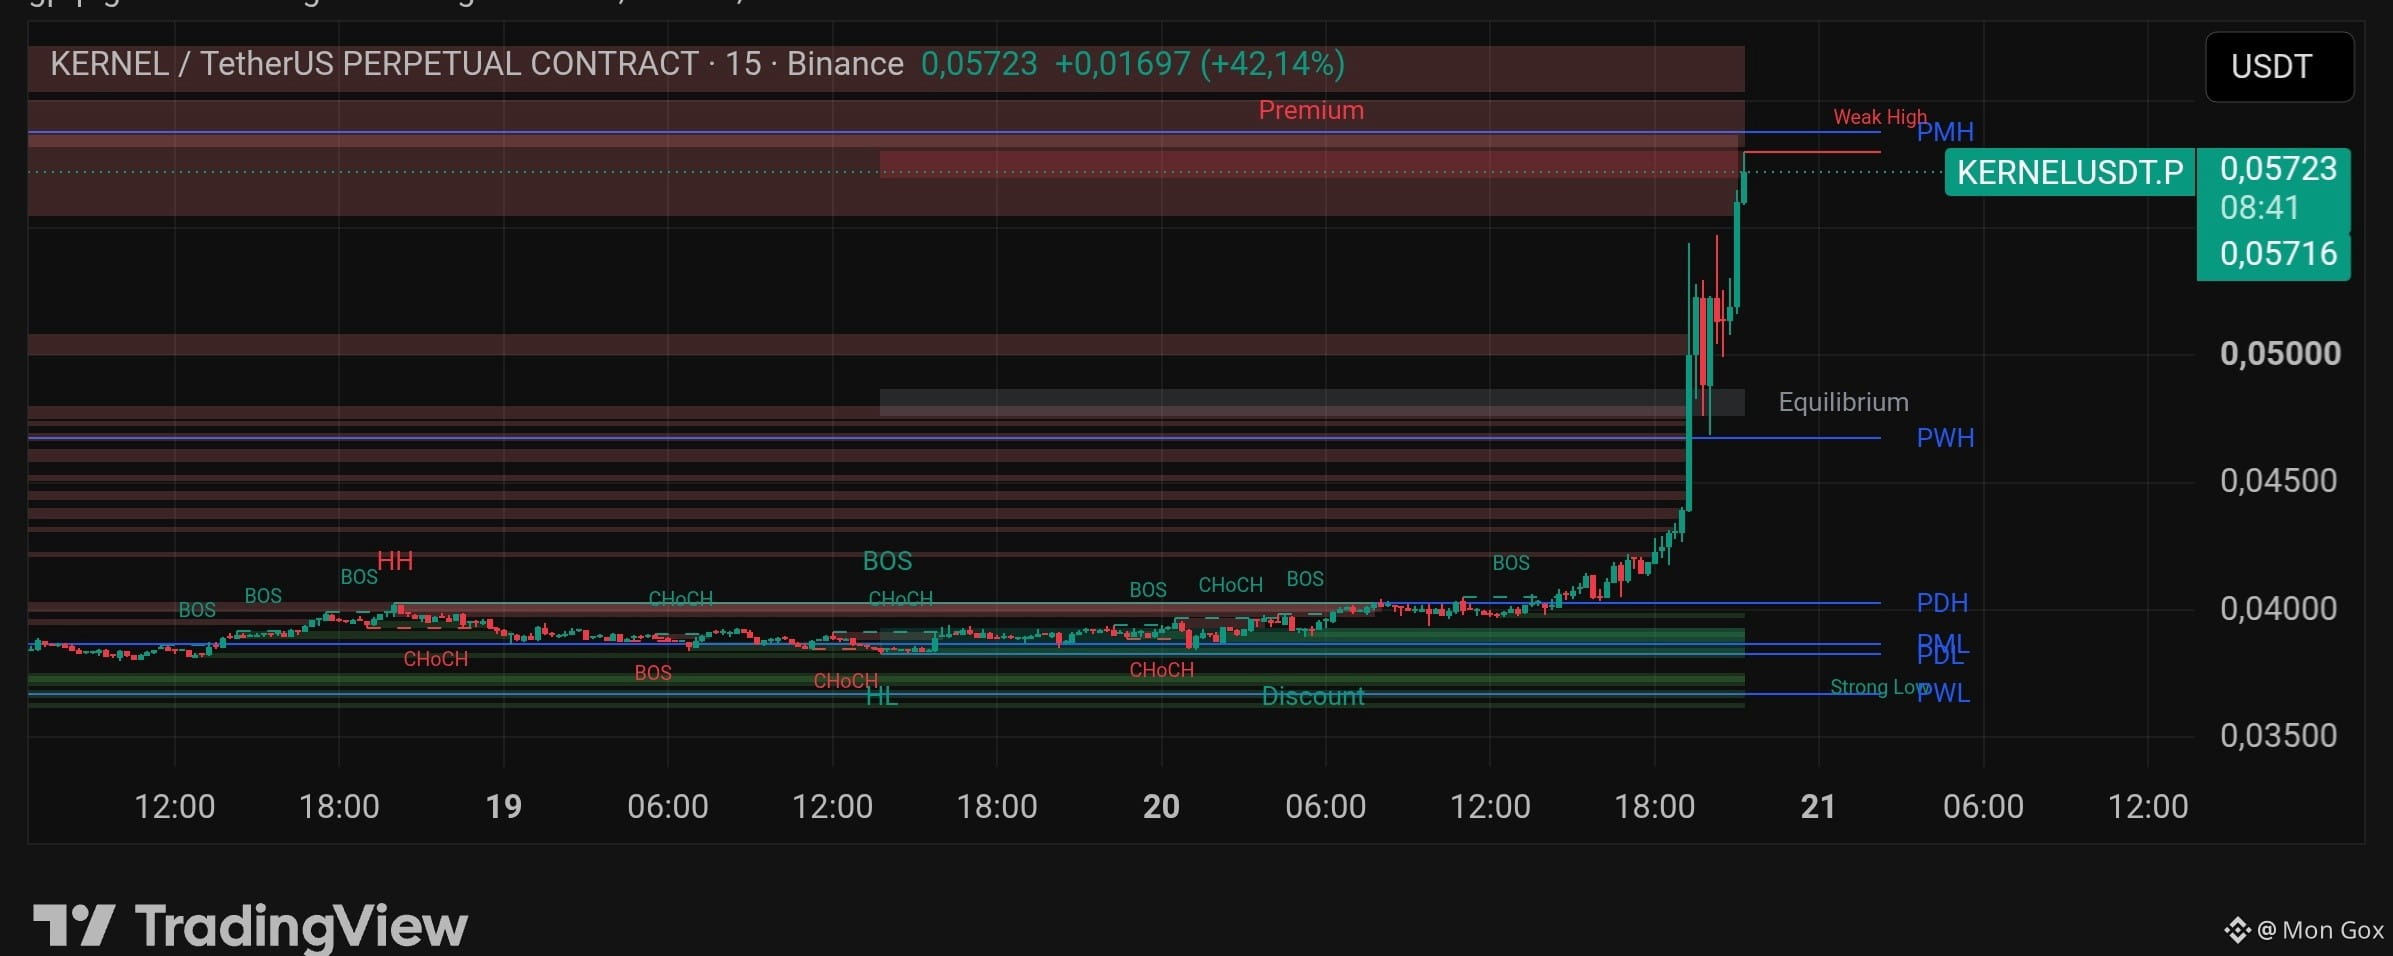
KERNEL Technical Insights.$KERNEL Up 45.6% in 24 hours and now at 0.05641, 2.4% below the 24-hour high of 0.05777. But the latest buying climax on the 5m chart appeared on the last candle, with volume 5.92x the average. Heavy volume has come in, and now the question is: is this a peak, or a pause before continuing higher? I don't know yet, but the levels are clear enough to check on the chart.
What happened on the 5m chart: first, two SOS at 0.05038 (vol 2.59x) and 0.05227 (vol 4.05x), two SC around 0.0513 (vol 2.38x and 2.41x), a BC at 0.05216 (vol 2.58x), then consecutive SOS at 0.05437 (vol 4.47x) and 0.05604 (vol 6.41x), ending with a BC at 0.0563 (vol 5.92x). The 5m phase is still MARKUP with an UP trend. The latest bullish BOS at 0.05474 and 0.05442 occurred just one candle ago, and price has already moved past them. Interestingly, the last candle's EVR is 5.6, and the model flags possible absorption. The volume is there, but the price movement hasn't kept pace. There is no SPRING or UTAD on the 5m chart to help determine the direction.
KERNEL Technical Insights.
$KERNEL Up 45.6% in 24 hours and now at 0.05641, 2.4% below the 24-hour high of 0.05777. But the latest buying climax on the 5m chart appeared on the last candle, with volume 5.92x the average. Heavy volume has come in, and now the question is: is this a peak, or a pause before continuing higher? I don't know yet, but the levels are clear enough to check on the chart.
What happened on the 5m chart: first, two SOS at 0.05038 (vol 2.59x) and 0.05227 (vol 4.05x), two SC around 0.0513 (vol 2.38x and 2.41x), a BC at 0.05216 (vol 2.58x), then consecutive SOS at 0.05437 (vol 4.47x) and 0.05604 (vol 6.41x), ending with a BC at 0.0563 (vol 5.92x). The 5m phase is still MARKUP with an UP trend. The latest bullish BOS at 0.05474 and 0.05442 occurred just one candle ago, and price has already moved past them. Interestingly, the last candle's EVR is 5.6, and the model flags possible absorption. The volume is there, but the price movement hasn't kept pace. There is no SPRING or UTAD on the 5m chart to help determine the direction.
What happened on the 5m chart: first, two SOS at 0.05038 (vol 2.59x) and 0.05227 (vol 4.05x), two SC around 0.0513 (vol 2.38x and 2.41x), a BC at 0.05216 (vol 2.58x), then consecutive SOS at 0.05437 (vol 4.47x) and 0.05604 (vol 6.41x), ending with a BC at 0.0563 (vol 5.92x). The 5m phase is still MARKUP with an UP trend. The latest bullish BOS at 0.05474 and 0.05442 occurred just one candle ago, and price has already moved past them. Interestingly, the last candle's EVR is 5.6, and the model flags possible absorption. The volume is there, but the price movement hasn't kept pace. There is no SPRING or UTAD on the 5m chart to help determine the direction.
290

🚨 $PAXG Alert: The "Safe Haven" SCAM Exposed! Are You Trapped? 🥇🩸
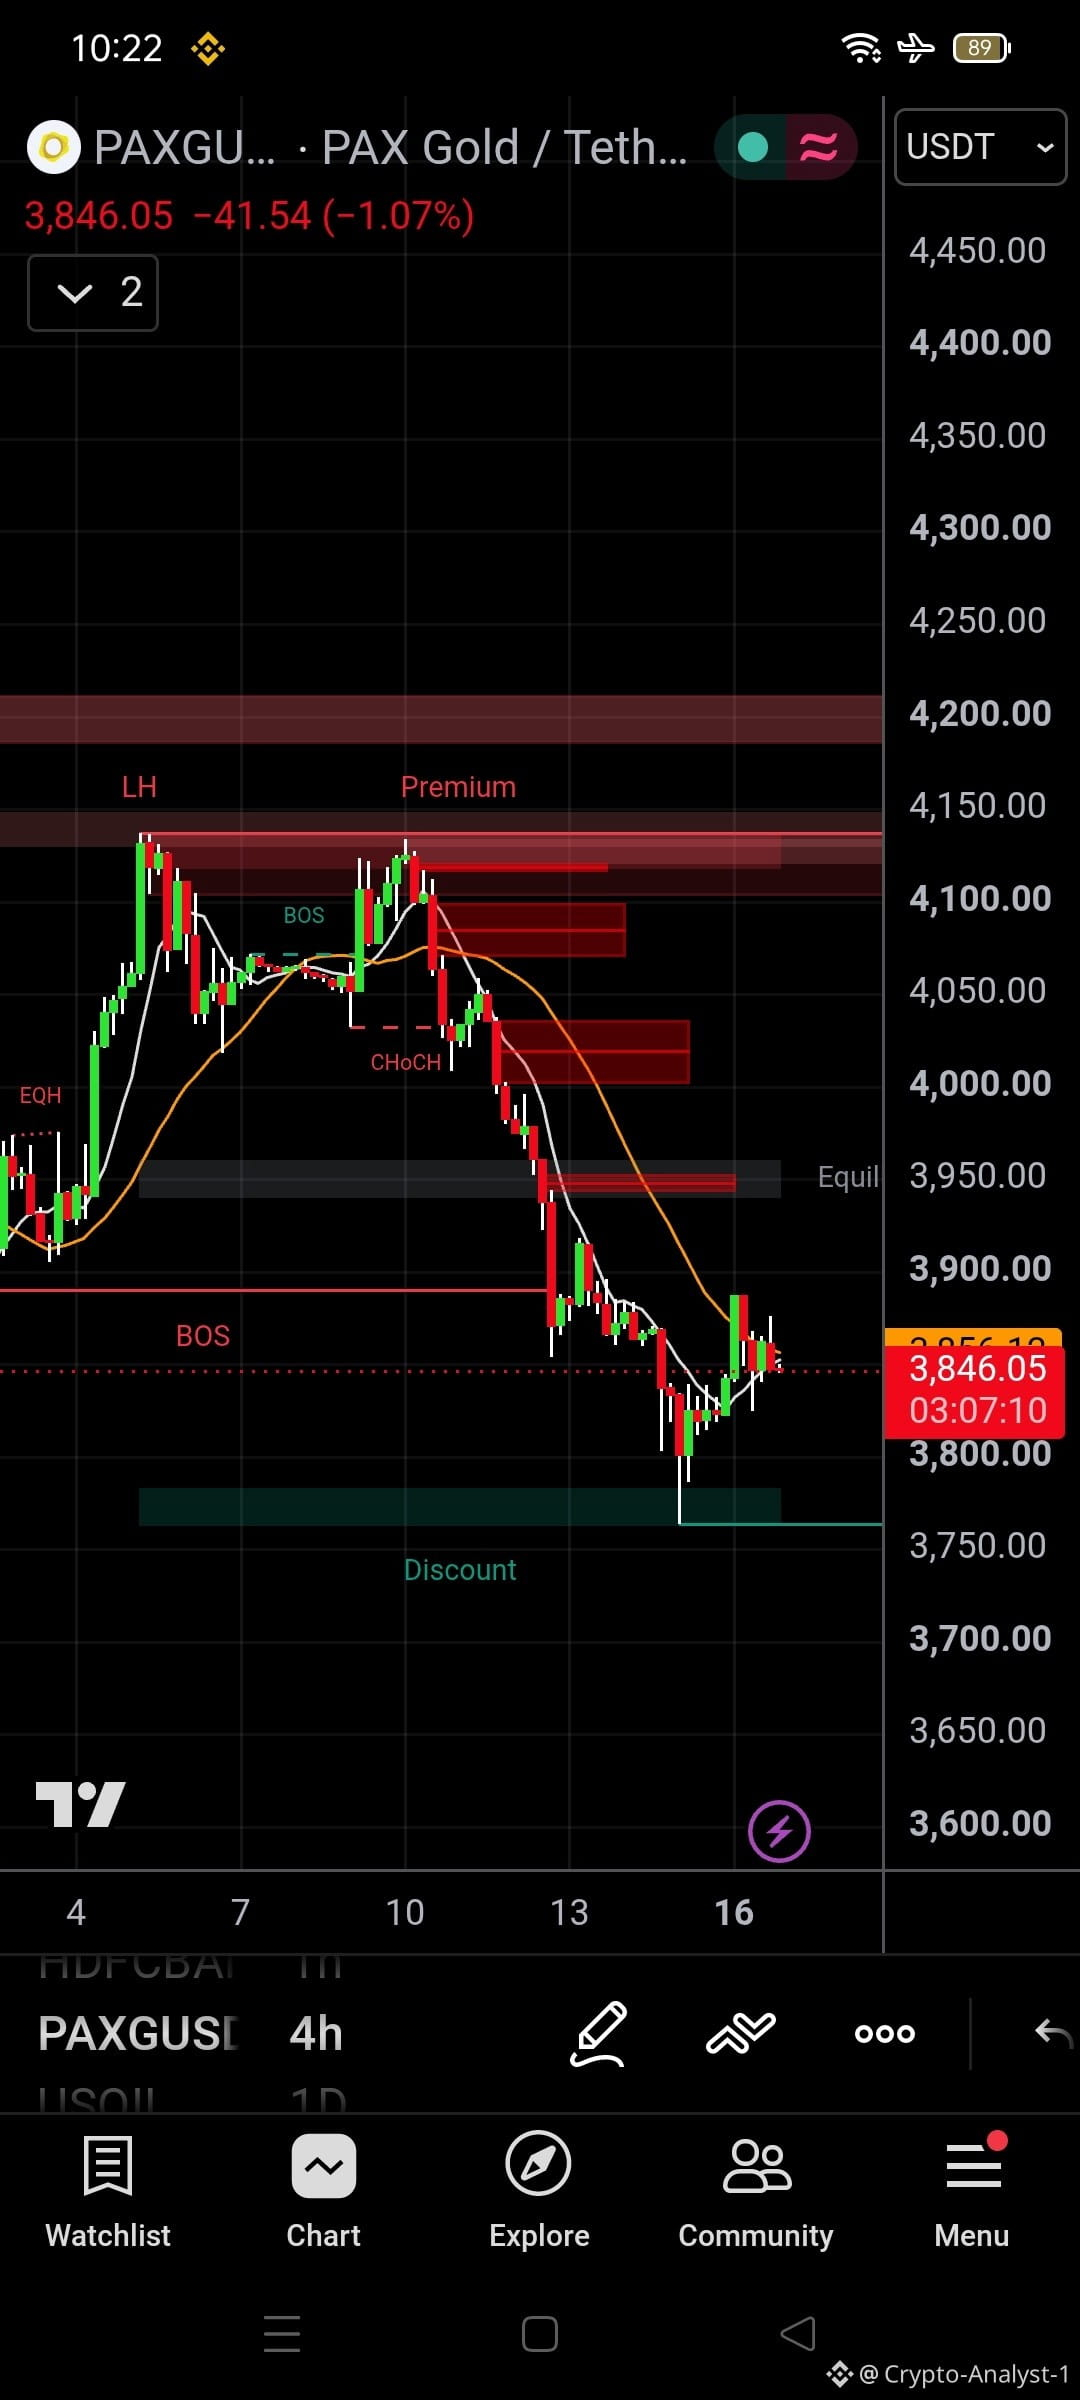
Look at this 4H chart. We were all told that when crypto bleeds, Gold shines. But look at the reality.
Here is the BRUTAL MASALEDAAR TRUTH:
1️⃣ The Illusion: Retail traders rushed into Gold as a safe haven, ignoring the clear structure.
2️⃣ The Reality: The market printed a Lower High (LH), a clear CHoCH, and a brutal BOS to the downside.
3️⃣ The Trap: Now the price is sitting at $3,846, desperately trying to break above the moving average ($3,856). The trend is still bearish. Whales dumped on the "safe haven" narrative.
Are you the one who bought Gold thinking it would save you, or did you see the trap coming?
🎯 Key Battlefield Levels:
🟢 Support: $3,800 - $3,750 (The recent sweep zone)
🔴 Resistance: $3,856 (The Boss - Moving Average) & $3,900 (The broken BOS level)
👇 MASALEDAAR QUESTION FOR THE COMMUNITY:
Be brutally honest: Are you TRAPPED in this "Safe Haven" lie, or are you the SMART trader who knew Gold would dump too?
Comment 'TRAPPED' if you bought the hype, or 'SMART' if you saw the structure breaking. Let's expose the market! 🫣👇
(Click the $PAXG cashtag above to trade the reality!)
#PAXG #Gold #SafeHaven #TraderPsychology #SMC
🚨 $PAXG Alert: The "Safe Haven" SCAM Exposed! Are You Trapped? 🥇🩸
Look at this 4H chart. We were all told that when crypto bleeds, Gold shines. But look at the reality.
Here is the BRUTAL MASALEDAAR TRUTH:
1️⃣ The Illusion: Retail traders rushed into Gold as a safe haven, ignoring the clear structure.
2️⃣ The Reality: The market printed a Lower High (LH), a clear CHoCH, and a brutal BOS to the downside.
3️⃣ The Trap: Now the price is sitting at $3,846, desperately trying to break above the moving average ($3,856). The trend is still bearish. Whales dumped on the "safe haven" narrative.
Are you the one who bought Gold thinking it would save you, or did you see the trap coming?
🎯 Key Battlefield Levels:
🟢 Support: $3,800 - $3,750 (The recent sweep zone)
🔴 Resistance: $3,856 (The Boss - Moving Average) & $3,900 (The broken BOS level)
👇 MASALEDAAR QUESTION FOR THE COMMUNITY:
Be brutally honest: Are you TRAPPED in this "Safe Haven" lie, or are you the SMART trader who knew Gold would dump too?
Comment 'TRAPPED' if you bought the hype, or 'SMART' if you saw the structure breaking. Let's expose the market! 🫣👇
(Click the $PAXG cashtag above to trade the reality!)
#PAXG #Gold #SafeHaven #TraderPsychology #SMC
Look at this 4H chart. We were all told that when crypto bleeds, Gold shines. But look at the reality.
Here is the BRUTAL MASALEDAAR TRUTH:
1️⃣ The Illusion: Retail traders rushed into Gold as a safe haven, ignoring the clear structure.
2️⃣ The Reality: The market printed a Lower High (LH), a clear CHoCH, and a brutal BOS to the downside.
3️⃣ The Trap: Now the price is sitting at $3,846, desperately trying to break above the moving average ($3,856). The trend is still bearish. Whales dumped on the "safe haven" narrative.
Are you the one who bought Gold thinking it would save you, or did you see the trap coming?
🎯 Key Battlefield Levels:
🟢 Support: $3,800 - $3,750 (The recent sweep zone)
🔴 Resistance: $3,856 (The Boss - Moving Average) & $3,900 (The broken BOS level)
👇 MASALEDAAR QUESTION FOR THE COMMUNITY:
Be brutally honest: Are you TRAPPED in this "Safe Haven" lie, or are you the SMART trader who knew Gold would dump too?
Comment 'TRAPPED' if you bought the hype, or 'SMART' if you saw the structure breaking. Let's expose the market! 🫣👇
(Click the $PAXG cashtag above to trade the reality!)
#PAXG #Gold #SafeHaven #TraderPsychology #SMC
248
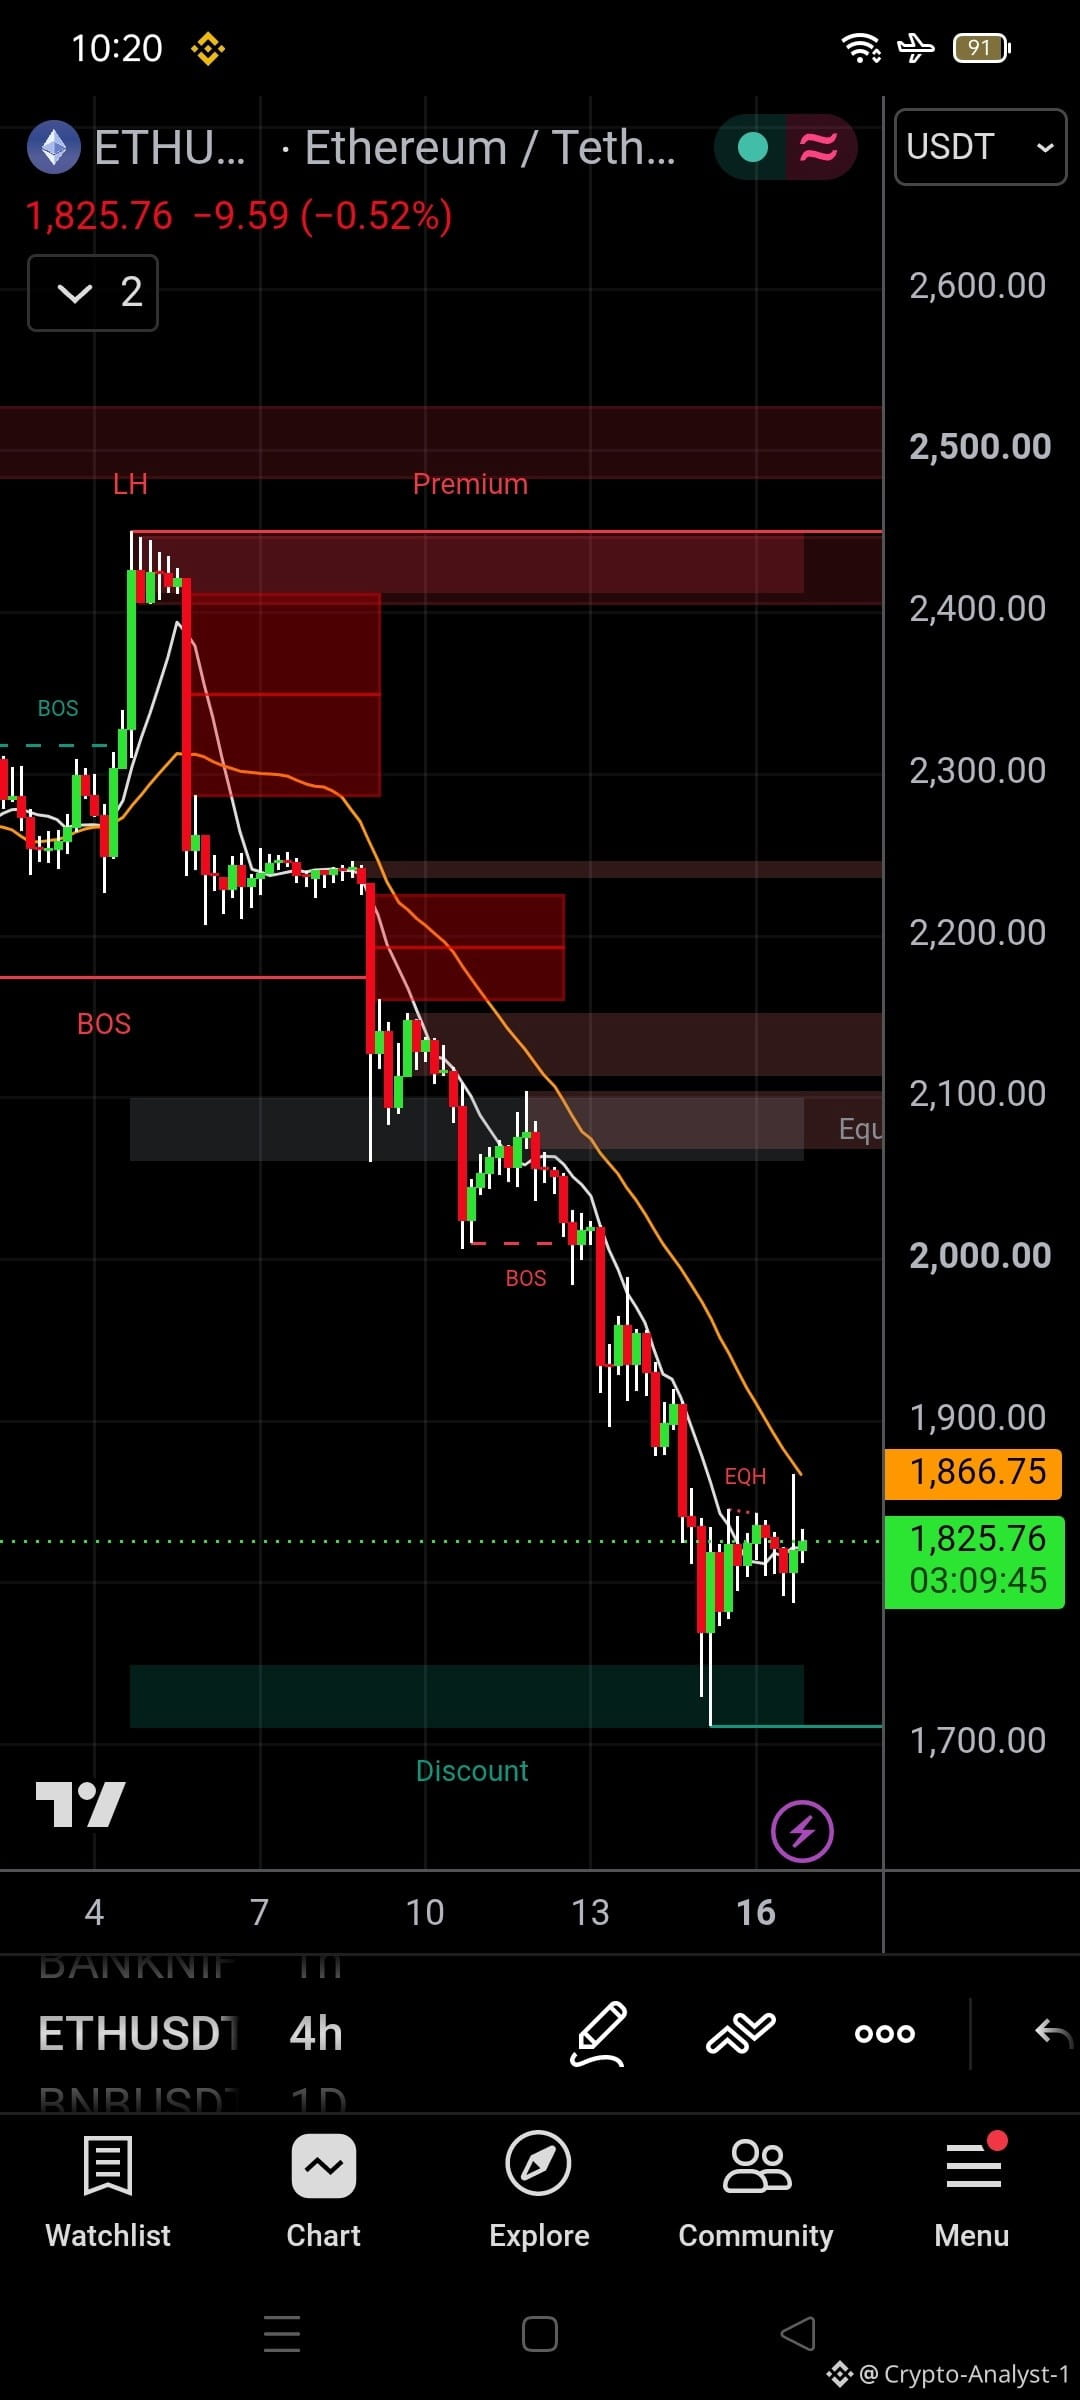
🚨 $ETH Alert: The $1,800 ILLUSION! Are You Falling For It AGAIN? 🩸🎭
Look at this 4H chart and tell me you aren't tempted to hit the buy button. After a brutal massacre down to the $1,700 graveyard, $ETH is finally showing some green candles, sitting at $1,825. Retail traders are screaming "The bottom is in!"
Here is the BRUTAL MASALEDAAR TRUTH:
1️⃣ The Bait: Look at the structure. We are still printing Lower Highs (LH).
2️⃣ The Trap: The price is forming an Equal High (EQH) right below the moving average ($1,866). This is classic Smart Money behavior—letting retail build longs so they can sweep their liquidity.
3️⃣ **The Reality:** The moving average is pressing down like a ceiling. Until we see a confirmed 4H close above $1,866, this is just a dead cat bounce.
Are you trading the reality of the chart, or are you trading your HOPE of a reversal?
🎯 Key Battlefield Levels:
🟢 Support: $1,700 - $1,750 (The graveyard wick)
🔴 Resistance: $1,866 (The Boss - Moving Average) & $2,000 (The broken BOS level)
👇 MASALEDAAR QUESTION FOR THE COMMUNITY:
Be brutally honest: Are you the FOMO trader who is buying this $1,825 trap, or the SMART trader who is waiting for a confirmed breakout above $1,866?
Comment 'TRAPPED' if you bought the dip, or 'WAITING' if you see the trap. Let's expose the market! 🫣👇
(Click the $ETH cashtag above to trade the reality!)
#ETH #Ethereum #CryptoTrading #TraderPsychology #SMC
🚨 $ETH Alert: The $1,800 ILLUSION! Are You Falling For It AGAIN? 🩸🎭
Look at this 4H chart and tell me you aren't tempted to hit the buy button. After a brutal massacre down to the $1,700 graveyard, $ETH is finally showing some green candles, sitting at $1,825. Retail traders are screaming "The bottom is in!"
Here is the BRUTAL MASALEDAAR TRUTH:
1️⃣ The Bait: Look at the structure. We are still printing Lower Highs (LH).
2️⃣ The Trap: The price is forming an Equal High (EQH) right below the moving average ($1,866). This is classic Smart Money behavior—letting retail build longs so they can sweep their liquidity.
3️⃣ **The Reality:** The moving average is pressing down like a ceiling. Until we see a confirmed 4H close above $1,866, this is just a dead cat bounce.
Are you trading the reality of the chart, or are you trading your HOPE of a reversal?
🎯 Key Battlefield Levels:
🟢 Support: $1,700 - $1,750 (The graveyard wick)
🔴 Resistance: $1,866 (The Boss - Moving Average) & $2,000 (The broken BOS level)
👇 MASALEDAAR QUESTION FOR THE COMMUNITY:
Be brutally honest: Are you the FOMO trader who is buying this $1,825 trap, or the SMART trader who is waiting for a confirmed breakout above $1,866?
Comment 'TRAPPED' if you bought the dip, or 'WAITING' if you see the trap. Let's expose the market! 🫣👇
(Click the $ETH cashtag above to trade the reality!)
#ETH #Ethereum #CryptoTrading #TraderPsychology #SMC
Look at this 4H chart and tell me you aren't tempted to hit the buy button. After a brutal massacre down to the $1,700 graveyard, $ETH is finally showing some green candles, sitting at $1,825. Retail traders are screaming "The bottom is in!"
Here is the BRUTAL MASALEDAAR TRUTH:
1️⃣ The Bait: Look at the structure. We are still printing Lower Highs (LH).
2️⃣ The Trap: The price is forming an Equal High (EQH) right below the moving average ($1,866). This is classic Smart Money behavior—letting retail build longs so they can sweep their liquidity.
3️⃣ **The Reality:** The moving average is pressing down like a ceiling. Until we see a confirmed 4H close above $1,866, this is just a dead cat bounce.
Are you trading the reality of the chart, or are you trading your HOPE of a reversal?
🎯 Key Battlefield Levels:
🟢 Support: $1,700 - $1,750 (The graveyard wick)
🔴 Resistance: $1,866 (The Boss - Moving Average) & $2,000 (The broken BOS level)
👇 MASALEDAAR QUESTION FOR THE COMMUNITY:
Be brutally honest: Are you the FOMO trader who is buying this $1,825 trap, or the SMART trader who is waiting for a confirmed breakout above $1,866?
Comment 'TRAPPED' if you bought the dip, or 'WAITING' if you see the trap. Let's expose the market! 🫣👇
(Click the $ETH cashtag above to trade the reality!)
#ETH #Ethereum #CryptoTrading #TraderPsychology #SMC
34
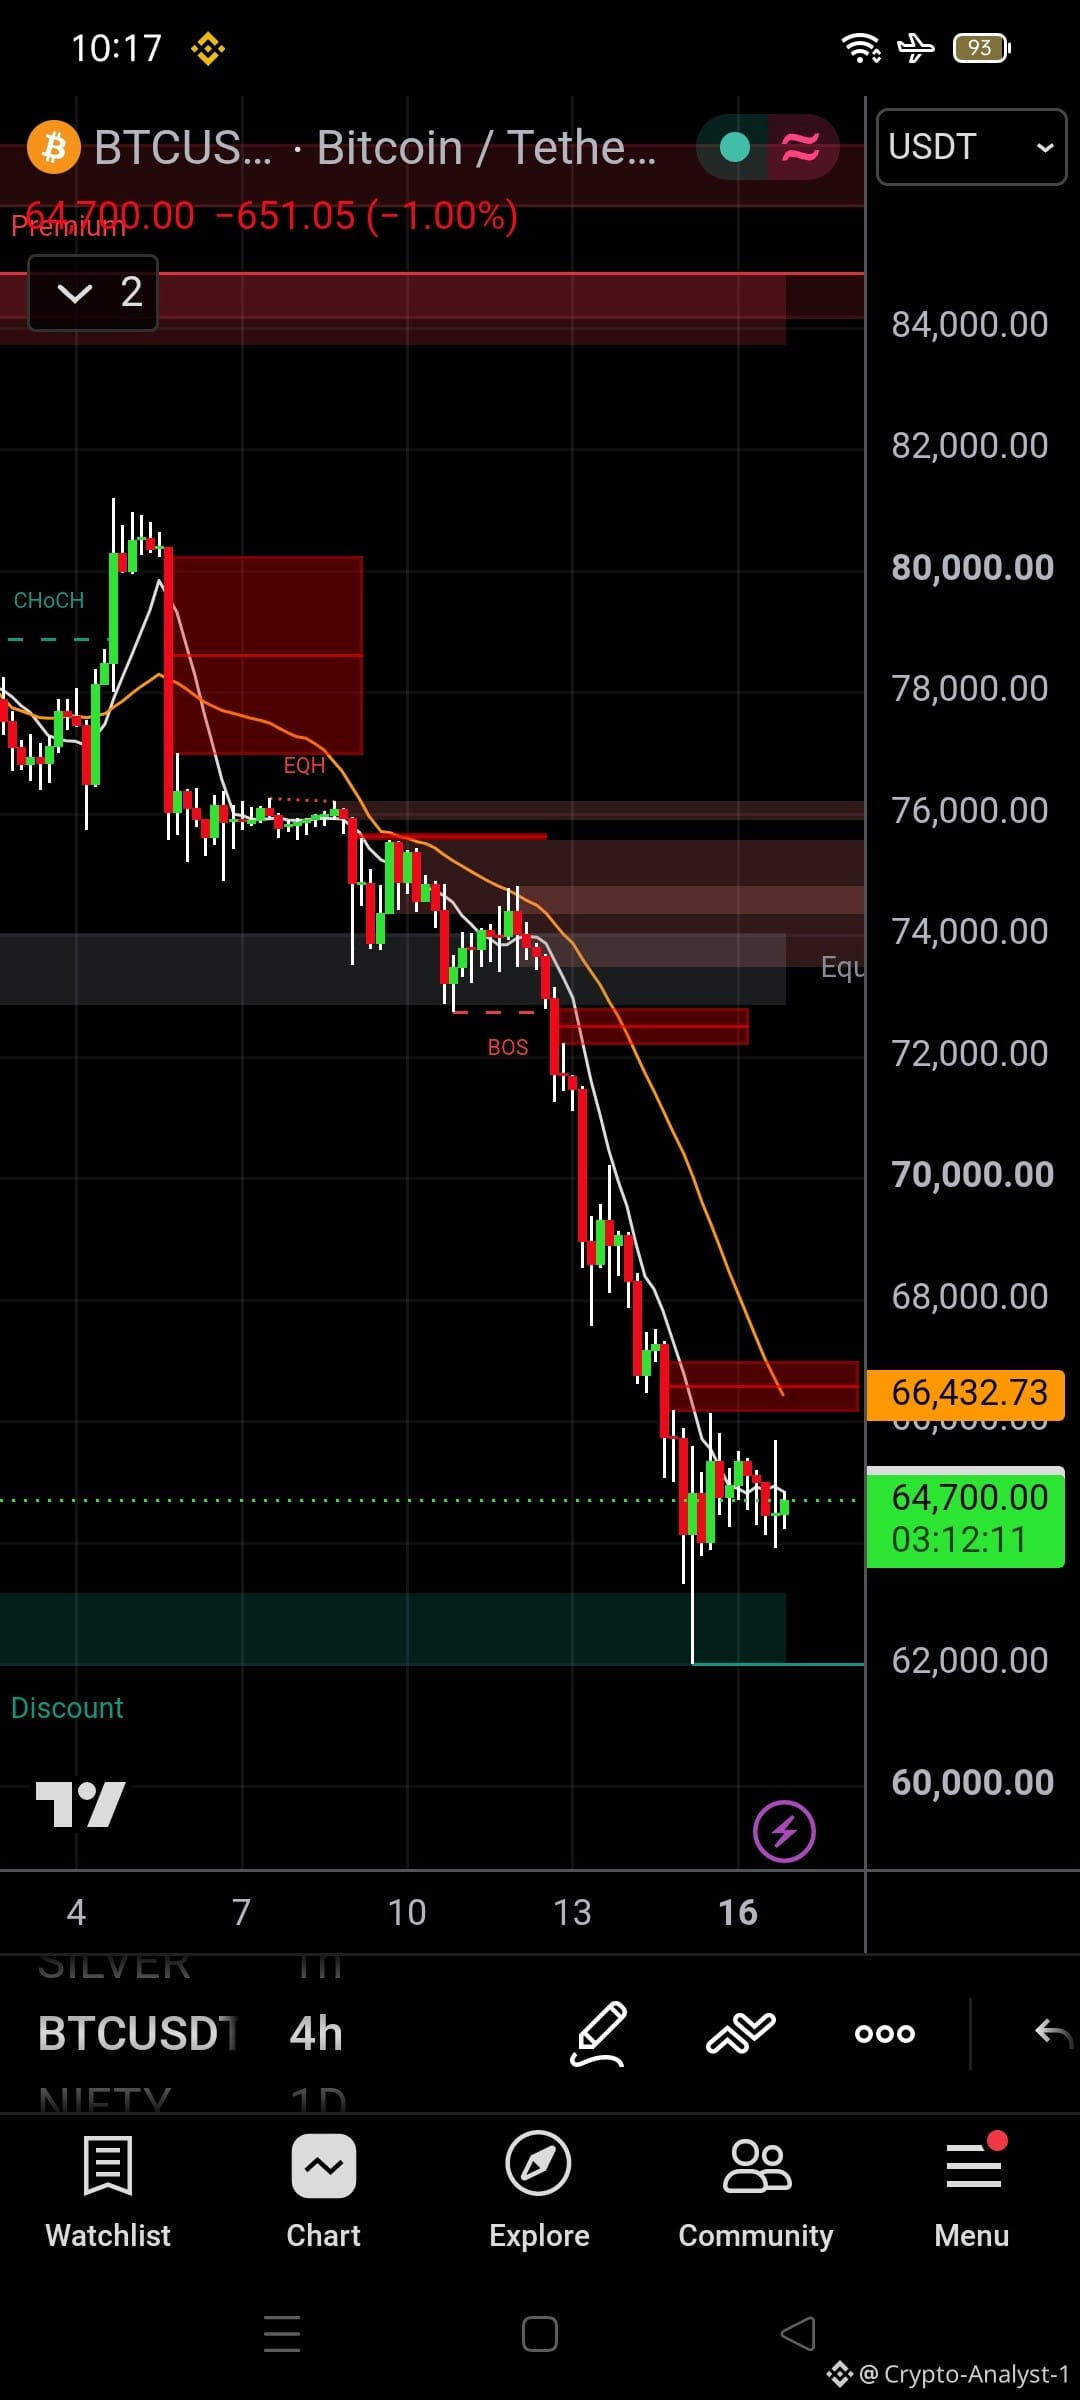
🚨 $BTC Alert: Stuck in the "Hope" Zone! Are You Trapped? 🩸🎭
Look at this 4H chart and tell me you aren't sweating. The market absolutely butchered retail traders. We had a clear CHoCH at the top, a fake EQH trap at $76K, and then a brutal BOS that nuked the price straight down to a $62,000 liquidity wick.
Right now, $BTC is hovering at $64,700, and here is the BRUTAL PSYCHOLOGY:
Retail traders who bought the top are now staring at the screen, praying for a miracle. They see a tiny green candle and think "The reversal is here!"
But look at the chart. The moving average ($66,432) is pressing down like a ceiling. The structure is still bearish.
Are you trading the reality of the chart, or are you trading your HOPE?
🎯 Key Battlefield Levels:
🟢 Support: $62,000 (The graveyard wick)
🔴 Resistance: $66,432 (The Moving Average Boss) & $72,000 (The broken BOS level)
👇 MASALEDAAR QUESTION FOR THE COMMUNITY:
Be brutally honest: Are you the BAG HOLDER who bought at $75K and is praying right now, or the SMART TRADER who is waiting for a confirmed CHoCH above $66K?
Comment 'BAG HOLDER' if you are trapped, or 'SMART TRADER' if you are playing it safe. Let's expose the truth! 🫣👇
(Click the $BTC cashtag above to trade the reality!)
#BTC #Bitcoin #CryptoTrading #TraderPsychology #SMC
🚨 $BTC Alert: Stuck in the "Hope" Zone! Are You Trapped? 🩸🎭
Look at this 4H chart and tell me you aren't sweating. The market absolutely butchered retail traders. We had a clear CHoCH at the top, a fake EQH trap at $76K, and then a brutal BOS that nuked the price straight down to a $62,000 liquidity wick.
Right now, $BTC is hovering at $64,700, and here is the BRUTAL PSYCHOLOGY:
Retail traders who bought the top are now staring at the screen, praying for a miracle. They see a tiny green candle and think "The reversal is here!"
But look at the chart. The moving average ($66,432) is pressing down like a ceiling. The structure is still bearish.
Are you trading the reality of the chart, or are you trading your HOPE?
🎯 Key Battlefield Levels:
🟢 Support: $62,000 (The graveyard wick)
🔴 Resistance: $66,432 (The Moving Average Boss) & $72,000 (The broken BOS level)
👇 MASALEDAAR QUESTION FOR THE COMMUNITY:
Be brutally honest: Are you the BAG HOLDER who bought at $75K and is praying right now, or the SMART TRADER who is waiting for a confirmed CHoCH above $66K?
Comment 'BAG HOLDER' if you are trapped, or 'SMART TRADER' if you are playing it safe. Let's expose the truth! 🫣👇
(Click the $BTC cashtag above to trade the reality!)
#BTC #Bitcoin #CryptoTrading #TraderPsychology #SMC
Look at this 4H chart and tell me you aren't sweating. The market absolutely butchered retail traders. We had a clear CHoCH at the top, a fake EQH trap at $76K, and then a brutal BOS that nuked the price straight down to a $62,000 liquidity wick.
Right now, $BTC is hovering at $64,700, and here is the BRUTAL PSYCHOLOGY:
Retail traders who bought the top are now staring at the screen, praying for a miracle. They see a tiny green candle and think "The reversal is here!"
But look at the chart. The moving average ($66,432) is pressing down like a ceiling. The structure is still bearish.
Are you trading the reality of the chart, or are you trading your HOPE?
🎯 Key Battlefield Levels:
🟢 Support: $62,000 (The graveyard wick)
🔴 Resistance: $66,432 (The Moving Average Boss) & $72,000 (The broken BOS level)
👇 MASALEDAAR QUESTION FOR THE COMMUNITY:
Be brutally honest: Are you the BAG HOLDER who bought at $75K and is praying right now, or the SMART TRADER who is waiting for a confirmed CHoCH above $66K?
Comment 'BAG HOLDER' if you are trapped, or 'SMART TRADER' if you are playing it safe. Let's expose the truth! 🫣👇
(Click the $BTC cashtag above to trade the reality!)
#BTC #Bitcoin #CryptoTrading #TraderPsychology #SMC
34

·
--
🔴 $ONDO
{future}(ONDOUSDT)
Smart Money Setup
SHORT • SMC Liquidity Sweep
▪ Entry: $0.30545
▪ Protective SL: $0.30720
▪ Downside reference: $0.30018
Position currently in profit. Watching for bearish continuation.
@SAMADSAM | Precision over prediction.
#ONDO #smc #BinanceSquare
🔴 $ONDO
Smart Money Setup
SHORT • SMC Liquidity Sweep
▪ Entry: $0.30545
▪ Protective SL: $0.30720
▪ Downside reference: $0.30018
Position currently in profit. Watching for bearish continuation.
@SAMADSAM | Precision over prediction.
#ONDO #smc #BinanceSquare
Smart Money Setup
SHORT • SMC Liquidity Sweep
▪ Entry: $0.30545
▪ Protective SL: $0.30720
▪ Downside reference: $0.30018
Position currently in profit. Watching for bearish continuation.
@SAMADSAM | Precision over prediction.
#ONDO #smc #BinanceSquare
57
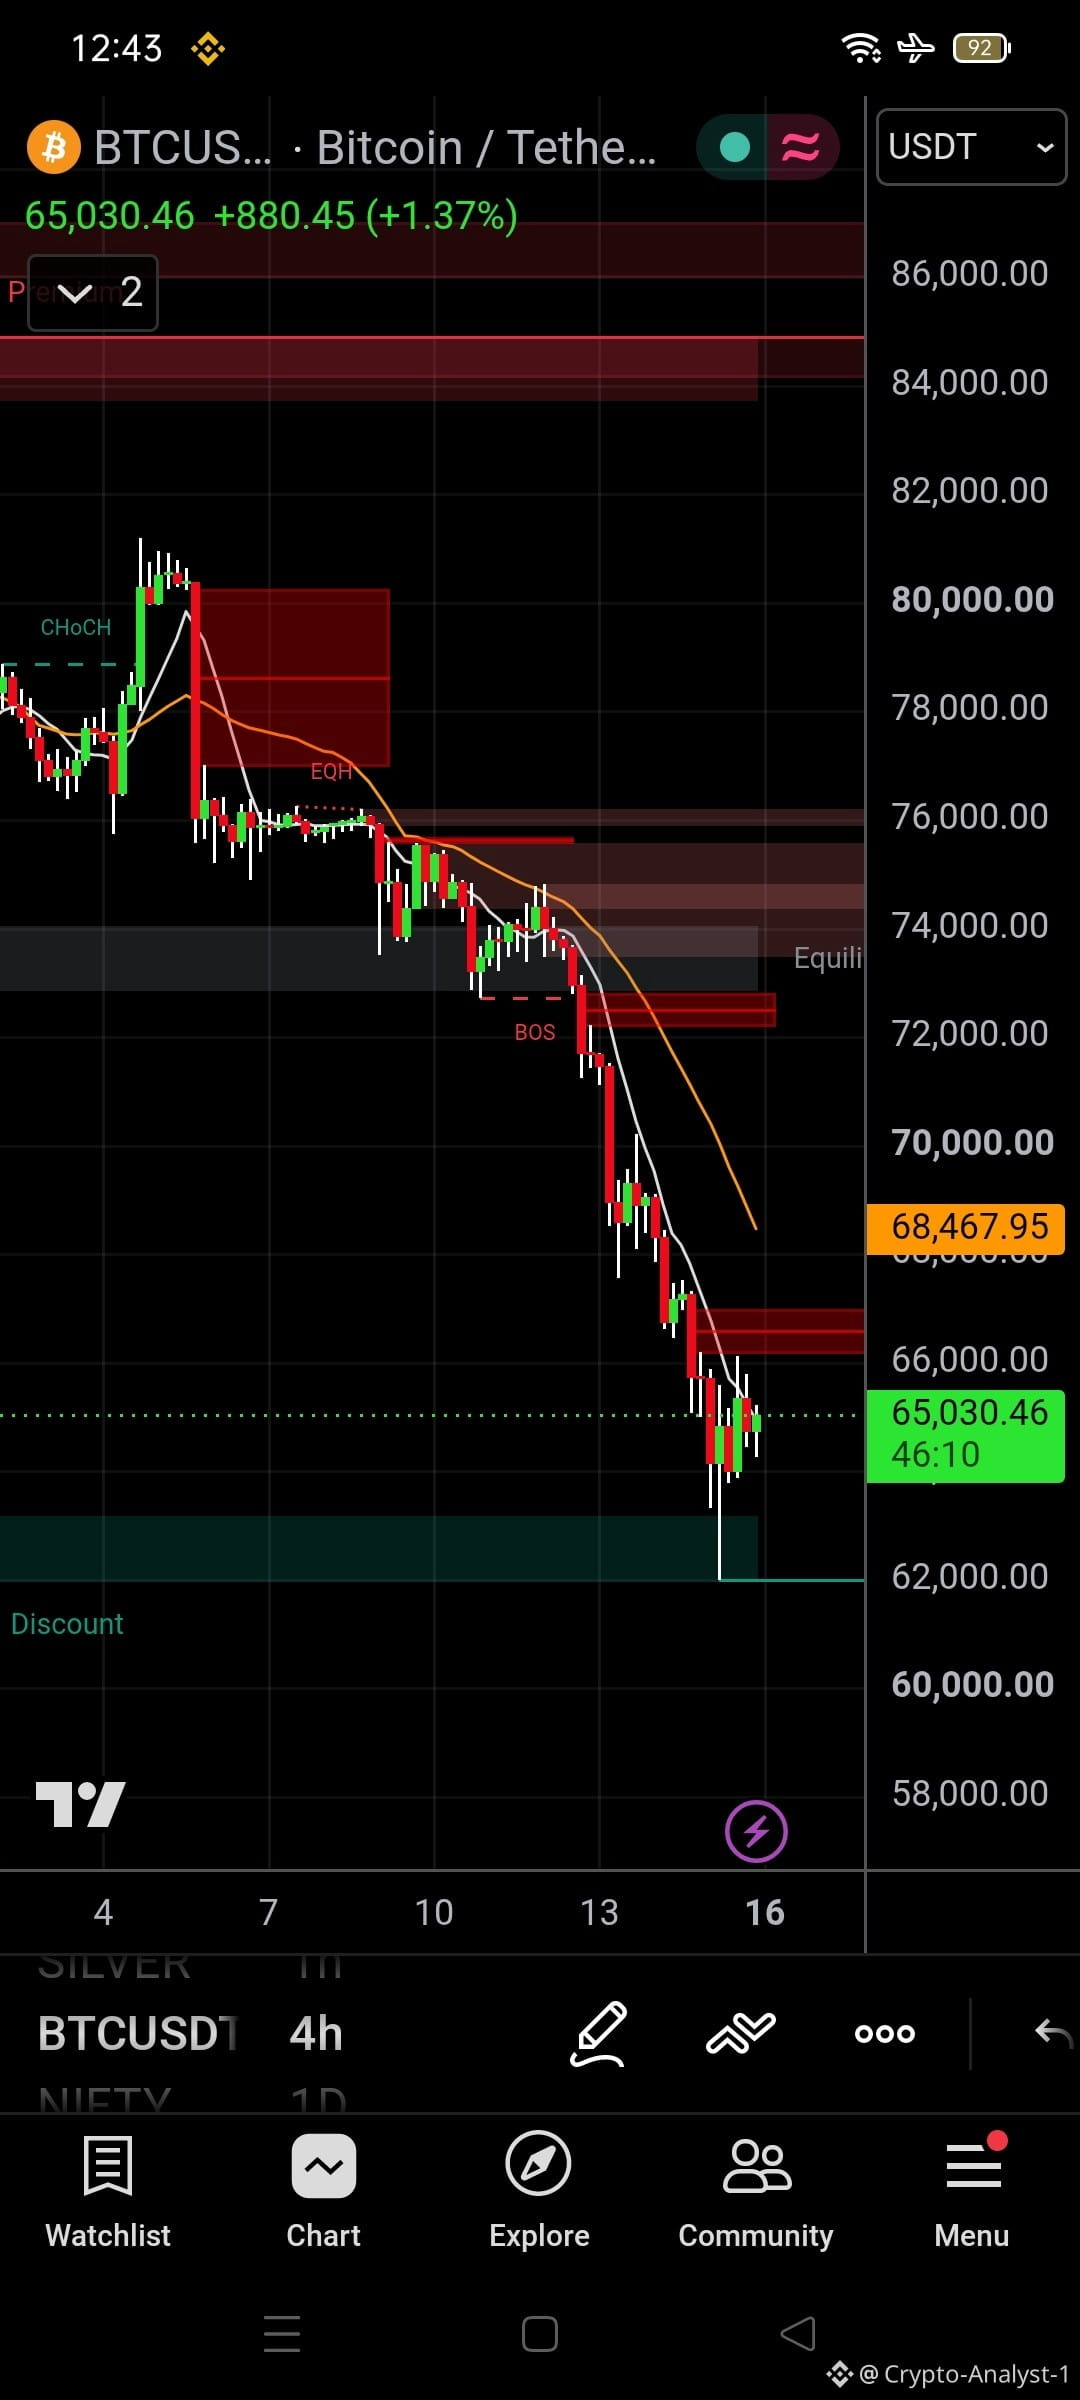
🚨 $BTC Alert: The Ultimate Trap! Dead Cat Bounce or Real Revenge? 🩸🍿
Look at this 4H chart and tell me you aren’t sweating. Just a few hours ago, the market was in absolute panic. Now, a sudden +1.37% green candle at $65,030, and suddenly everyone on Crypto Twitter is a genius again screaming "Bottom is in!"
Here is the BRUTAL MASALEDAAR TRUTH:
1️⃣ The Bait: The EQH at $76K was the perfect trap. Retail bought the "support".
2️⃣ **The Trap Door:** The BOS below $72K triggered pure hell.
3️⃣ The Liquidation Wick: That massive wick down to $62K? That was the final purge. Whales wiped out the weak hands and scooped up their blood.
But look at the moving average at $68,467. We are still trapped underneath it! This tiny bounce is exactly what Smart Money wants—to make you FOMO back in before they slam it down again.
Are you brave enough to catch this falling knife, or smart enough to wait for the structure to actually flip?
🎯 Key Battlefield Levels:
🟢 Support: $62,000 (The graveyard wick)
🔴 Resistance: $66,000 (Local supply) & $68,467 (The ultimate boss - Moving Average)
👇 MASALEDAAR QUESTION FOR THE COMMUNITY:
Be brutally honest: Are you the CHAD who bought the $62K wick, or the CLOWN who is buying this $65K bounce out of FOMO?
Comment 'CHAD' if you caught the bottom, or 'CLOWN' if you are about to get trapped again. Let's expose the market! 🫣👇
(Click the $BTC cashtag above to trade the drama!)
#BTC #Bitcoin #CryptoTrading #TraderPsychology #SMC
🚨 $BTC Alert: The Ultimate Trap! Dead Cat Bounce or Real Revenge? 🩸🍿
Look at this 4H chart and tell me you aren’t sweating. Just a few hours ago, the market was in absolute panic. Now, a sudden +1.37% green candle at $65,030, and suddenly everyone on Crypto Twitter is a genius again screaming "Bottom is in!"
Here is the BRUTAL MASALEDAAR TRUTH:
1️⃣ The Bait: The EQH at $76K was the perfect trap. Retail bought the "support".
2️⃣ **The Trap Door:** The BOS below $72K triggered pure hell.
3️⃣ The Liquidation Wick: That massive wick down to $62K? That was the final purge. Whales wiped out the weak hands and scooped up their blood.
But look at the moving average at $68,467. We are still trapped underneath it! This tiny bounce is exactly what Smart Money wants—to make you FOMO back in before they slam it down again.
Are you brave enough to catch this falling knife, or smart enough to wait for the structure to actually flip?
🎯 Key Battlefield Levels:
🟢 Support: $62,000 (The graveyard wick)
🔴 Resistance: $66,000 (Local supply) & $68,467 (The ultimate boss - Moving Average)
👇 MASALEDAAR QUESTION FOR THE COMMUNITY:
Be brutally honest: Are you the CHAD who bought the $62K wick, or the CLOWN who is buying this $65K bounce out of FOMO?
Comment 'CHAD' if you caught the bottom, or 'CLOWN' if you are about to get trapped again. Let's expose the market! 🫣👇
(Click the $BTC cashtag above to trade the drama!)
#BTC #Bitcoin #CryptoTrading #TraderPsychology #SMC
Look at this 4H chart and tell me you aren’t sweating. Just a few hours ago, the market was in absolute panic. Now, a sudden +1.37% green candle at $65,030, and suddenly everyone on Crypto Twitter is a genius again screaming "Bottom is in!"
Here is the BRUTAL MASALEDAAR TRUTH:
1️⃣ The Bait: The EQH at $76K was the perfect trap. Retail bought the "support".
2️⃣ **The Trap Door:** The BOS below $72K triggered pure hell.
3️⃣ The Liquidation Wick: That massive wick down to $62K? That was the final purge. Whales wiped out the weak hands and scooped up their blood.
But look at the moving average at $68,467. We are still trapped underneath it! This tiny bounce is exactly what Smart Money wants—to make you FOMO back in before they slam it down again.
Are you brave enough to catch this falling knife, or smart enough to wait for the structure to actually flip?
🎯 Key Battlefield Levels:
🟢 Support: $62,000 (The graveyard wick)
🔴 Resistance: $66,000 (Local supply) & $68,467 (The ultimate boss - Moving Average)
👇 MASALEDAAR QUESTION FOR THE COMMUNITY:
Be brutally honest: Are you the CHAD who bought the $62K wick, or the CLOWN who is buying this $65K bounce out of FOMO?
Comment 'CHAD' if you caught the bottom, or 'CLOWN' if you are about to get trapped again. Let's expose the market! 🫣👇
(Click the $BTC cashtag above to trade the drama!)
#BTC #Bitcoin #CryptoTrading #TraderPsychology #SMC
106

·
--
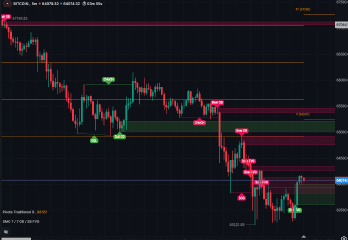
📉 BTC: The 66,100 Rejection Played Out Perfectly — What Now? 🔍
Last night Bitcoin swept liquidity above the Bearish OB at 66,140 — and got rejected instantly. 🎯
That single rejection kicked off a textbook SMC move:
🔴 66,140 — liquidity sweep + rejection (the trap for late buyers)
🔻 Break of structure → 65,850 → 65,450 — FVG after FVG got filled
📉 Final flush into 63,221 — right into the Daily S3 Pivot
Where are we now?
Price is bouncing from a fresh demand stack: Bullish OB + S3 Pivot + Bullish FVG around 63,600–63,800. 📊
The map for today:
🟢 Short-term: Scalp long zone → 63,600–63,800 (invalid below 63,150)
🔴 The real opportunity: Short the rally into 64,800–65,250 — that's Bearish OB + Bearish FVG + Daily Pivot P stacked in one zone. Rejection there = high-probability continuation short toward 63,200 and lower.
The trend on the 1H is still bearish — this bounce is a pullback, not a reversal. Sell the premium, don't chase the discount. 🧠
What's your plan today — bounce play or waiting for the supply zone? 👇
#BTC #Crypto #TechnicalAnalysis #SMC
📉 BTC: The 66,100 Rejection Played Out Perfectly — What Now? 🔍
Last night Bitcoin swept liquidity above the Bearish OB at 66,140 — and got rejected instantly. 🎯
That single rejection kicked off a textbook SMC move:
🔴 66,140 — liquidity sweep + rejection (the trap for late buyers)
🔻 Break of structure → 65,850 → 65,450 — FVG after FVG got filled
📉 Final flush into 63,221 — right into the Daily S3 Pivot
Where are we now?
Price is bouncing from a fresh demand stack: Bullish OB + S3 Pivot + Bullish FVG around 63,600–63,800. 📊
The map for today:
🟢 Short-term: Scalp long zone → 63,600–63,800 (invalid below 63,150)
🔴 The real opportunity: Short the rally into 64,800–65,250 — that's Bearish OB + Bearish FVG + Daily Pivot P stacked in one zone. Rejection there = high-probability continuation short toward 63,200 and lower.
The trend on the 1H is still bearish — this bounce is a pullback, not a reversal. Sell the premium, don't chase the discount. 🧠
What's your plan today — bounce play or waiting for the supply zone? 👇
#BTC #Crypto #TechnicalAnalysis #SMC
Last night Bitcoin swept liquidity above the Bearish OB at 66,140 — and got rejected instantly. 🎯
That single rejection kicked off a textbook SMC move:
🔴 66,140 — liquidity sweep + rejection (the trap for late buyers)
🔻 Break of structure → 65,850 → 65,450 — FVG after FVG got filled
📉 Final flush into 63,221 — right into the Daily S3 Pivot
Where are we now?
Price is bouncing from a fresh demand stack: Bullish OB + S3 Pivot + Bullish FVG around 63,600–63,800. 📊
The map for today:
🟢 Short-term: Scalp long zone → 63,600–63,800 (invalid below 63,150)
🔴 The real opportunity: Short the rally into 64,800–65,250 — that's Bearish OB + Bearish FVG + Daily Pivot P stacked in one zone. Rejection there = high-probability continuation short toward 63,200 and lower.
The trend on the 1H is still bearish — this bounce is a pullback, not a reversal. Sell the premium, don't chase the discount. 🧠
What's your plan today — bounce play or waiting for the supply zone? 👇
#BTC #Crypto #TechnicalAnalysis #SMC
1
291
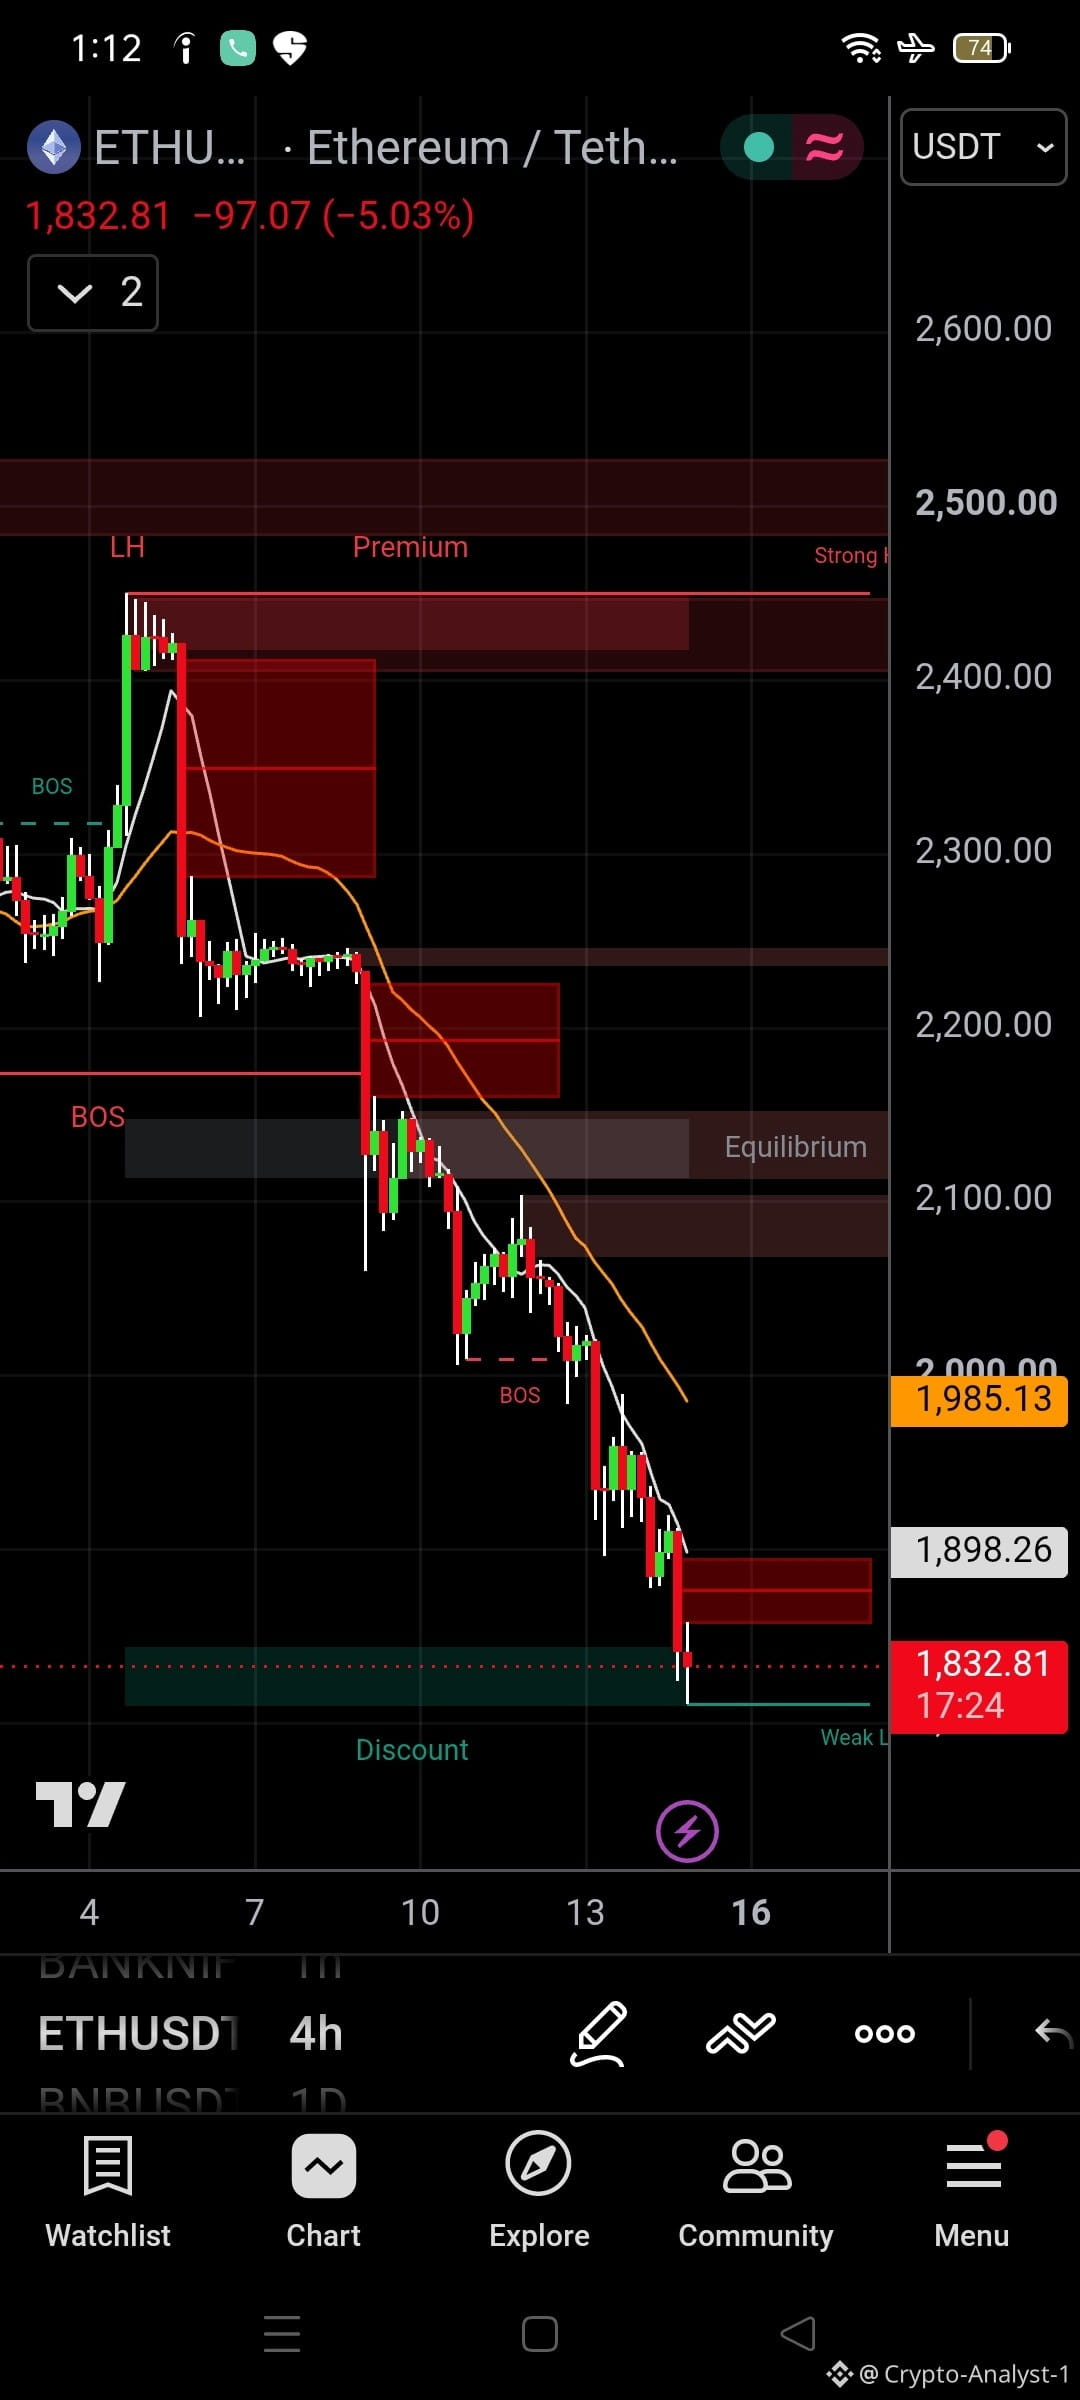
🚨 $ETH Alert: The Most DRAMATIC Breakup Ever! $1,800 Zone! 💔🩸
Look at this 4H chart. It’s a love story gone terribly wrong.
We thought we found the perfect one when it pumped to $2,400. Then came the Lower High (LH)—the fake "I've changed" text. And then, a brutal BOS (Break of Structure) over and over again, completely shattering our portfolio's heart.
Now, $ETH is sitting at $1,832 (-5%), crying alone in the deep discount zone at a "Weak Low." The moving averages are just staring down at us like a disappointed ex who warned us this would happen.
Here is the SMC PSYCHOLOGY:
While we are crying over this bloody candle, the whales are throwing a party. They love dramatic breakups because they get to buy our tears (liquidity) at a massive discount.
Are you still holding on to this toxic relationship, or are you finally letting go? 🥀
🎯 Key Battlefield Levels:
🟢 Support: $1,800 - $1,820 (The absolute rock bottom of this relationship)
🔴 Resistance: $1,898 (The ex you can't get over) & $1,985 (The moving average)
👇 ROMANTIC QUESTION FOR YOU:
Are you HEARTBROKEN (liquidated/stopped out), or are you STILL IN LOVE (buying this massive dip)?
Comment 'HEARTBROKEN' if the market broke you, or 'IN LOVE' if you are still holding the bags and hoping for a rebound. Let's cry together! 🥀👇
(Click the $ETH cashtag above to trade this dramatic market!)
#ETH #Ethereum #CryptoTrading #TraderPsychology #SMC
🚨 $ETH Alert: The Most DRAMATIC Breakup Ever! $1,800 Zone! 💔🩸
Look at this 4H chart. It’s a love story gone terribly wrong.
We thought we found the perfect one when it pumped to $2,400. Then came the Lower High (LH)—the fake "I've changed" text. And then, a brutal BOS (Break of Structure) over and over again, completely shattering our portfolio's heart.
Now, $ETH is sitting at $1,832 (-5%), crying alone in the deep discount zone at a "Weak Low." The moving averages are just staring down at us like a disappointed ex who warned us this would happen.
Here is the SMC PSYCHOLOGY:
While we are crying over this bloody candle, the whales are throwing a party. They love dramatic breakups because they get to buy our tears (liquidity) at a massive discount.
Are you still holding on to this toxic relationship, or are you finally letting go? 🥀
🎯 Key Battlefield Levels:
🟢 Support: $1,800 - $1,820 (The absolute rock bottom of this relationship)
🔴 Resistance: $1,898 (The ex you can't get over) & $1,985 (The moving average)
👇 ROMANTIC QUESTION FOR YOU:
Are you HEARTBROKEN (liquidated/stopped out), or are you STILL IN LOVE (buying this massive dip)?
Comment 'HEARTBROKEN' if the market broke you, or 'IN LOVE' if you are still holding the bags and hoping for a rebound. Let's cry together! 🥀👇
(Click the $ETH cashtag above to trade this dramatic market!)
#ETH #Ethereum #CryptoTrading #TraderPsychology #SMC
Look at this 4H chart. It’s a love story gone terribly wrong.
We thought we found the perfect one when it pumped to $2,400. Then came the Lower High (LH)—the fake "I've changed" text. And then, a brutal BOS (Break of Structure) over and over again, completely shattering our portfolio's heart.
Now, $ETH is sitting at $1,832 (-5%), crying alone in the deep discount zone at a "Weak Low." The moving averages are just staring down at us like a disappointed ex who warned us this would happen.
Here is the SMC PSYCHOLOGY:
While we are crying over this bloody candle, the whales are throwing a party. They love dramatic breakups because they get to buy our tears (liquidity) at a massive discount.
Are you still holding on to this toxic relationship, or are you finally letting go? 🥀
🎯 Key Battlefield Levels:
🟢 Support: $1,800 - $1,820 (The absolute rock bottom of this relationship)
🔴 Resistance: $1,898 (The ex you can't get over) & $1,985 (The moving average)
👇 ROMANTIC QUESTION FOR YOU:
Are you HEARTBROKEN (liquidated/stopped out), or are you STILL IN LOVE (buying this massive dip)?
Comment 'HEARTBROKEN' if the market broke you, or 'IN LOVE' if you are still holding the bags and hoping for a rebound. Let's cry together! 🥀👇
(Click the $ETH cashtag above to trade this dramatic market!)
#ETH #Ethereum #CryptoTrading #TraderPsychology #SMC
51
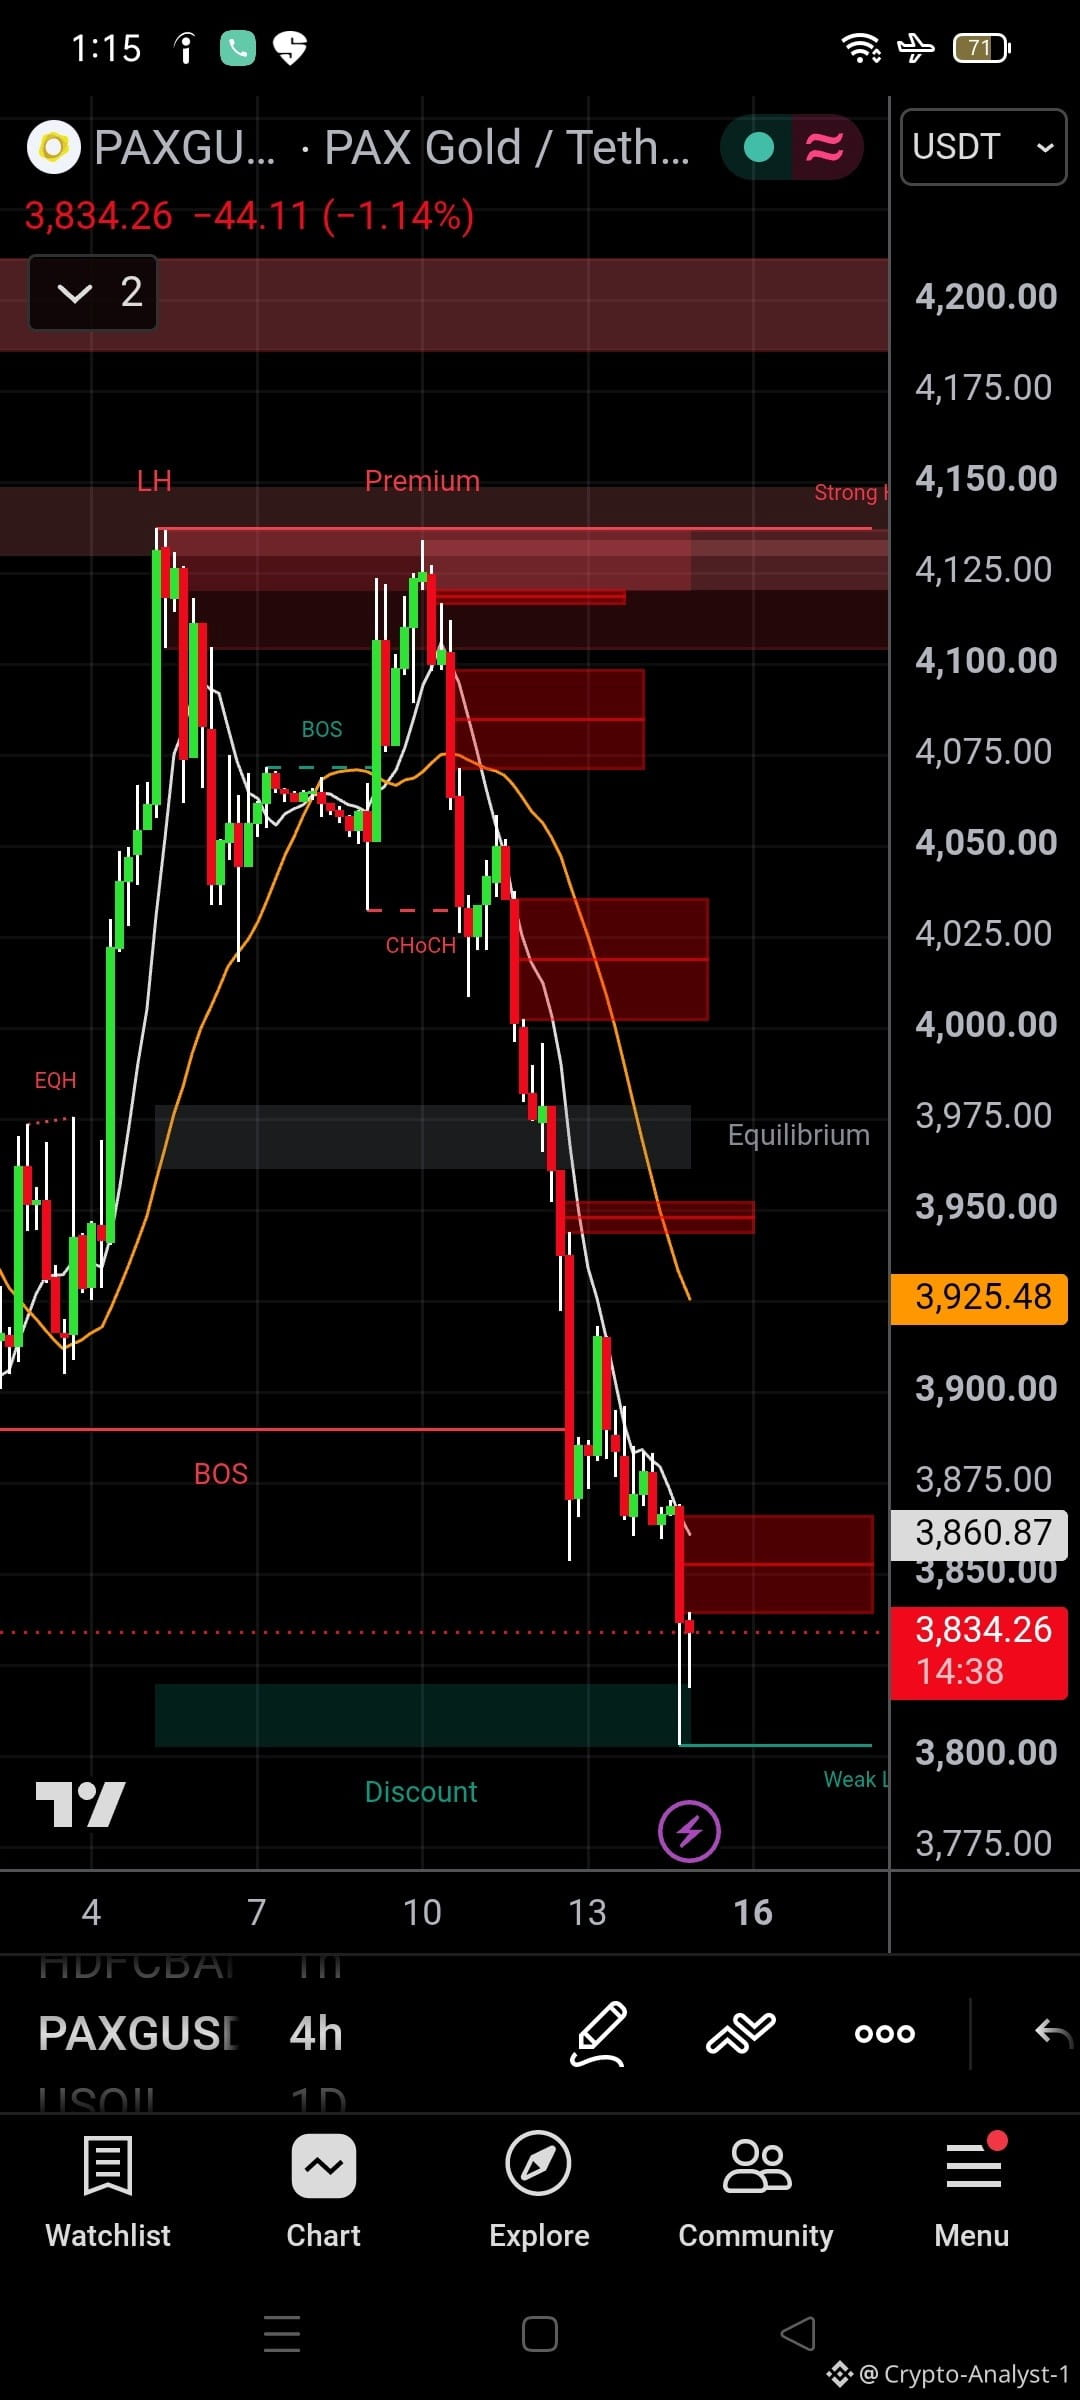
🚨 $PAXG Alert: The "Safe Haven" BETRAYAL! Even Gold Broke Our Hearts! 💔🥇🩸
Look at this 4H chart. We all thought Gold was the loyal partner who would protect us during the crypto crash. But look at the reality.
Here is the BRUTAL ROMANTIC TRUTH:
We fell for its charm at $4,120. Then it showed us a **Lower High (LH)**—the classic fake promises. And then came the **CHoCH** and a brutal **BOS (Break of Structure)** below $3,900. It didn't just leave us; it took our money with it.
Now, $PAXG is sitting at $3,834 (-1.14%), crying alone at a "Weak Low" in the deep discount zone. The moving averages are staring down at us, mocking us for trusting a "Safe Haven."
The psychology? Pure betrayal. Retail traders ran to Gold for safety, and the whales dumped on them anyway. Because in the end, whales don't care about "safe havens"—they only care about liquidity.
Are you feeling BETRAYED and selling your Gold, or are you STILL IN LOVE and buying this discount? 🥀
🎯 Key Battlefield Levels:
🟢 Support: $3,800 (The absolute rock bottom of this relationship)
🔴 Resistance: $3,860 (The ex you can't get over) & $3,925 (The moving average)
👇 ROMANTIC QUESTION FOR YOU:
Are you HEARTBROKEN (trapped in Gold) or are you STILL IN LOVE (buying this dip)?
Comment 'BETRAYED' if Gold broke your heart, or 'STILL IN LOVE' if you are holding the bags and hoping for a rebound. Let's cry together! 🥀👇
(Click the $PAXG cashtag above to trade this dramatic market!)
#PAXG #Gold #SafeHaven #TraderPsychology #SMC
🚨 $PAXG Alert: The "Safe Haven" BETRAYAL! Even Gold Broke Our Hearts! 💔🥇🩸
Look at this 4H chart. We all thought Gold was the loyal partner who would protect us during the crypto crash. But look at the reality.
Here is the BRUTAL ROMANTIC TRUTH:
We fell for its charm at $4,120. Then it showed us a **Lower High (LH)**—the classic fake promises. And then came the **CHoCH** and a brutal **BOS (Break of Structure)** below $3,900. It didn't just leave us; it took our money with it.
Now, $PAXG is sitting at $3,834 (-1.14%), crying alone at a "Weak Low" in the deep discount zone. The moving averages are staring down at us, mocking us for trusting a "Safe Haven."
The psychology? Pure betrayal. Retail traders ran to Gold for safety, and the whales dumped on them anyway. Because in the end, whales don't care about "safe havens"—they only care about liquidity.
Are you feeling BETRAYED and selling your Gold, or are you STILL IN LOVE and buying this discount? 🥀
🎯 Key Battlefield Levels:
🟢 Support: $3,800 (The absolute rock bottom of this relationship)
🔴 Resistance: $3,860 (The ex you can't get over) & $3,925 (The moving average)
👇 ROMANTIC QUESTION FOR YOU:
Are you HEARTBROKEN (trapped in Gold) or are you STILL IN LOVE (buying this dip)?
Comment 'BETRAYED' if Gold broke your heart, or 'STILL IN LOVE' if you are holding the bags and hoping for a rebound. Let's cry together! 🥀👇
(Click the $PAXG cashtag above to trade this dramatic market!)
#PAXG #Gold #SafeHaven #TraderPsychology #SMC
Look at this 4H chart. We all thought Gold was the loyal partner who would protect us during the crypto crash. But look at the reality.
Here is the BRUTAL ROMANTIC TRUTH:
We fell for its charm at $4,120. Then it showed us a **Lower High (LH)**—the classic fake promises. And then came the **CHoCH** and a brutal **BOS (Break of Structure)** below $3,900. It didn't just leave us; it took our money with it.
Now, $PAXG is sitting at $3,834 (-1.14%), crying alone at a "Weak Low" in the deep discount zone. The moving averages are staring down at us, mocking us for trusting a "Safe Haven."
The psychology? Pure betrayal. Retail traders ran to Gold for safety, and the whales dumped on them anyway. Because in the end, whales don't care about "safe havens"—they only care about liquidity.
Are you feeling BETRAYED and selling your Gold, or are you STILL IN LOVE and buying this discount? 🥀
🎯 Key Battlefield Levels:
🟢 Support: $3,800 (The absolute rock bottom of this relationship)
🔴 Resistance: $3,860 (The ex you can't get over) & $3,925 (The moving average)
👇 ROMANTIC QUESTION FOR YOU:
Are you HEARTBROKEN (trapped in Gold) or are you STILL IN LOVE (buying this dip)?
Comment 'BETRAYED' if Gold broke your heart, or 'STILL IN LOVE' if you are holding the bags and hoping for a rebound. Let's cry together! 🥀👇
(Click the $PAXG cashtag above to trade this dramatic market!)
#PAXG #Gold #SafeHaven #TraderPsychology #SMC
482
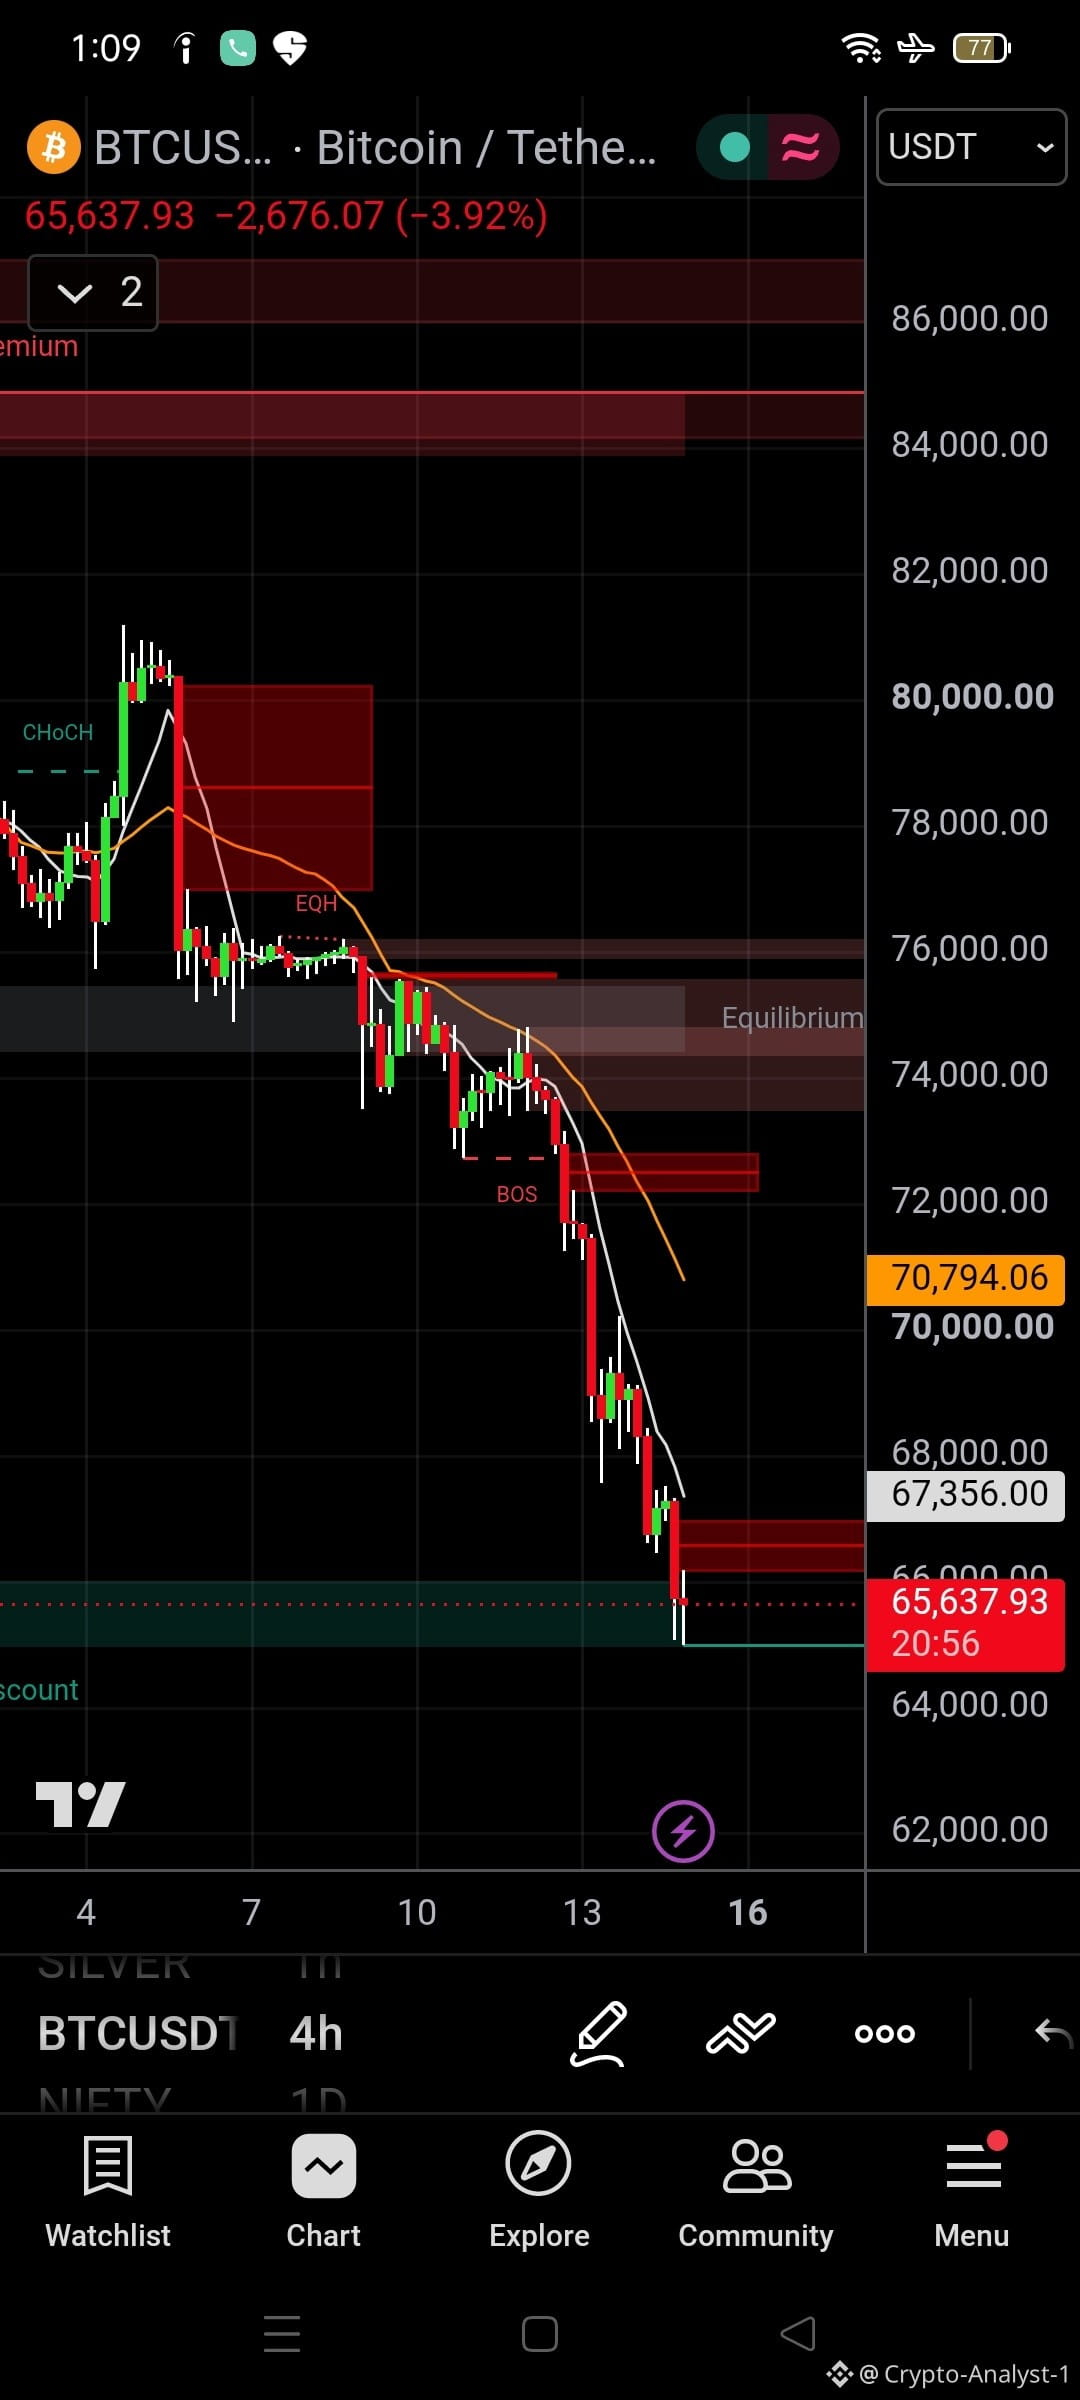
🚨 $BTC Alert: The Most TOXIC Breakup in Crypto History! 💔🩸
Look at this 4H chart. It's not just a crash; it's a classic toxic relationship we all know too well.
Here is the BRUTAL TRUTH:
We fell in love with the bull run at the top. Then came the CHoCH—the first red flag we ignored. The market sweet-talked us at $76K with an **EQH trap**, making us believe it would go to $100K.
And then? A brutal BOS below $72K. It broke our hearts, our accounts, and dumped us straight into the deep discount zone at $65,637.
Now we are sitting here, staring at a tiny green candle, hoping it will change. But the moving averages are just staring down at us like a disappointed ex. 💔📉
It hurts. But this is exactly where Smart Money steps in to wipe our tears and buy the liquidation blood.
Are you still holding on to this toxic relationship, or are you finally letting go? 🥀
🎯 Key Battlefield Levels:
🟢 Support: $65,000 (The rock bottom of this relationship)
🔴 Resistance: $67,356 (The ex you can't get over) & $70,794 (The moving average)
👇 ROMANTIC QUESTION FOR YOU:
Are you HEARTBROKEN (stopped out/liquidated), or are you STILL IN LOVE (buying this massive dip)?
Comment 'HEARTBROKEN' if the market broke you, or 'IN LOVE' if you are still holding the bags. Let's cry together! 🥀👇
(Click the $BTC cashtag to trade this toxic market!)
#BTC #Bitcoin #CryptoTrading #TraderPsychology #SMC
🚨 $BTC Alert: The Most TOXIC Breakup in Crypto History! 💔🩸
Look at this 4H chart. It's not just a crash; it's a classic toxic relationship we all know too well.
Here is the BRUTAL TRUTH:
We fell in love with the bull run at the top. Then came the CHoCH—the first red flag we ignored. The market sweet-talked us at $76K with an **EQH trap**, making us believe it would go to $100K.
And then? A brutal BOS below $72K. It broke our hearts, our accounts, and dumped us straight into the deep discount zone at $65,637.
Now we are sitting here, staring at a tiny green candle, hoping it will change. But the moving averages are just staring down at us like a disappointed ex. 💔📉
It hurts. But this is exactly where Smart Money steps in to wipe our tears and buy the liquidation blood.
Are you still holding on to this toxic relationship, or are you finally letting go? 🥀
🎯 Key Battlefield Levels:
🟢 Support: $65,000 (The rock bottom of this relationship)
🔴 Resistance: $67,356 (The ex you can't get over) & $70,794 (The moving average)
👇 ROMANTIC QUESTION FOR YOU:
Are you HEARTBROKEN (stopped out/liquidated), or are you STILL IN LOVE (buying this massive dip)?
Comment 'HEARTBROKEN' if the market broke you, or 'IN LOVE' if you are still holding the bags. Let's cry together! 🥀👇
(Click the $BTC cashtag to trade this toxic market!)
#BTC #Bitcoin #CryptoTrading #TraderPsychology #SMC
Look at this 4H chart. It's not just a crash; it's a classic toxic relationship we all know too well.
Here is the BRUTAL TRUTH:
We fell in love with the bull run at the top. Then came the CHoCH—the first red flag we ignored. The market sweet-talked us at $76K with an **EQH trap**, making us believe it would go to $100K.
And then? A brutal BOS below $72K. It broke our hearts, our accounts, and dumped us straight into the deep discount zone at $65,637.
Now we are sitting here, staring at a tiny green candle, hoping it will change. But the moving averages are just staring down at us like a disappointed ex. 💔📉
It hurts. But this is exactly where Smart Money steps in to wipe our tears and buy the liquidation blood.
Are you still holding on to this toxic relationship, or are you finally letting go? 🥀
🎯 Key Battlefield Levels:
🟢 Support: $65,000 (The rock bottom of this relationship)
🔴 Resistance: $67,356 (The ex you can't get over) & $70,794 (The moving average)
👇 ROMANTIC QUESTION FOR YOU:
Are you HEARTBROKEN (stopped out/liquidated), or are you STILL IN LOVE (buying this massive dip)?
Comment 'HEARTBROKEN' if the market broke you, or 'IN LOVE' if you are still holding the bags. Let's cry together! 🥀👇
(Click the $BTC cashtag to trade this toxic market!)
#BTC #Bitcoin #CryptoTrading #TraderPsychology #SMC
75

·
--
⚡ $SKHY flips bearish, structure breaks
SHORT · 5M
Entry: $128.84 - $128.95
TP1: $128.1
TP2: $127.25
TP3: $126.09
SL: $129.8
BOS confirms the trend on the 5M and HTF bias is bearish. OB and FVG are stacked in the $128.84-129.14 zone, selling from premium inside the OTE pocket with strong displacement and volume expansion. Target is $126.09; stop at $129.8.
#SKHY #SMC · NFA
⚡ $SKHY flips bearish, structure breaks
SHORT · 5M
Entry: $128.84 - $128.95
TP1: $128.1
TP2: $127.25
TP3: $126.09
SL: $129.8
BOS confirms the trend on the 5M and HTF bias is bearish. OB and FVG are stacked in the $128.84-129.14 zone, selling from premium inside the OTE pocket with strong displacement and volume expansion. Target is $126.09; stop at $129.8.
#SKHY #SMC · NFA
SHORT · 5M
Entry: $128.84 - $128.95
TP1: $128.1
TP2: $127.25
TP3: $126.09
SL: $129.8
BOS confirms the trend on the 5M and HTF bias is bearish. OB and FVG are stacked in the $128.84-129.14 zone, selling from premium inside the OTE pocket with strong displacement and volume expansion. Target is $126.09; stop at $129.8.
#SKHY #SMC · NFA
104
·
--
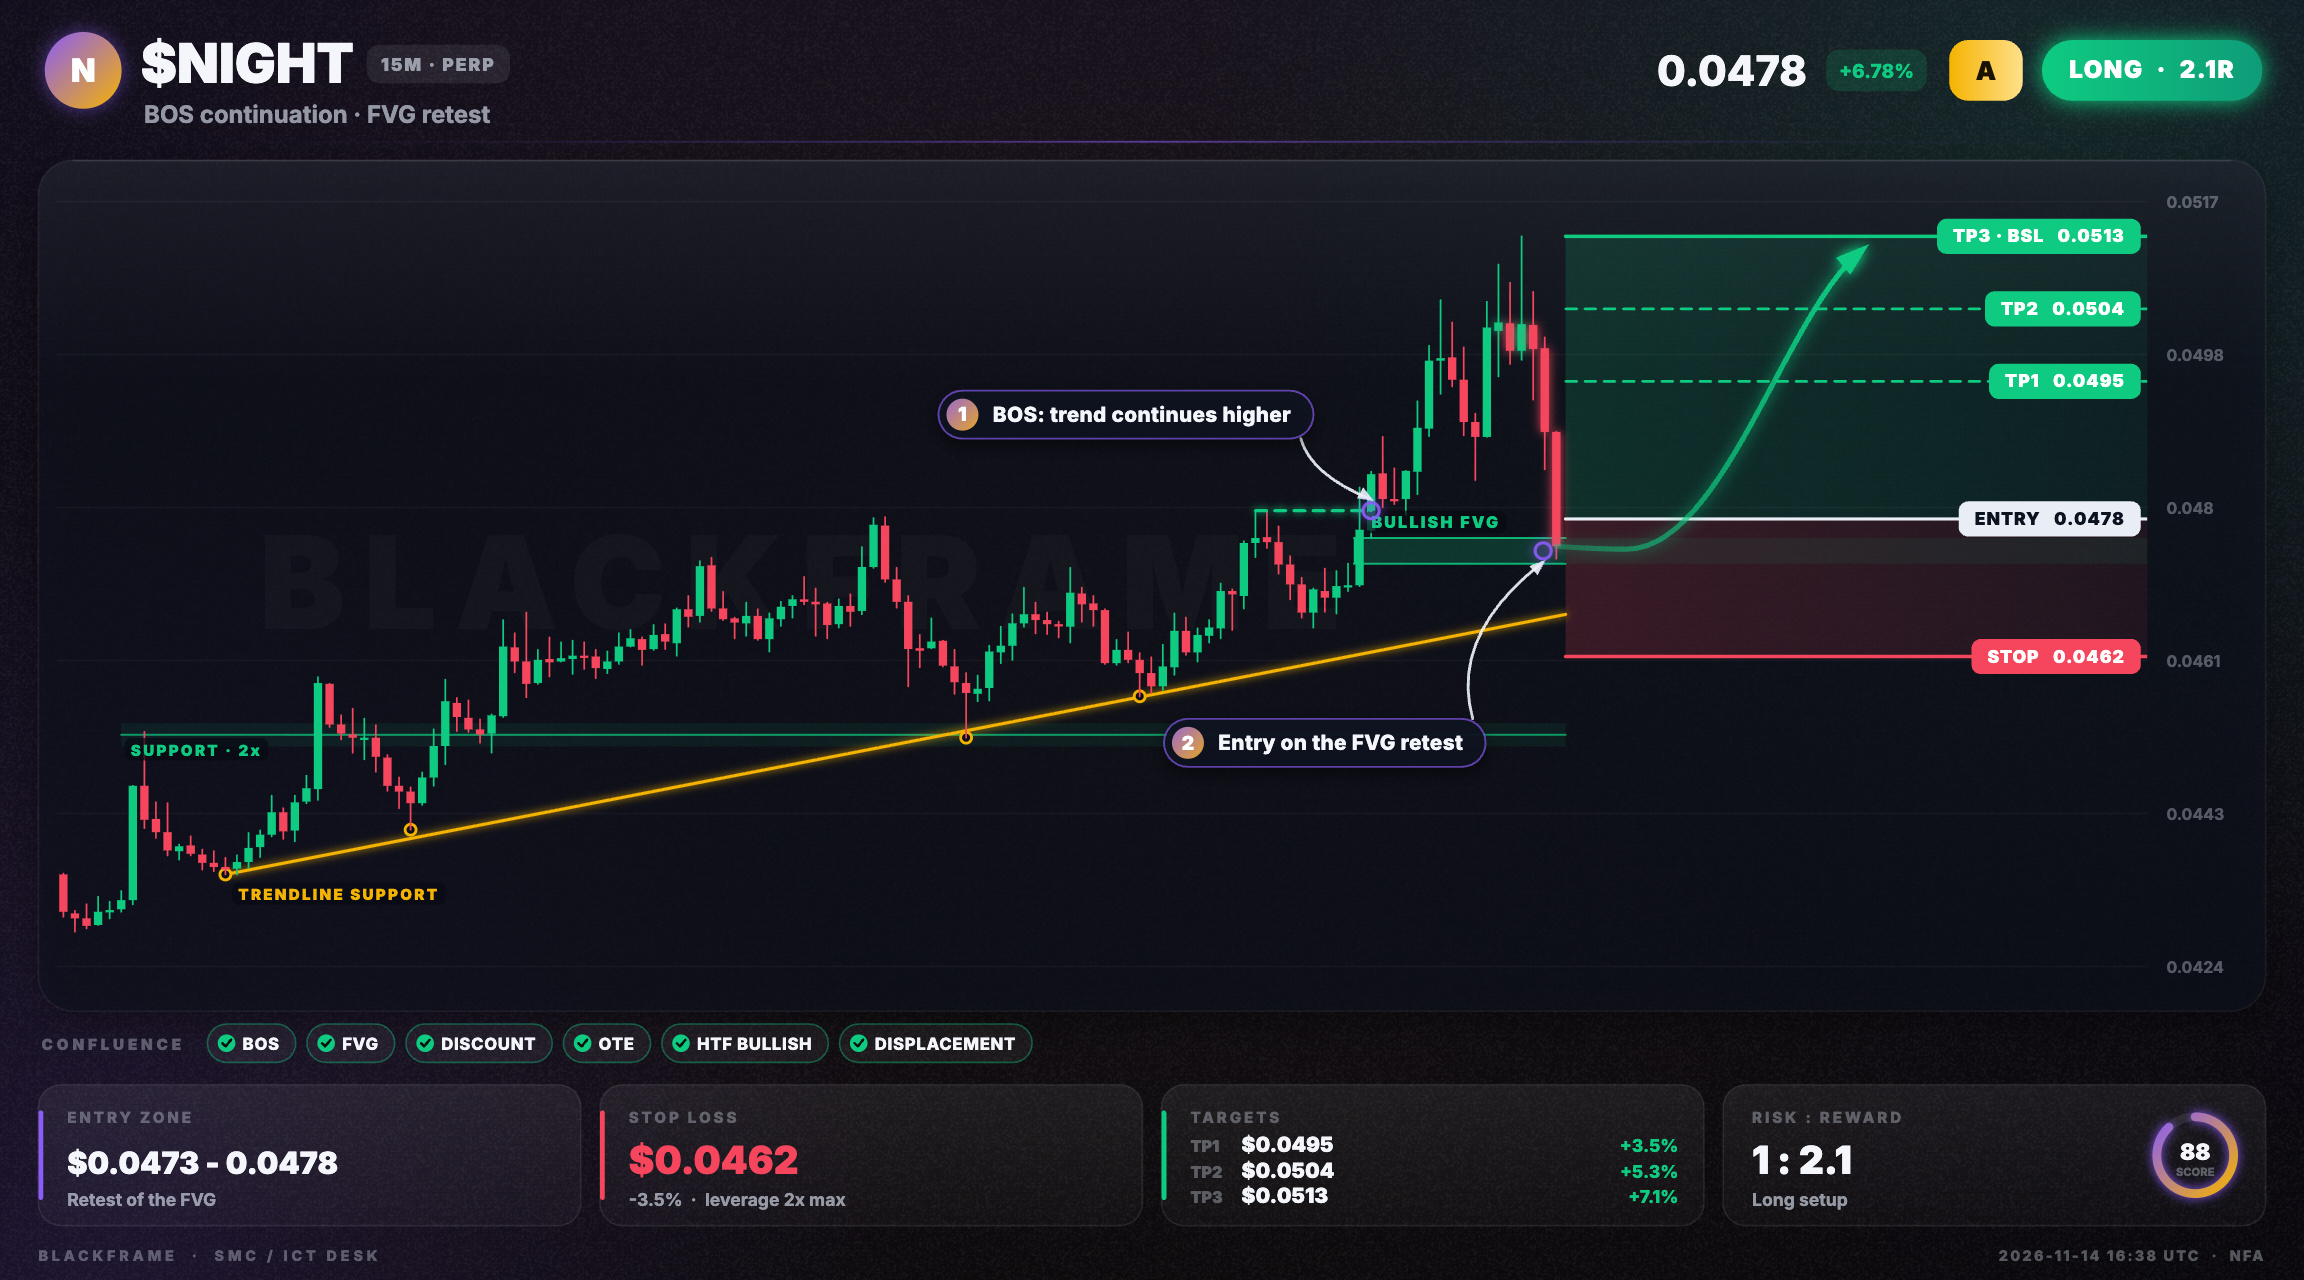
$NIGHT hits bullish OTE pocket 🚀
LONG · 15M
Entry: $0.0476 - $0.0478
TP1: $0.0495
TP2: $0.0504
TP3: $0.0513
SL: $0.0462
Price tapped the bullish FVG and BOS confirms the trend on the 15M. Buying from discount inside the OTE aligns with HTF bias. Target is buy‑side liquidity at $0.0513; stop at $0.0462.
#NIGHT #SMC · NFA
$NIGHT hits bullish OTE pocket 🚀
LONG · 15M
Entry: $0.0476 - $0.0478
TP1: $0.0495
TP2: $0.0504
TP3: $0.0513
SL: $0.0462
Price tapped the bullish FVG and BOS confirms the trend on the 15M. Buying from discount inside the OTE aligns with HTF bias. Target is buy‑side liquidity at $0.0513; stop at $0.0462.
#NIGHT #SMC · NFA
LONG · 15M
Entry: $0.0476 - $0.0478
TP1: $0.0495
TP2: $0.0504
TP3: $0.0513
SL: $0.0462
Price tapped the bullish FVG and BOS confirms the trend on the 15M. Buying from discount inside the OTE aligns with HTF bias. Target is buy‑side liquidity at $0.0513; stop at $0.0462.
#NIGHT #SMC · NFA
1
177


·
--
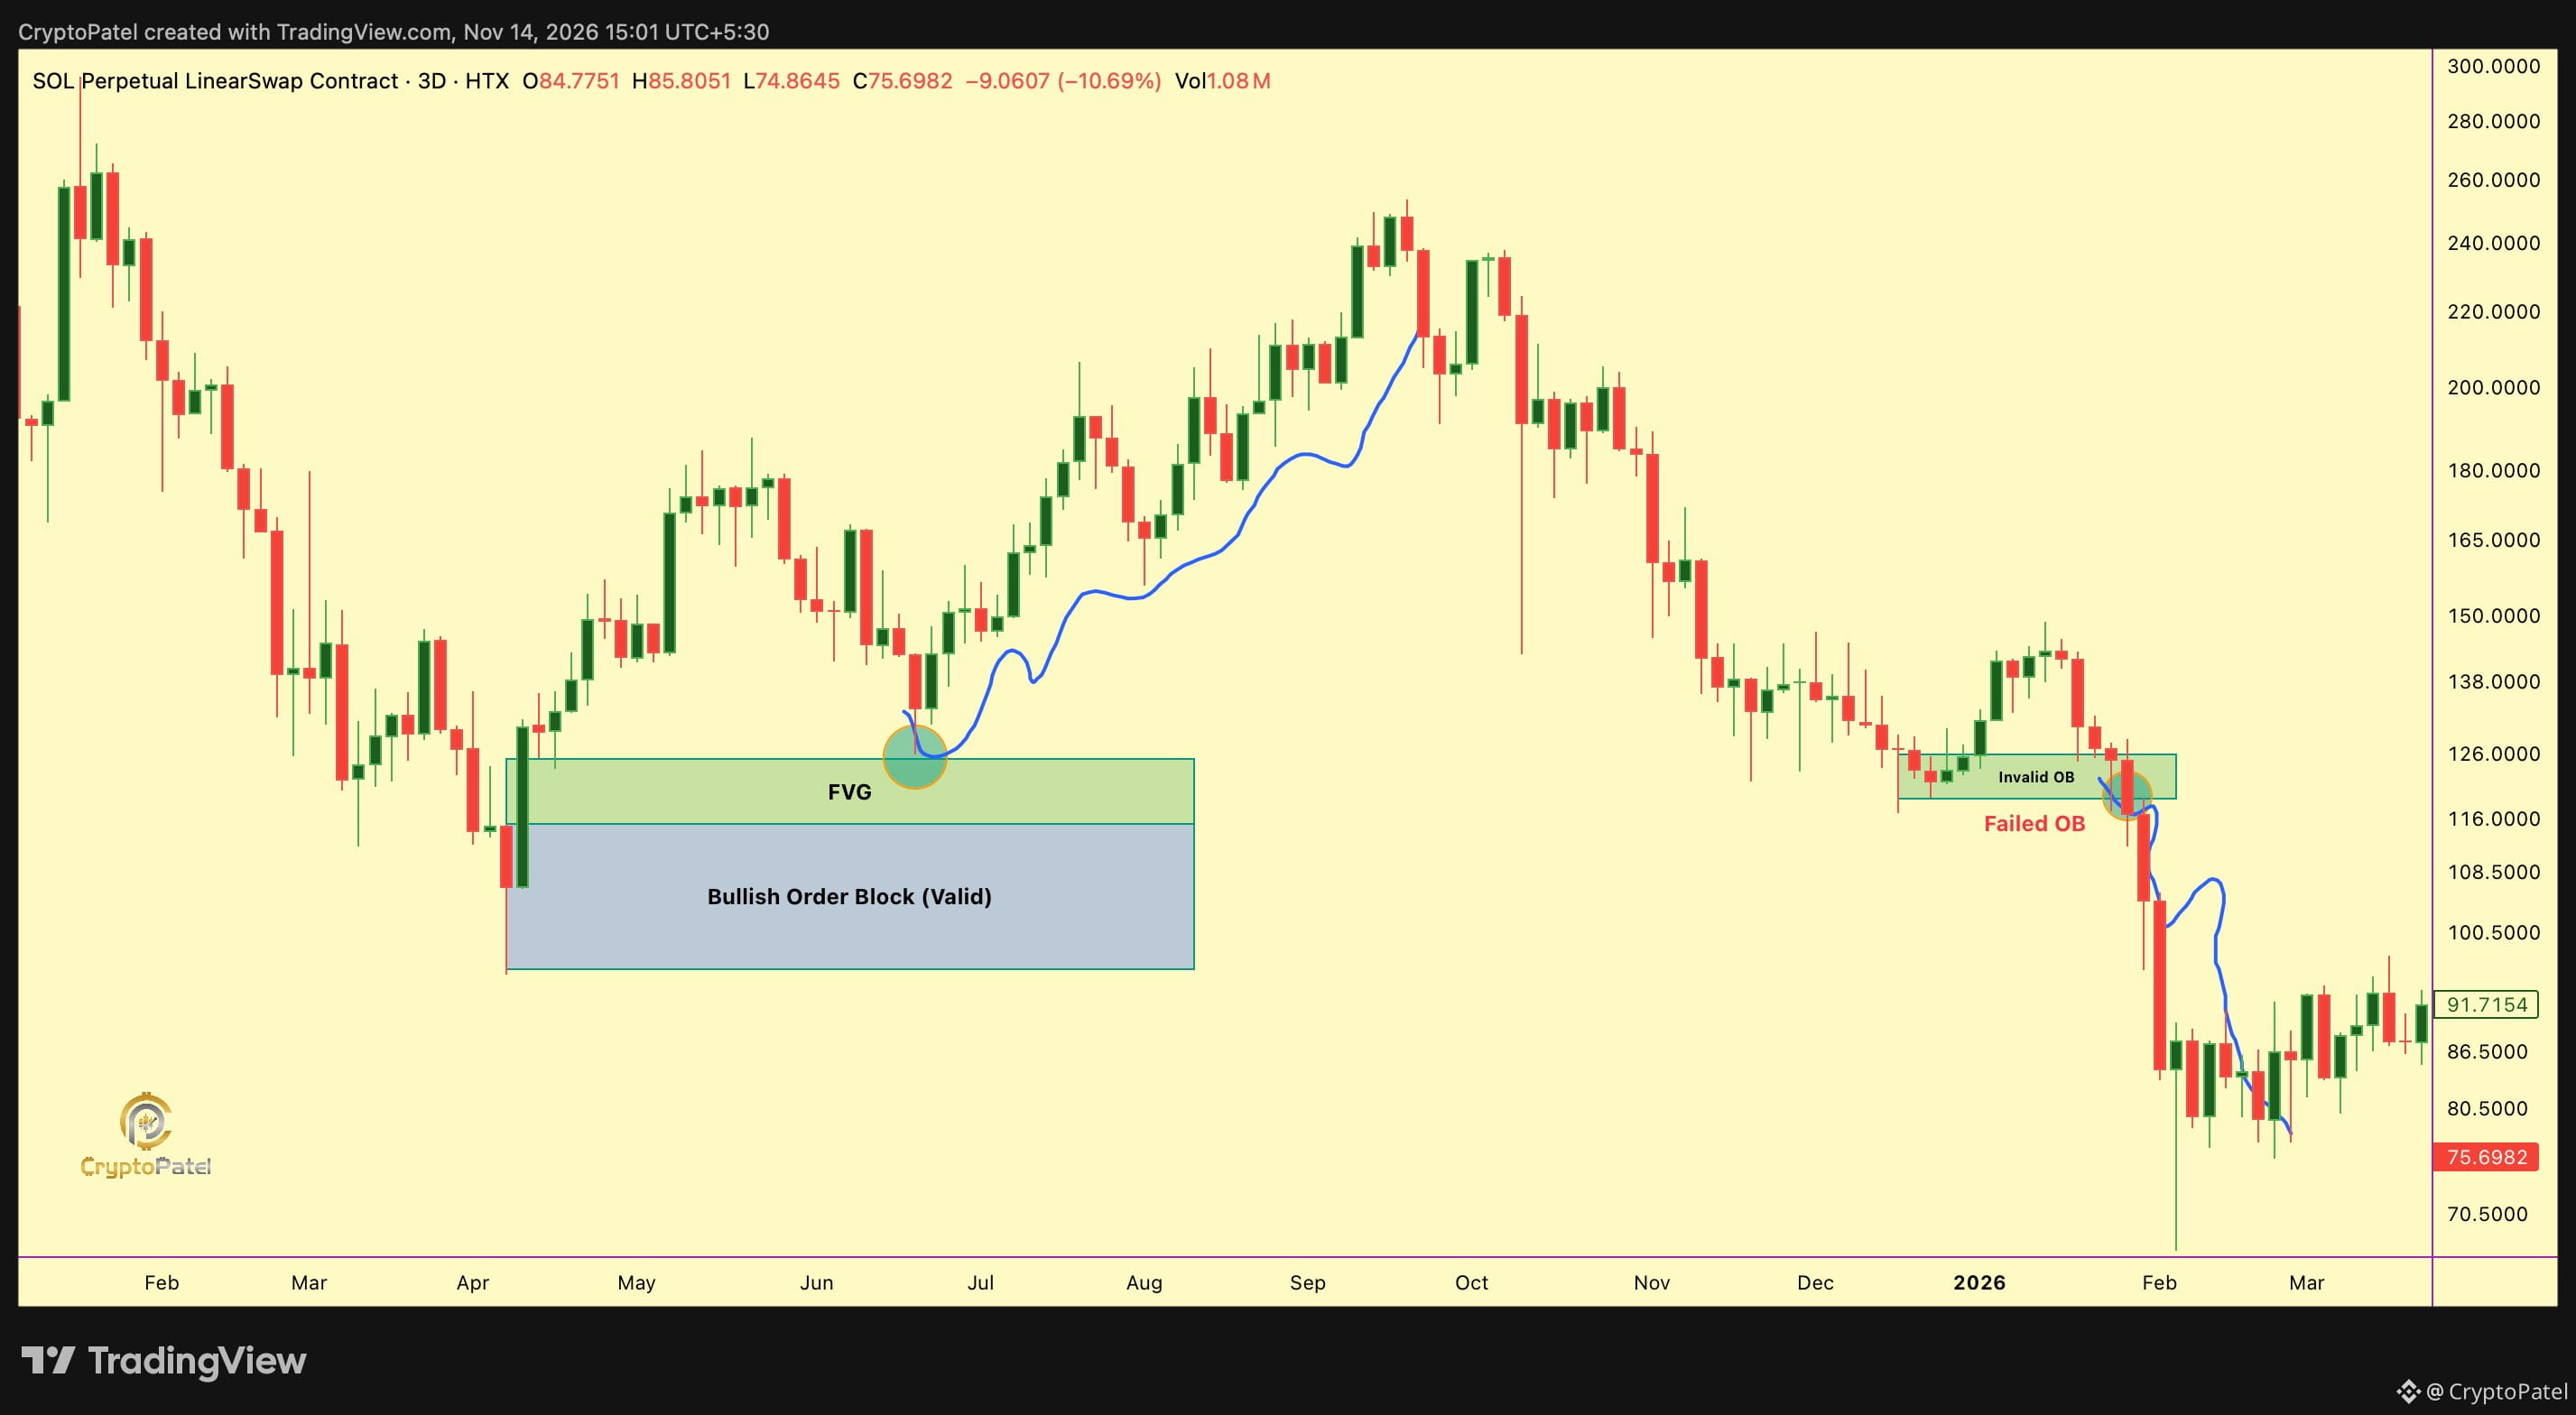
THE BIGGEST MISTAKE IN ORDER BLOCK TRADING?
Marking every opposite-coloured candle as an Order Block.
My quality checklist:
✅ Strong displacement away from the zone.
✅ Clear BOS or MSS.
✅ FVG formation adds confluence.
✅ Fresh and unmitigated zone.
✅ Alignment with higher-timeframe bias.
If price closes through the zone in the wrong direction, I stop treating it as a valid OB.
Quality over quantity.
#OrderBlock #SMC #Crypto
THE BIGGEST MISTAKE IN ORDER BLOCK TRADING?
Marking every opposite-coloured candle as an Order Block.
My quality checklist:
✅ Strong displacement away from the zone.
✅ Clear BOS or MSS.
✅ FVG formation adds confluence.
✅ Fresh and unmitigated zone.
✅ Alignment with higher-timeframe bias.
If price closes through the zone in the wrong direction, I stop treating it as a valid OB.
Quality over quantity.
#OrderBlock #SMC #Crypto
Marking every opposite-coloured candle as an Order Block.
My quality checklist:
✅ Strong displacement away from the zone.
✅ Clear BOS or MSS.
✅ FVG formation adds confluence.
✅ Fresh and unmitigated zone.
✅ Alignment with higher-timeframe bias.
If price closes through the zone in the wrong direction, I stop treating it as a valid OB.
Quality over quantity.
#OrderBlock #SMC #Crypto
244
·
--
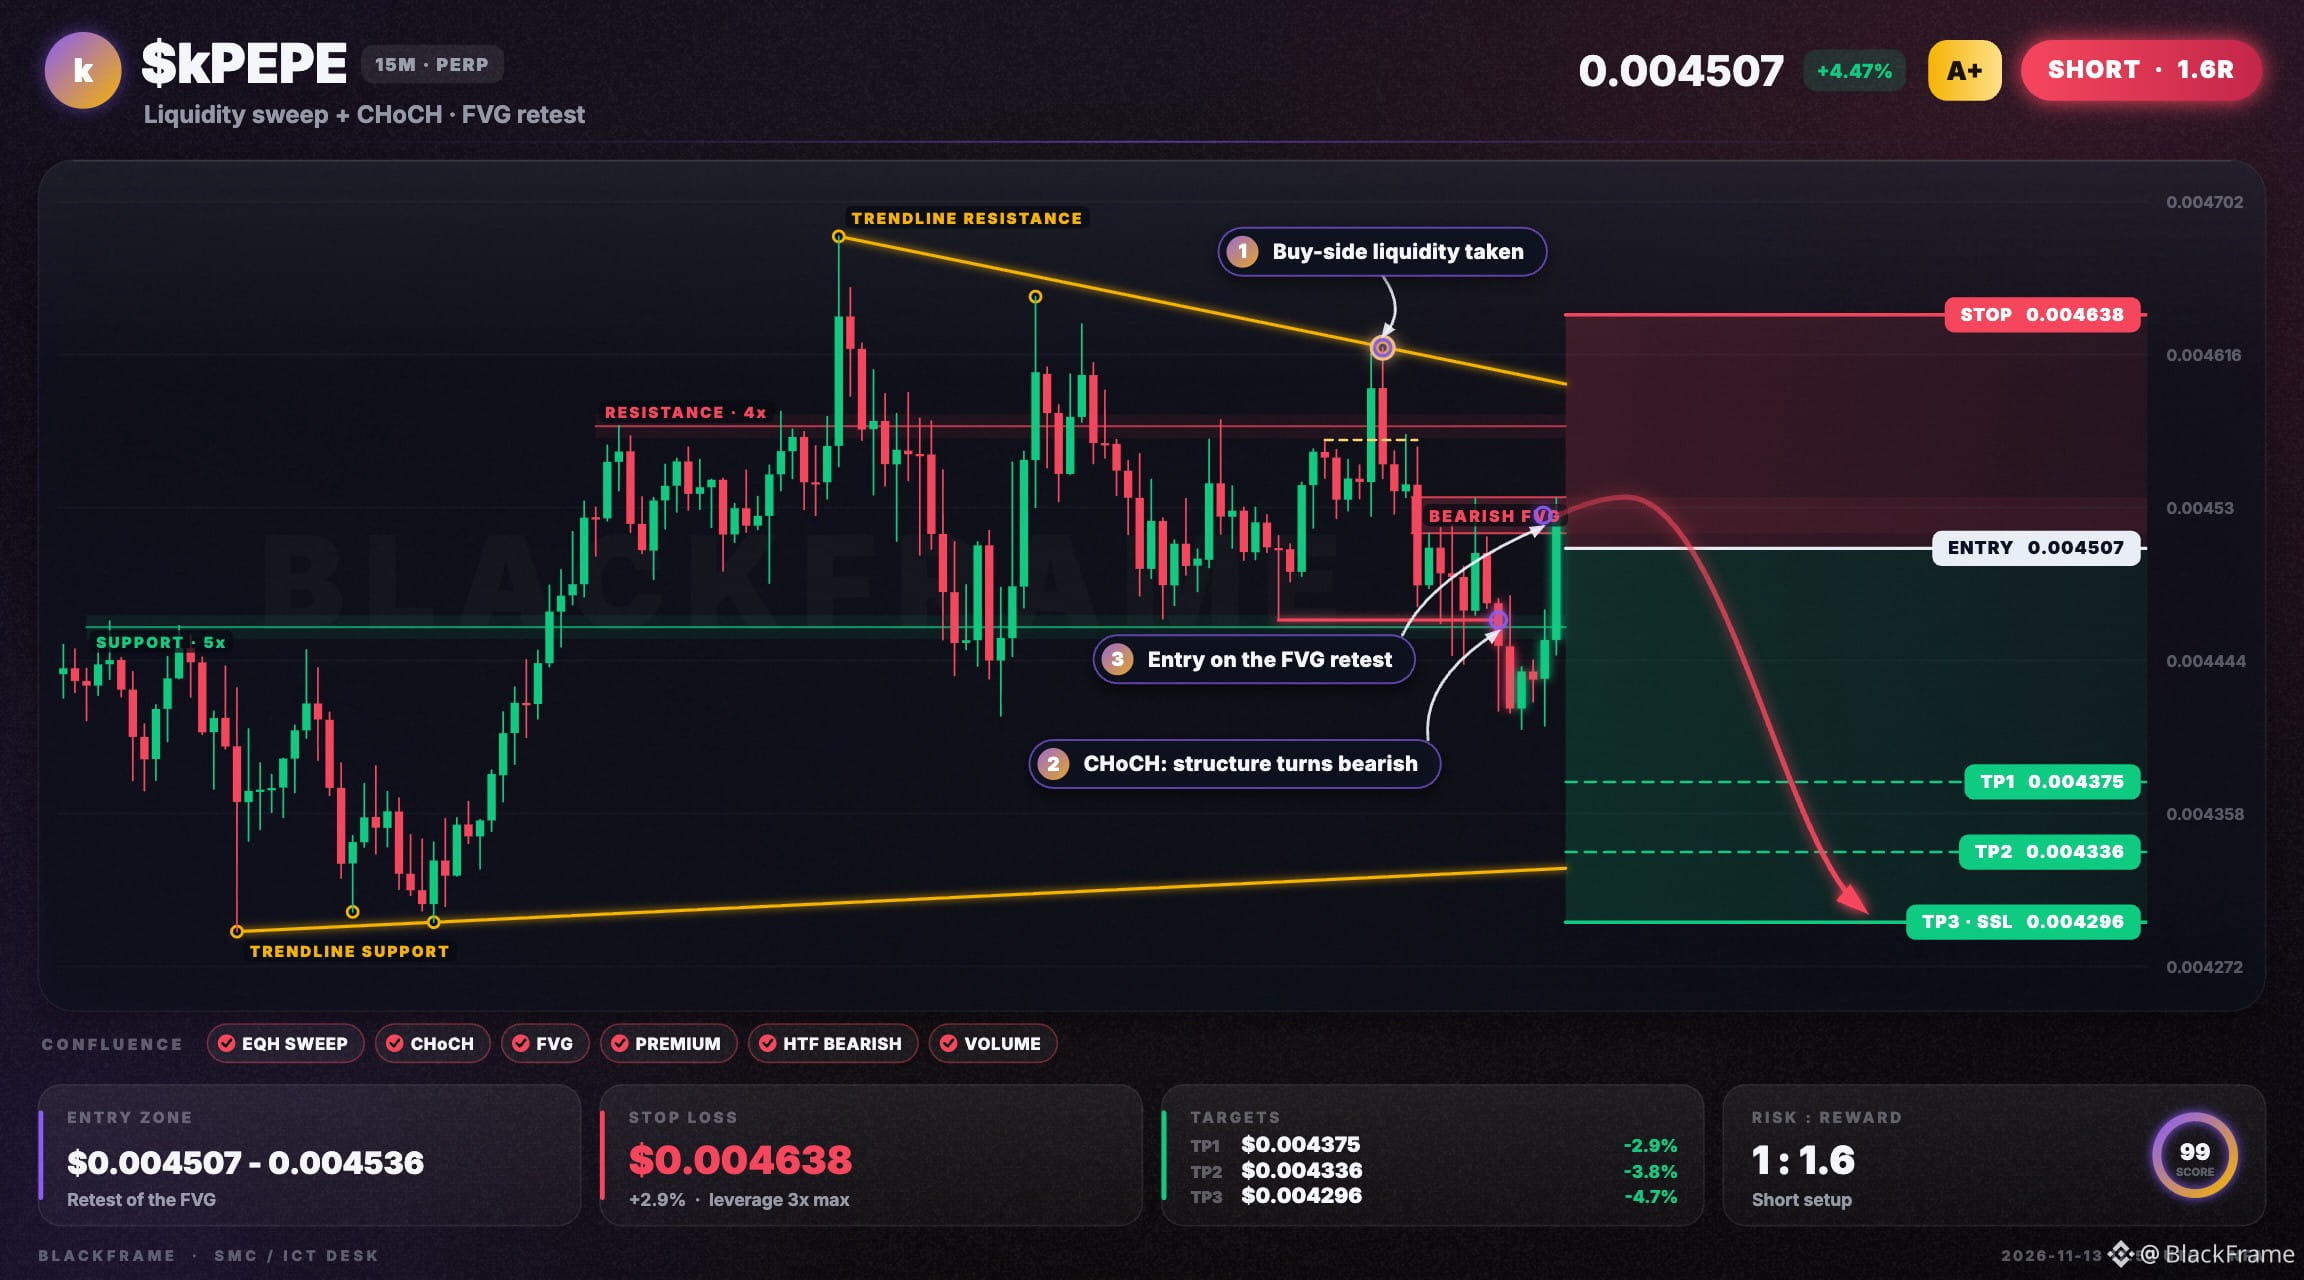
⚡️ $kPEPE liquidity sweep triggers short
SHORT · 15M
Entry: $0.004507 - $0.004515
TP1: $0.004375
TP2: $0.004336
TP3: $0.004296
SL: $0.004638
Equal highs were swept, buy-side taken. CHoCH confirmed on the 15M and price tapped a bearish FVG. Sell from premium with entry at $0.004507, stop at $0.004638, target at $0.004296. Invalidates if price retests the swept level $0.004568.
#kPEPE #SMC · NFA
⚡️ $kPEPE liquidity sweep triggers short
SHORT · 15M
Entry: $0.004507 - $0.004515
TP1: $0.004375
TP2: $0.004336
TP3: $0.004296
SL: $0.004638
Equal highs were swept, buy-side taken. CHoCH confirmed on the 15M and price tapped a bearish FVG. Sell from premium with entry at $0.004507, stop at $0.004638, target at $0.004296. Invalidates if price retests the swept level $0.004568.
#kPEPE #SMC · NFA
SHORT · 15M
Entry: $0.004507 - $0.004515
TP1: $0.004375
TP2: $0.004336
TP3: $0.004296
SL: $0.004638
Equal highs were swept, buy-side taken. CHoCH confirmed on the 15M and price tapped a bearish FVG. Sell from premium with entry at $0.004507, stop at $0.004638, target at $0.004296. Invalidates if price retests the swept level $0.004568.
#kPEPE #SMC · NFA
137
·
--
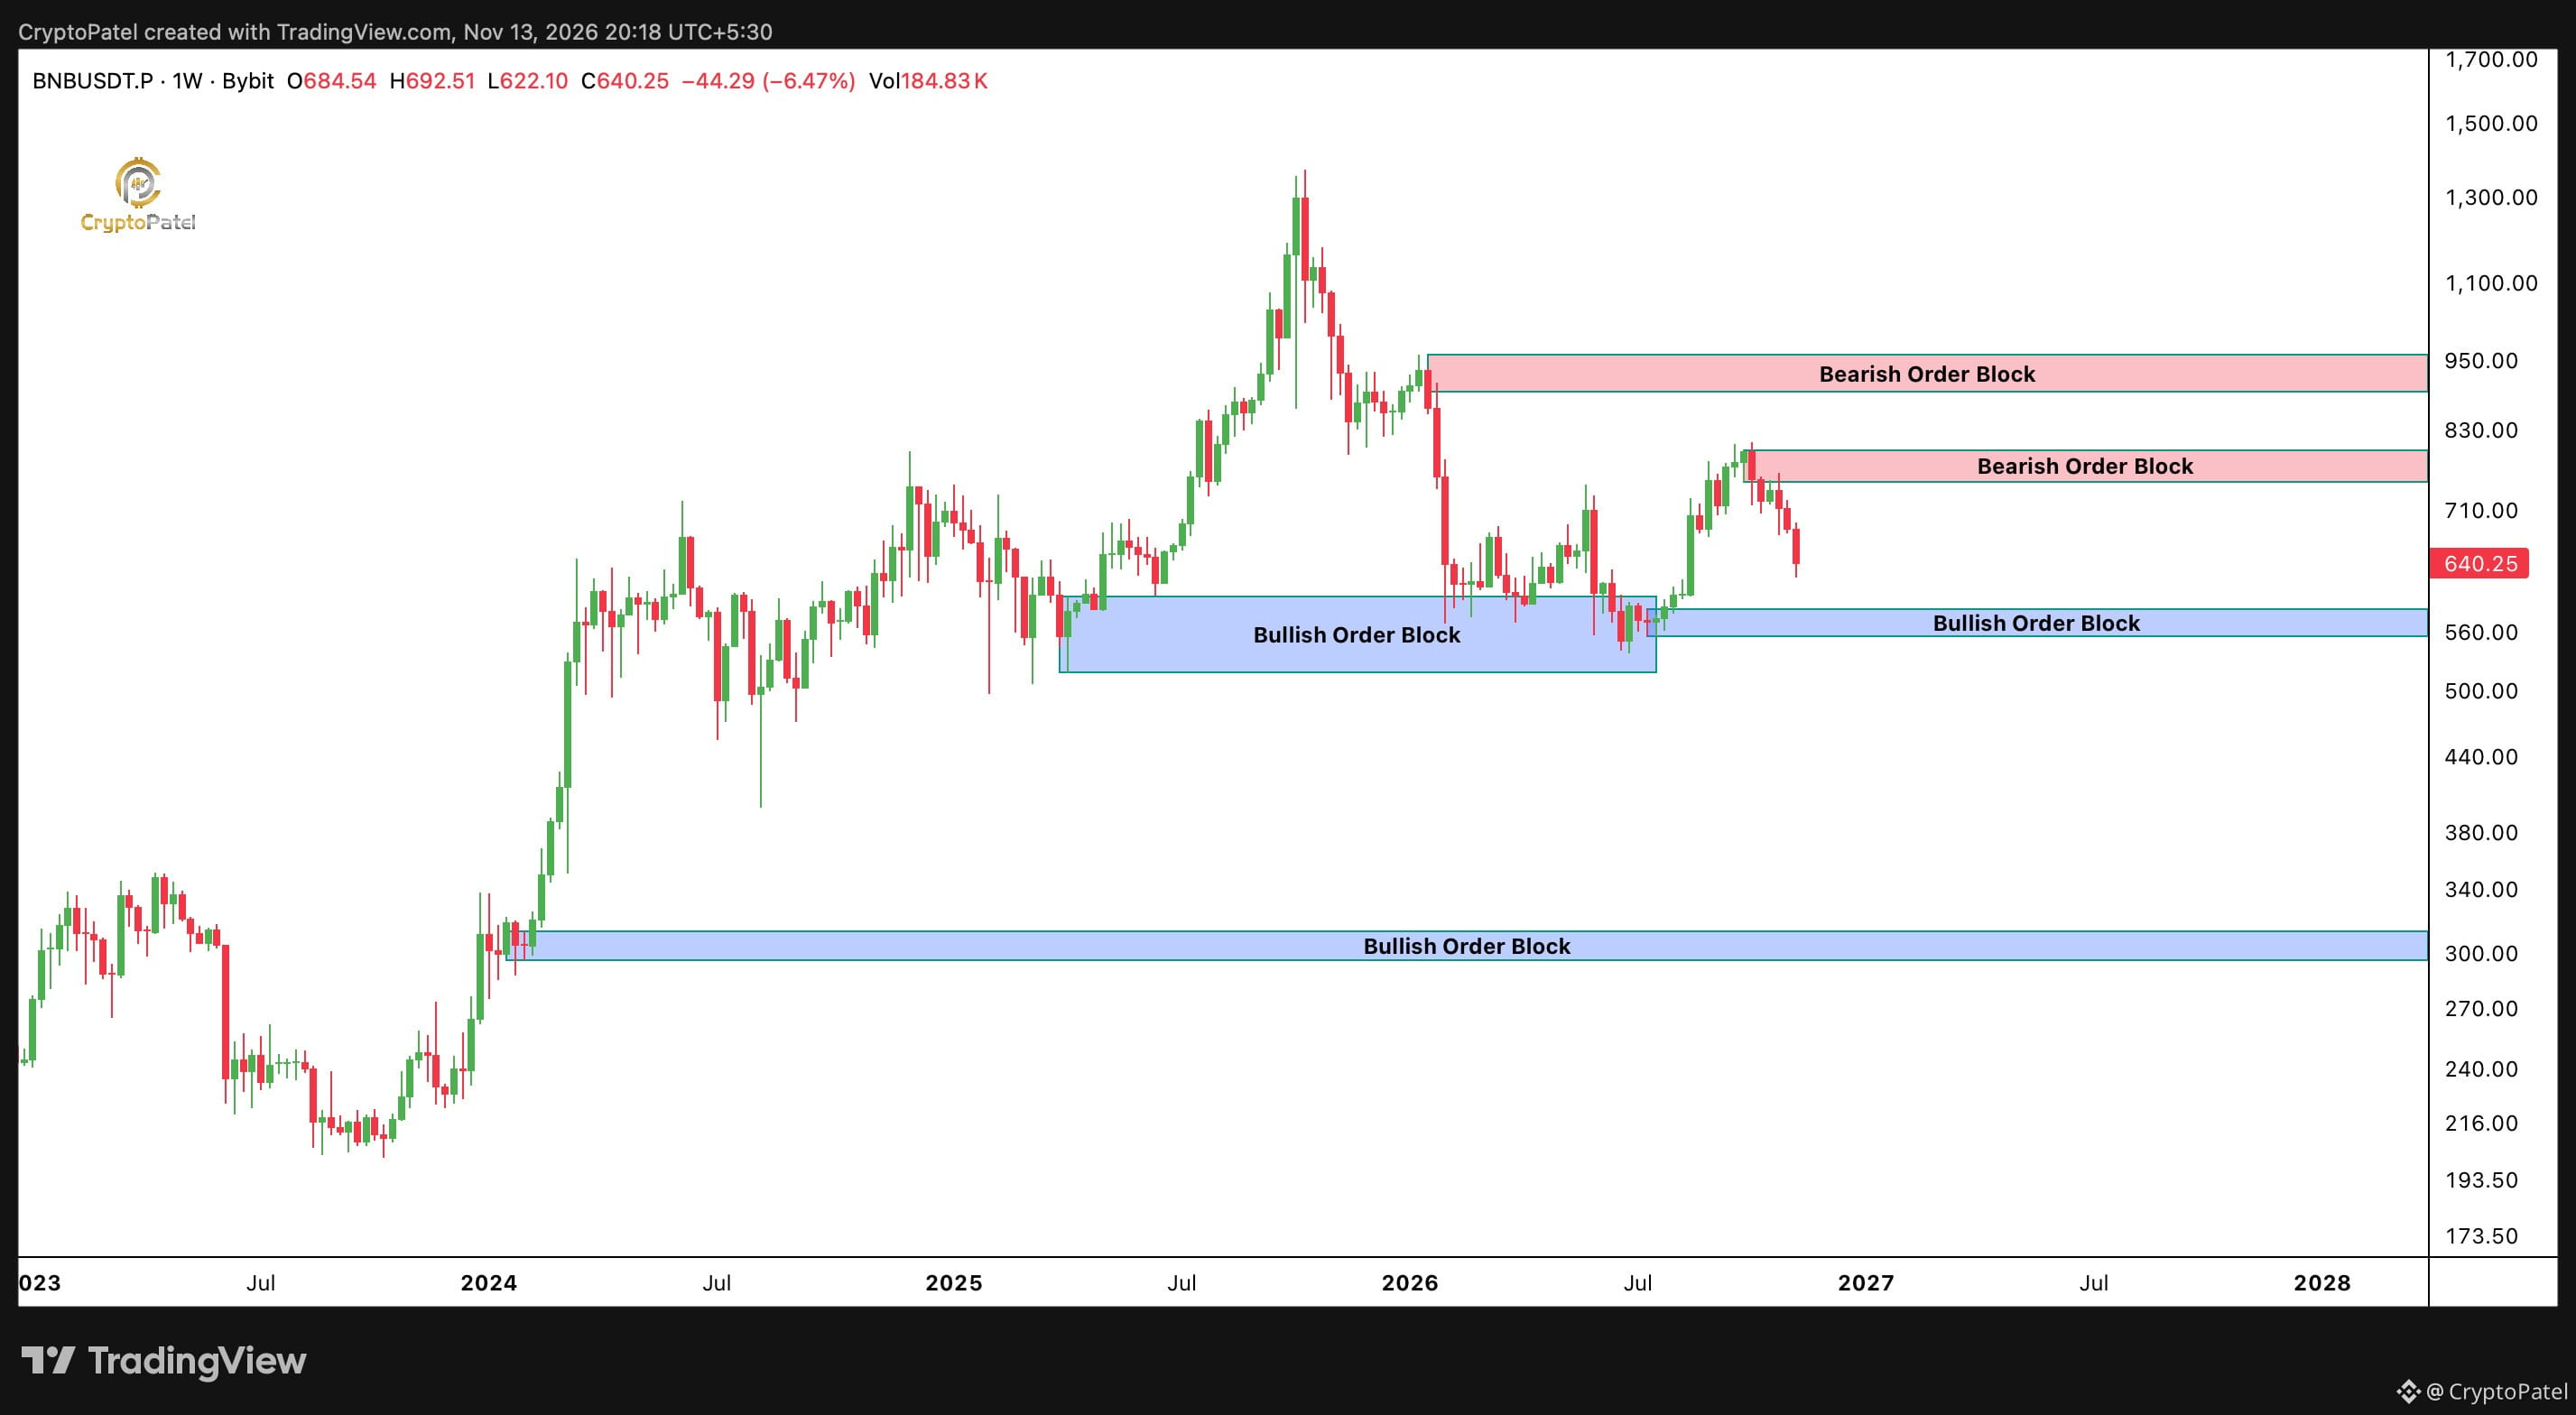
BULLISH vs BEARISH ORDER BLOCKS. KNOW THE DIFFERENCE ($BNB LIVE EXAMPLE)
🟢 Bullish OB: Last bearish candle before strong bullish displacement.
🔴 Bearish OB: Last bullish candle before strong bearish displacement.
How I use them:
▶️ Bullish OB = Potential demand zone.
▶️ Bearish OB = Potential supply zone.
I prefer zones that align with HTF structure and create a confirmed BOS or MSS.
Not every OB deserves a trade.
#BNB #Trading #SMC
BULLISH vs BEARISH ORDER BLOCKS. KNOW THE DIFFERENCE ($BNB LIVE EXAMPLE)
🟢 Bullish OB: Last bearish candle before strong bullish displacement.
🔴 Bearish OB: Last bullish candle before strong bearish displacement.
How I use them:
▶️ Bullish OB = Potential demand zone.
▶️ Bearish OB = Potential supply zone.
I prefer zones that align with HTF structure and create a confirmed BOS or MSS.
Not every OB deserves a trade.
#BNB #Trading #SMC
🟢 Bullish OB: Last bearish candle before strong bullish displacement.
🔴 Bearish OB: Last bullish candle before strong bearish displacement.
How I use them:
▶️ Bullish OB = Potential demand zone.
▶️ Bearish OB = Potential supply zone.
I prefer zones that align with HTF structure and create a confirmed BOS or MSS.
Not every OB deserves a trade.
#BNB #Trading #SMC
298
·
--
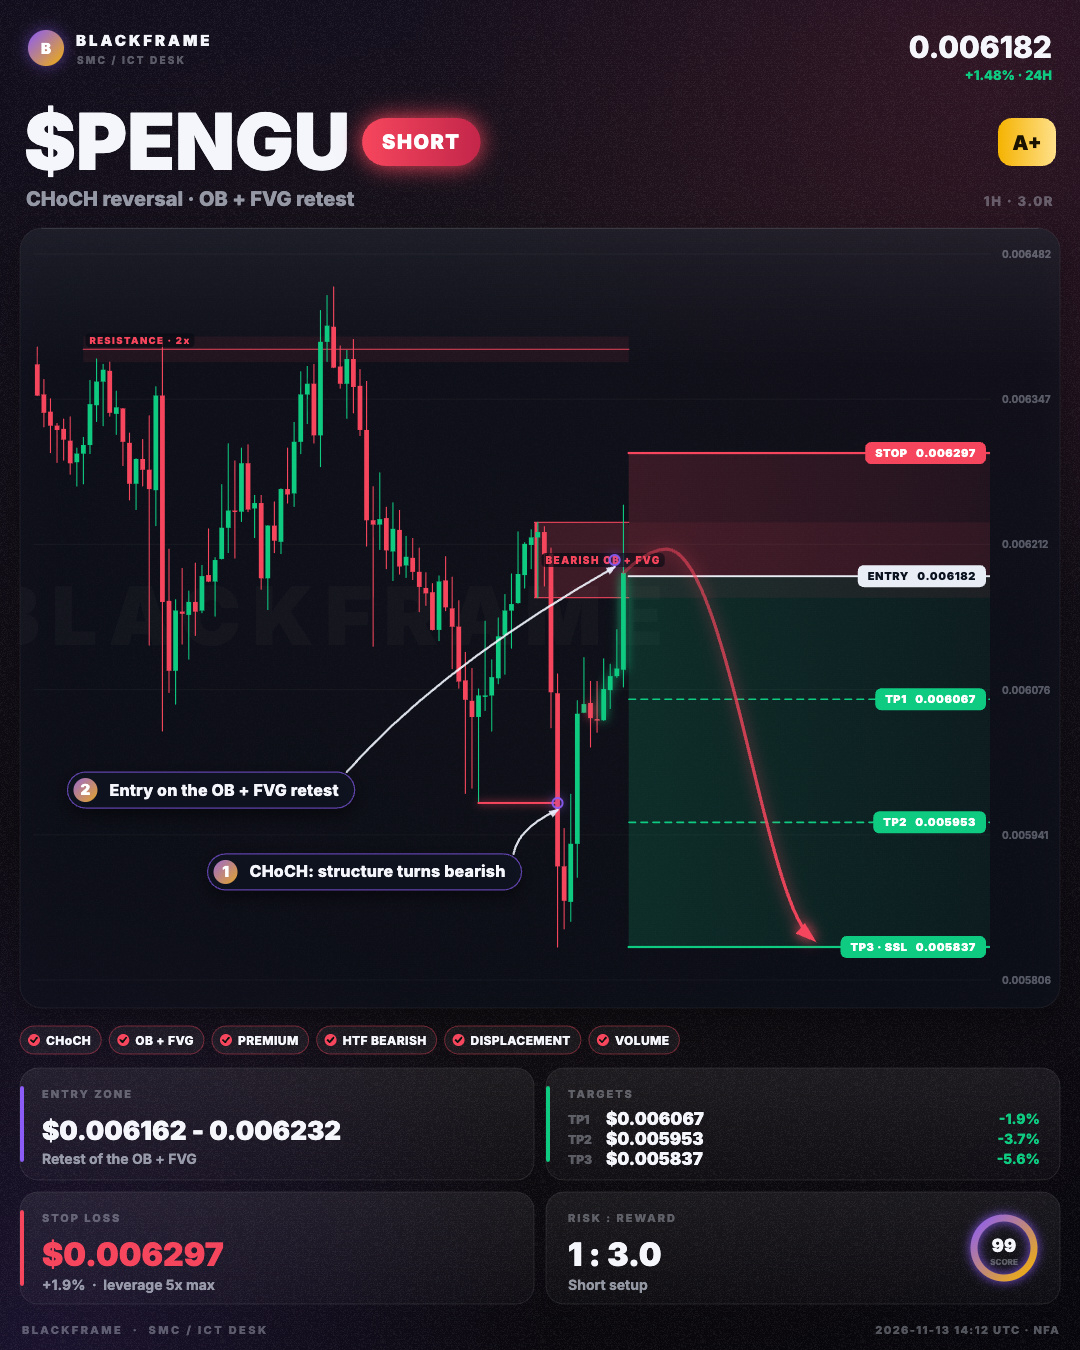
📉 $PENGU flipped structure bearish
SHORT · 1H
Entry: $0.006162 - $0.006182
TP1: $0.006067
TP2: $0.005953
TP3: $0.005837
SL: $0.006297
Structure then flipped bearish with a CHoCH on the 1H. Entry is the first retest of the fresh bearish order block and FVG in premium, targeting sell-side liquidity below.
#PENGU #SMC · NFA
📉 $PENGU flipped structure bearish
SHORT · 1H
Entry: $0.006162 - $0.006182
TP1: $0.006067
TP2: $0.005953
TP3: $0.005837
SL: $0.006297
Structure then flipped bearish with a CHoCH on the 1H. Entry is the first retest of the fresh bearish order block and FVG in premium, targeting sell-side liquidity below.
#PENGU #SMC · NFA
SHORT · 1H
Entry: $0.006162 - $0.006182
TP1: $0.006067
TP2: $0.005953
TP3: $0.005837
SL: $0.006297
Structure then flipped bearish with a CHoCH on the 1H. Entry is the first retest of the fresh bearish order block and FVG in premium, targeting sell-side liquidity below.
#PENGU #SMC · NFA
89
·
--
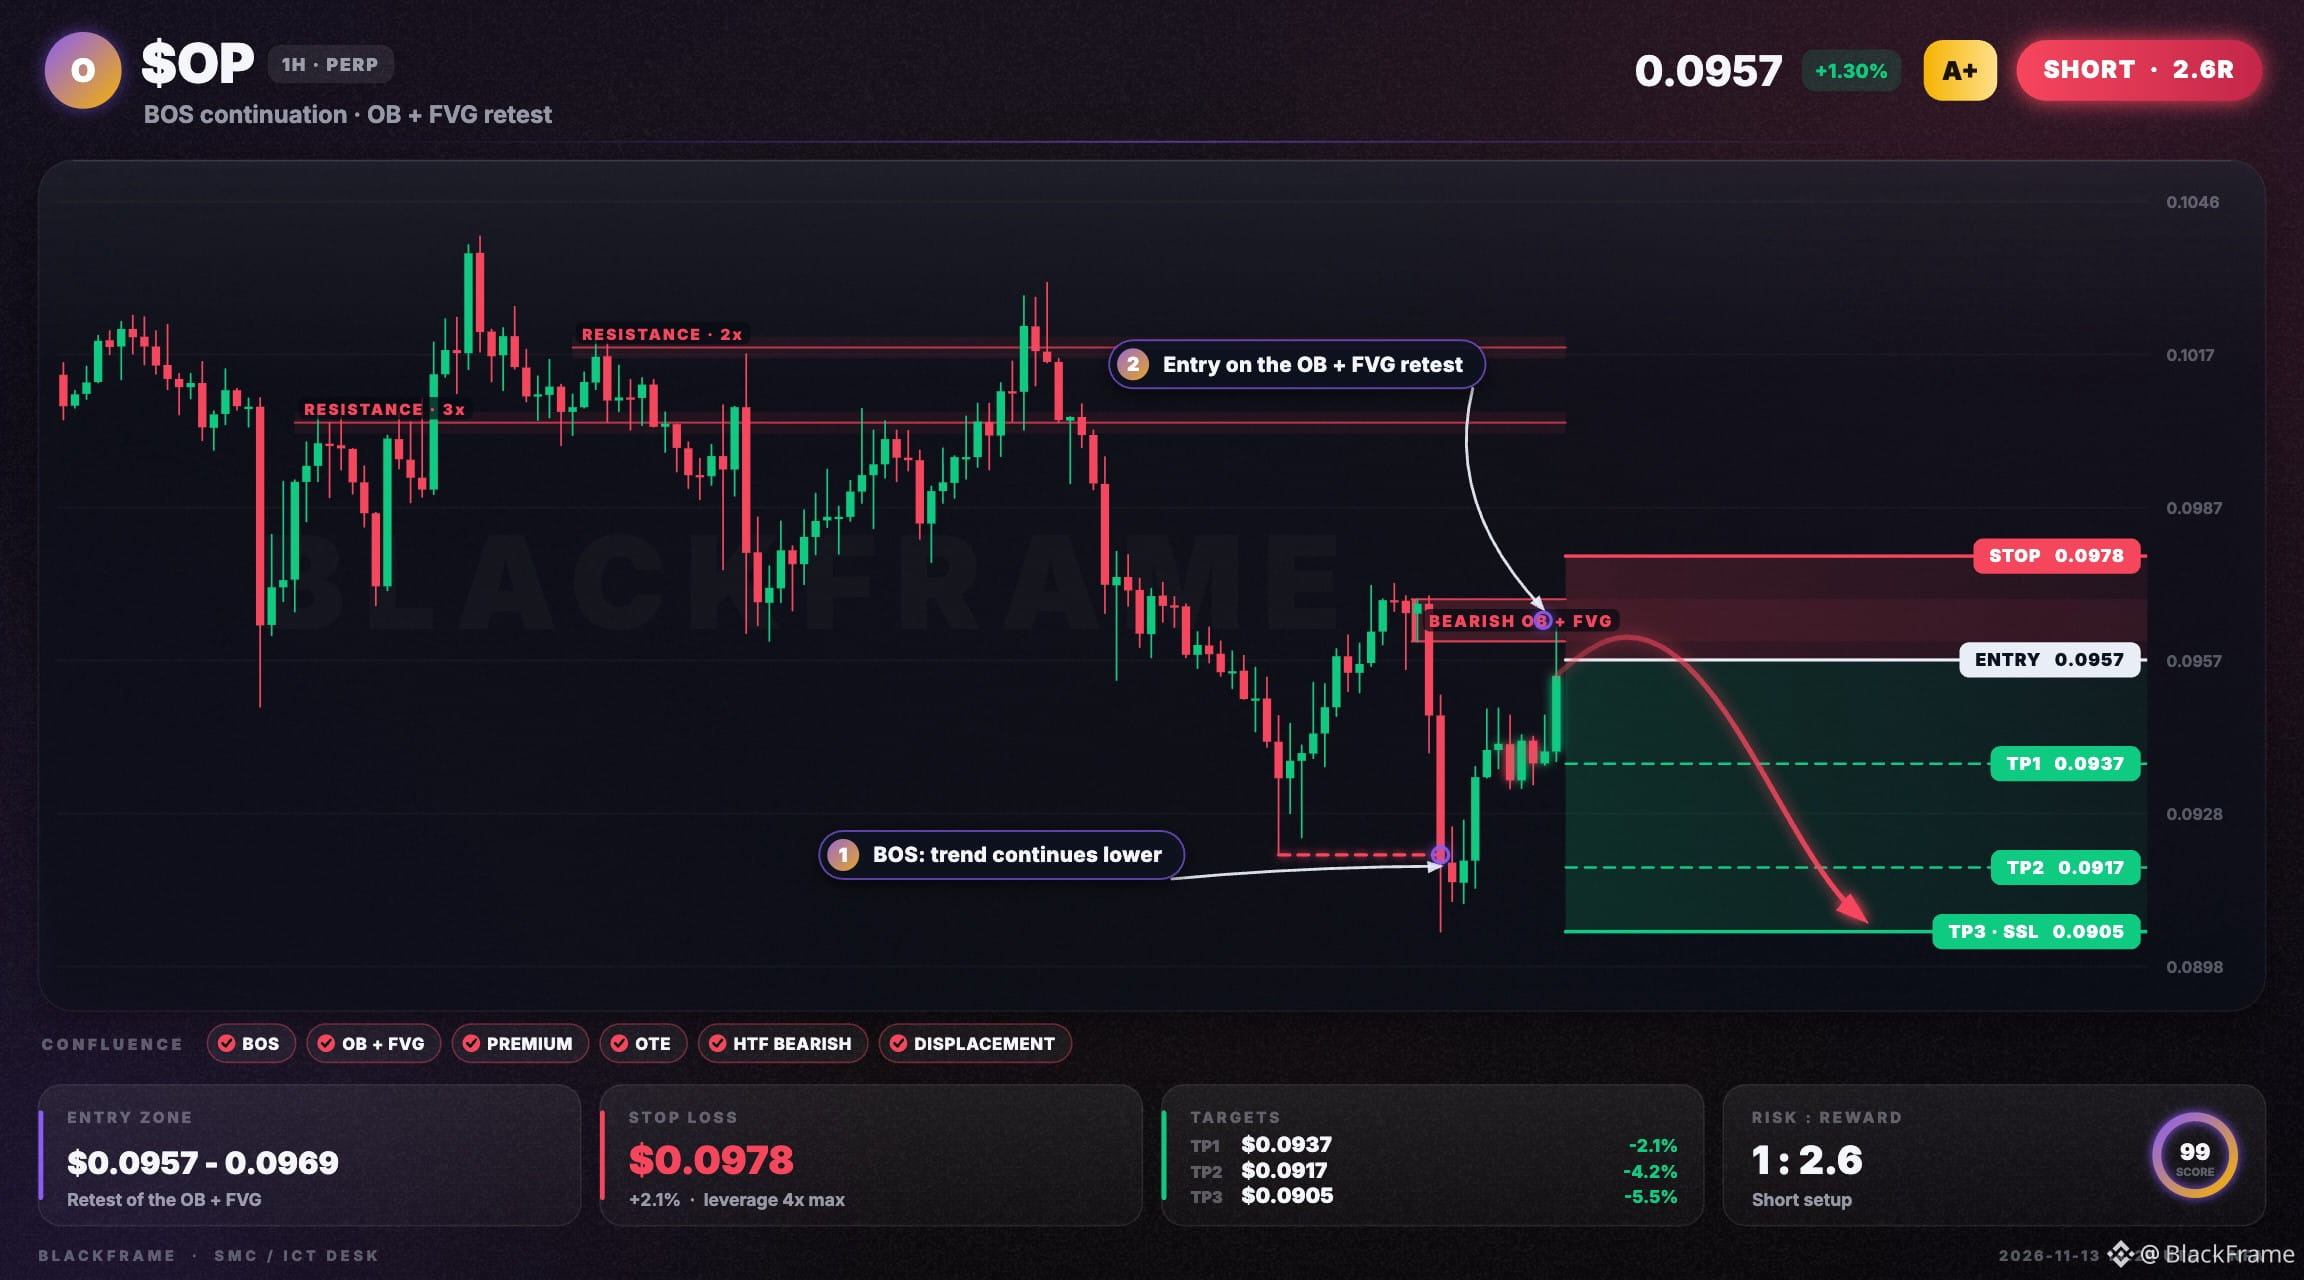
⚡ $OP pierces premium, killzone pressure
SHORT · 1H
Entry: $0.0957 - $0.0961
TP1: $0.0937
TP2: $0.0917
TP3: $0.0905
SL: $0.0978
Bearish BOS on 1H confirms downtrend, OB and FVG overlap at $0.0961-0.0969. Entry at $0.0957 inside OTE pocket, target sell-side liquidity at $0.0905. Stop at $0.0978.
#OP #SMC · NFA
⚡ $OP pierces premium, killzone pressure
SHORT · 1H
Entry: $0.0957 - $0.0961
TP1: $0.0937
TP2: $0.0917
TP3: $0.0905
SL: $0.0978
Bearish BOS on 1H confirms downtrend, OB and FVG overlap at $0.0961-0.0969. Entry at $0.0957 inside OTE pocket, target sell-side liquidity at $0.0905. Stop at $0.0978.
#OP #SMC · NFA
SHORT · 1H
Entry: $0.0957 - $0.0961
TP1: $0.0937
TP2: $0.0917
TP3: $0.0905
SL: $0.0978
Bearish BOS on 1H confirms downtrend, OB and FVG overlap at $0.0961-0.0969. Entry at $0.0957 inside OTE pocket, target sell-side liquidity at $0.0905. Stop at $0.0978.
#OP #SMC · NFA
65
Log in to explore more content
Join global crypto users on Binance Square
⚡️ Get latest and useful information about crypto.
💬 Trusted by the world’s largest crypto exchange.
👍 Discover real insights from verified creators.
Email / Phone number
Trending Topics
1
#CanBTCReboundAfterFallingBelow60K?
120,239 views
512 Discussing
2
#GlobalStocksFaceLongestLosingStreakSince2023
52,266 views
499 Discussing
3
#AnthropicPlungesTowardIPOPriceonDay2
17,921 views
201 Discussing
4
#GaoTengBitcoinETFListsOnHKEX
37,335 views
386 Discussing
5
#TradFiForBeginners
1M views
5,823 Discussing
6
#NvidiaBoardReportedlySplitOverHuang’sReturn
401,728 views
2,581 Discussing
7
#TetherBurns8BillionUSDTInPast20Days
44,980 views
160 Discussing
8
#BitcoinWalletSignatureFlawExploitableWithinSeconds
12,437 views
77 Discussing
9
#CanGTA6'sLaunchLiftTTWOShares?
337,653 views
1,808 Discussing
10
#HongKongProposesSFCLicensingForFourVirtualAssetServices
2,159 views
36 Discussing