
#ray
ray
2.2M views
5,793 Discussing
Hot
Latest

·
--
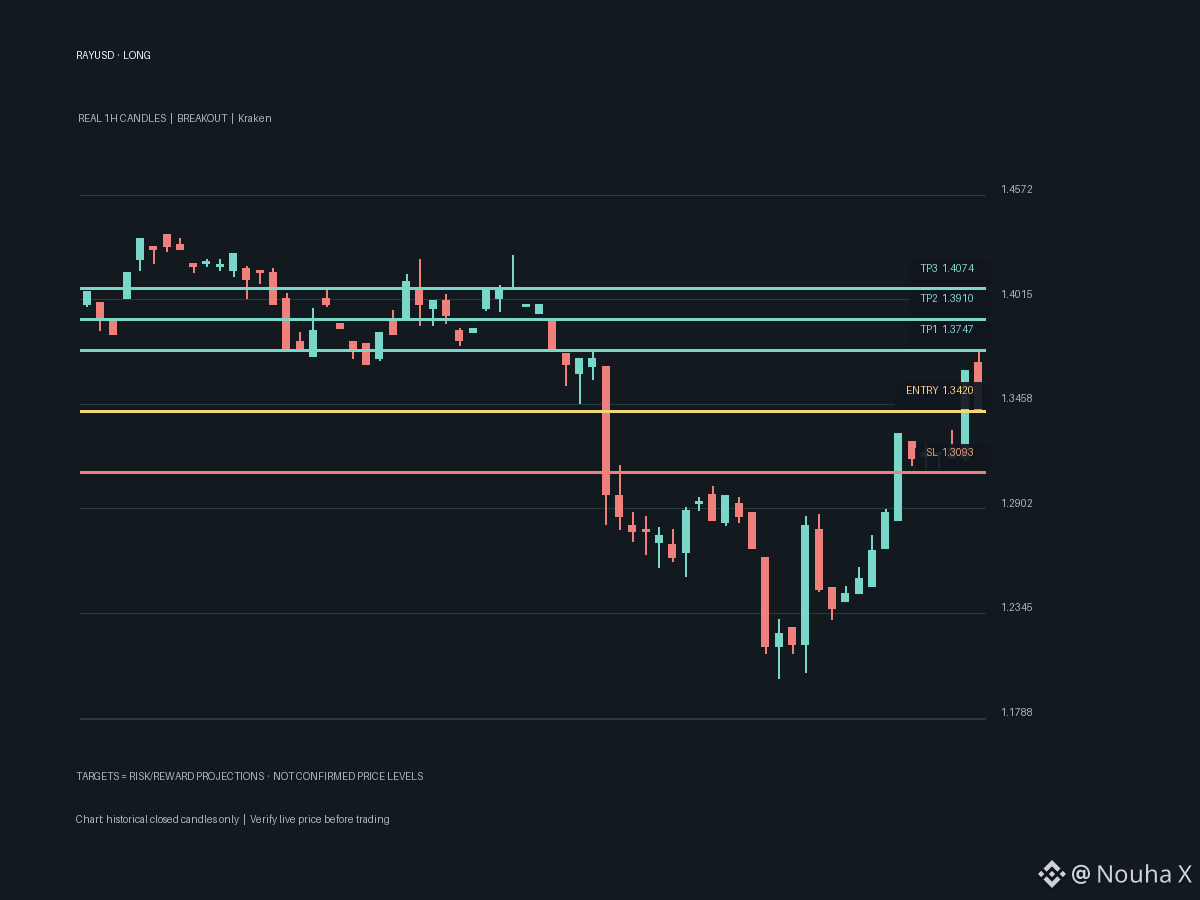
👀 RAYUSD: a breakout worth watching (1h).
Closed above 20-candle resistance 1.332 with elevated volume.
Entry: 1.342
TP1: 1.3747 | TP2: 1.391 | TP3: 1.4074
SL: 1.3093
Targets are risk-based (1R / 1.5R / 2R), not confirmed chart levels. Watch price and invalidation.
#RAY #PriceAction
👀 RAYUSD: a breakout worth watching (1h).
Closed above 20-candle resistance 1.332 with elevated volume.
Entry: 1.342
TP1: 1.3747 | TP2: 1.391 | TP3: 1.4074
SL: 1.3093
Targets are risk-based (1R / 1.5R / 2R), not confirmed chart levels. Watch price and invalidation.
#RAY #PriceAction
Closed above 20-candle resistance 1.332 with elevated volume.
Entry: 1.342
TP1: 1.3747 | TP2: 1.391 | TP3: 1.4074
SL: 1.3093
Targets are risk-based (1R / 1.5R / 2R), not confirmed chart levels. Watch price and invalidation.
#RAY #PriceAction
30

·
--
$RAY +5.99% | $币安人生 +5.92% | $TWT +5.84%
#RAY is holding at $1.35, up +5.99% on $4.0 M of volume. The Solana‑based AMM continues to draw liquidity, though a pullback could test the upside.
#币安人生 trades around $0.4470, gaining +5.92% with $1.8 M changing hands. Momentum is solid, yet the narrow price band suggests a possible pause.
#TWT sits at $0.3173, climbing +5.84% on $1.1 M of volume. Activity is brisk, but the token’s thin order book may limit further spikes.
👀 Watch if the volume upticks translate into broader buying pressure across these midsize caps.
#Write2Earn #Binance
$RAY +5.99% | $币安人生 +5.92% | $TWT +5.84%
#RAY is holding at $1.35, up +5.99% on $4.0 M of volume. The Solana‑based AMM continues to draw liquidity, though a pullback could test the upside.
#币安人生 trades around $0.4470, gaining +5.92% with $1.8 M changing hands. Momentum is solid, yet the narrow price band suggests a possible pause.
#TWT sits at $0.3173, climbing +5.84% on $1.1 M of volume. Activity is brisk, but the token’s thin order book may limit further spikes.
👀 Watch if the volume upticks translate into broader buying pressure across these midsize caps.
#Write2Earn #Binance
#RAY is holding at $1.35, up +5.99% on $4.0 M of volume. The Solana‑based AMM continues to draw liquidity, though a pullback could test the upside.
#币安人生 trades around $0.4470, gaining +5.92% with $1.8 M changing hands. Momentum is solid, yet the narrow price band suggests a possible pause.
#TWT sits at $0.3173, climbing +5.84% on $1.1 M of volume. Activity is brisk, but the token’s thin order book may limit further spikes.
👀 Watch if the volume upticks translate into broader buying pressure across these midsize caps.
#Write2Earn #Binance
1

·
--
🔴 $RAY SHORT · 4h · update
🎯 Target reached · Mitigation Block, Bearish
1.2771 → 1.2571 · +1.6% in 1h 30m
Automated chart-pattern signal. Not financial advice.
#RAY #CryptoSignals
🔴 $RAY SHORT · 4h · update
🎯 Target reached · Mitigation Block, Bearish
1.2771 → 1.2571 · +1.6% in 1h 30m
Automated chart-pattern signal. Not financial advice.
#RAY #CryptoSignals
🎯 Target reached · Mitigation Block, Bearish
1.2771 → 1.2571 · +1.6% in 1h 30m
Automated chart-pattern signal. Not financial advice.
#RAY #CryptoSignals

·
--
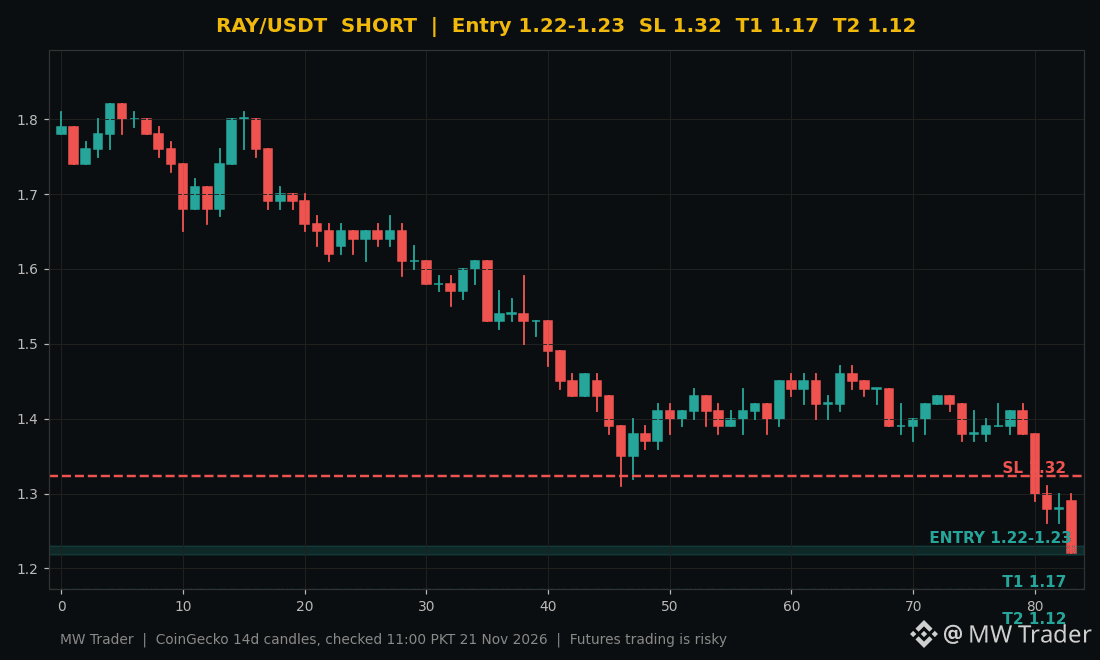
$RAY #RAY 📉 Raydium is down 12.6 percent in 24 hours, and Solana weakness is dragging it down.
Direction: SHORT 🔴
Entry zone: 1.22 to 1.23
Stop loss: 1.32
Target 1: 1.17
Target 2: 1.12
Raydium is trading near $1.22 after losing 12.60 percent in 24 hours, according to CoinGecko, with a 24 hour low of $1.20 and a high of $1.42. Solana itself is down 9.91 percent to $65.48, so the whole Solana ecosystem is under pressure, and Raydium as a Solana DEX token is falling faster than the chain it runs on. My plan is short the bounce into the $1.22 to $1.23 zone, stop above $1.32, first target $1.17, second target $1.12. 📉
Would you short RAY while SOL is still falling, or wait for SOL to find a floor first? 🤔
Futures trading is risky, trade small, manage risk, do your own research. ⚠️
Follow for more trades.
#Raydium #Crypto #FuturesTrading #TradingSignals
$RAY #RAY 📉 Raydium is down 12.6 percent in 24 hours, and Solana weakness is dragging it down.
Direction: SHORT 🔴
Entry zone: 1.22 to 1.23
Stop loss: 1.32
Target 1: 1.17
Target 2: 1.12
Raydium is trading near $1.22 after losing 12.60 percent in 24 hours, according to CoinGecko, with a 24 hour low of $1.20 and a high of $1.42. Solana itself is down 9.91 percent to $65.48, so the whole Solana ecosystem is under pressure, and Raydium as a Solana DEX token is falling faster than the chain it runs on. My plan is short the bounce into the $1.22 to $1.23 zone, stop above $1.32, first target $1.17, second target $1.12. 📉
Would you short RAY while SOL is still falling, or wait for SOL to find a floor first? 🤔
Futures trading is risky, trade small, manage risk, do your own research. ⚠️
Follow for more trades.
#Raydium #Crypto #FuturesTrading #TradingSignals
Direction: SHORT 🔴
Entry zone: 1.22 to 1.23
Stop loss: 1.32
Target 1: 1.17
Target 2: 1.12
Raydium is trading near $1.22 after losing 12.60 percent in 24 hours, according to CoinGecko, with a 24 hour low of $1.20 and a high of $1.42. Solana itself is down 9.91 percent to $65.48, so the whole Solana ecosystem is under pressure, and Raydium as a Solana DEX token is falling faster than the chain it runs on. My plan is short the bounce into the $1.22 to $1.23 zone, stop above $1.32, first target $1.17, second target $1.12. 📉
Would you short RAY while SOL is still falling, or wait for SOL to find a floor first? 🤔
Futures trading is risky, trade small, manage risk, do your own research. ⚠️
Follow for more trades.
#Raydium #Crypto #FuturesTrading #TradingSignals
5
·
--
Bullish
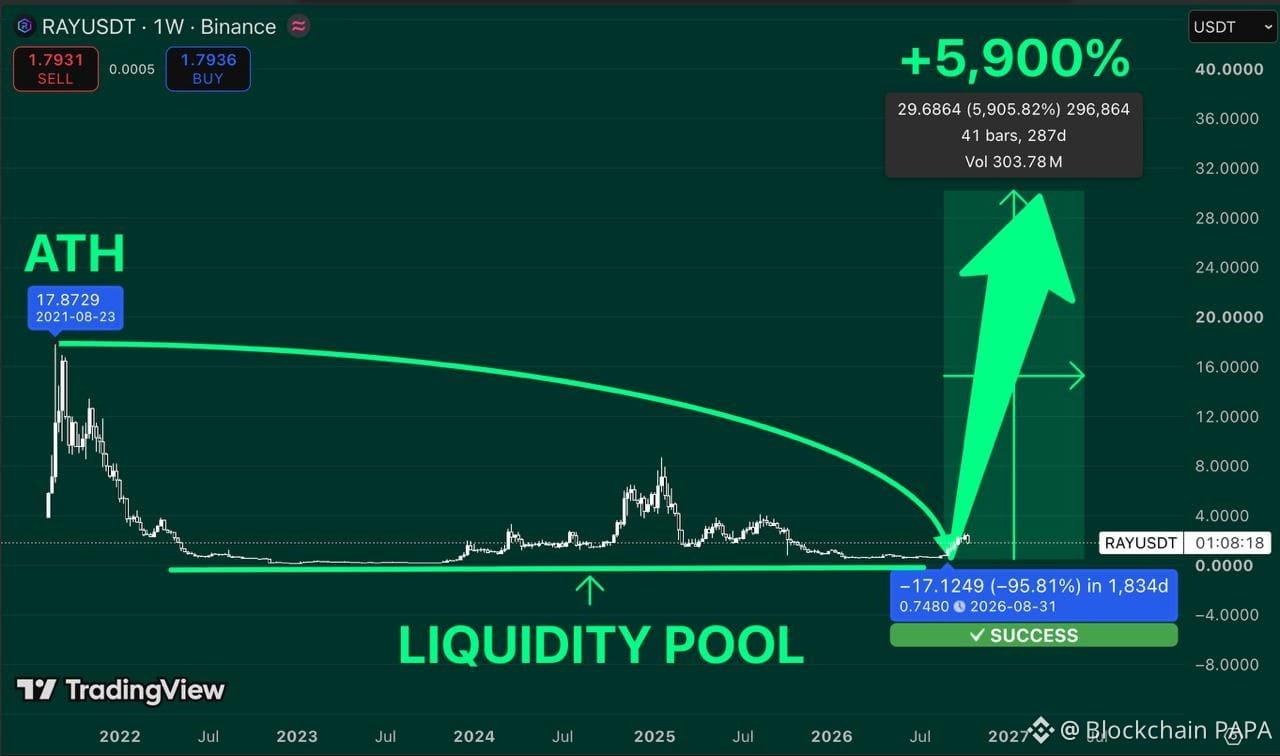
🚨 𝐃𝐎𝐍'𝐓 𝐆𝐈𝐕𝐄 𝐔𝐏 𝐎𝐍 $𝐑𝐀𝐘 𝐀 𝐌𝐀𝐉𝐎𝐑 𝐑𝐄𝐂𝐎𝐕𝐄𝐑𝐘 𝐂𝐎𝐔𝐋𝐃 𝐁𝐄 𝐂𝐎𝐌𝐈𝐍𝐆!
$RAY crashed from $17.87 to $0.75 wiping out nearly 96% of its value after years of pain the weekly chart is showing a potential turnaround as price bounces from a long term liquidity zone
Holding the bottom Recovery potential
Altcoin momentum could change everything
#Ray 💎
Bullish Target: $30
Potential Upside: +5,900
🚨 𝐃𝐎𝐍'𝐓 𝐆𝐈𝐕𝐄 𝐔𝐏 𝐎𝐍 $𝐑𝐀𝐘 𝐀 𝐌𝐀𝐉𝐎𝐑 𝐑𝐄𝐂𝐎𝐕𝐄𝐑𝐘 𝐂𝐎𝐔𝐋𝐃 𝐁𝐄 𝐂𝐎𝐌𝐈𝐍𝐆!
$RAY crashed from $17.87 to $0.75 wiping out nearly 96% of its value after years of pain the weekly chart is showing a potential turnaround as price bounces from a long term liquidity zone
Holding the bottom Recovery potential
Altcoin momentum could change everything
#Ray 💎
Bullish Target: $30
Potential Upside: +5,900
$RAY crashed from $17.87 to $0.75 wiping out nearly 96% of its value after years of pain the weekly chart is showing a potential turnaround as price bounces from a long term liquidity zone
Holding the bottom Recovery potential
Altcoin momentum could change everything
#Ray 💎
Bullish Target: $30
Potential Upside: +5,900
SIR ARSALAN:
Bro reclaiming $2 first
1
4
500
·
--
🔴 $RAY SHORT · 4h
✅ Proven · Mitigation Block, Bearish
Entry 1.2771
Target 1.2571 (−1.6%)
Stop 1.4082 (+10.3%)
Reward:risk 0.2
📊 All coins, 4h: 67% won of 318 · avg +1.6%
🪙 On RAY: 3 of 3 won
Automated chart-pattern signal. Not financial advice.
#RAY #CryptoSignals
🔴 $RAY SHORT · 4h
✅ Proven · Mitigation Block, Bearish
Entry 1.2771
Target 1.2571 (−1.6%)
Stop 1.4082 (+10.3%)
Reward:risk 0.2
📊 All coins, 4h: 67% won of 318 · avg +1.6%
🪙 On RAY: 3 of 3 won
Automated chart-pattern signal. Not financial advice.
#RAY #CryptoSignals
✅ Proven · Mitigation Block, Bearish
Entry 1.2771
Target 1.2571 (−1.6%)
Stop 1.4082 (+10.3%)
Reward:risk 0.2
📊 All coins, 4h: 67% won of 318 · avg +1.6%
🪙 On RAY: 3 of 3 won
Automated chart-pattern signal. Not financial advice.
#RAY #CryptoSignals


·
--
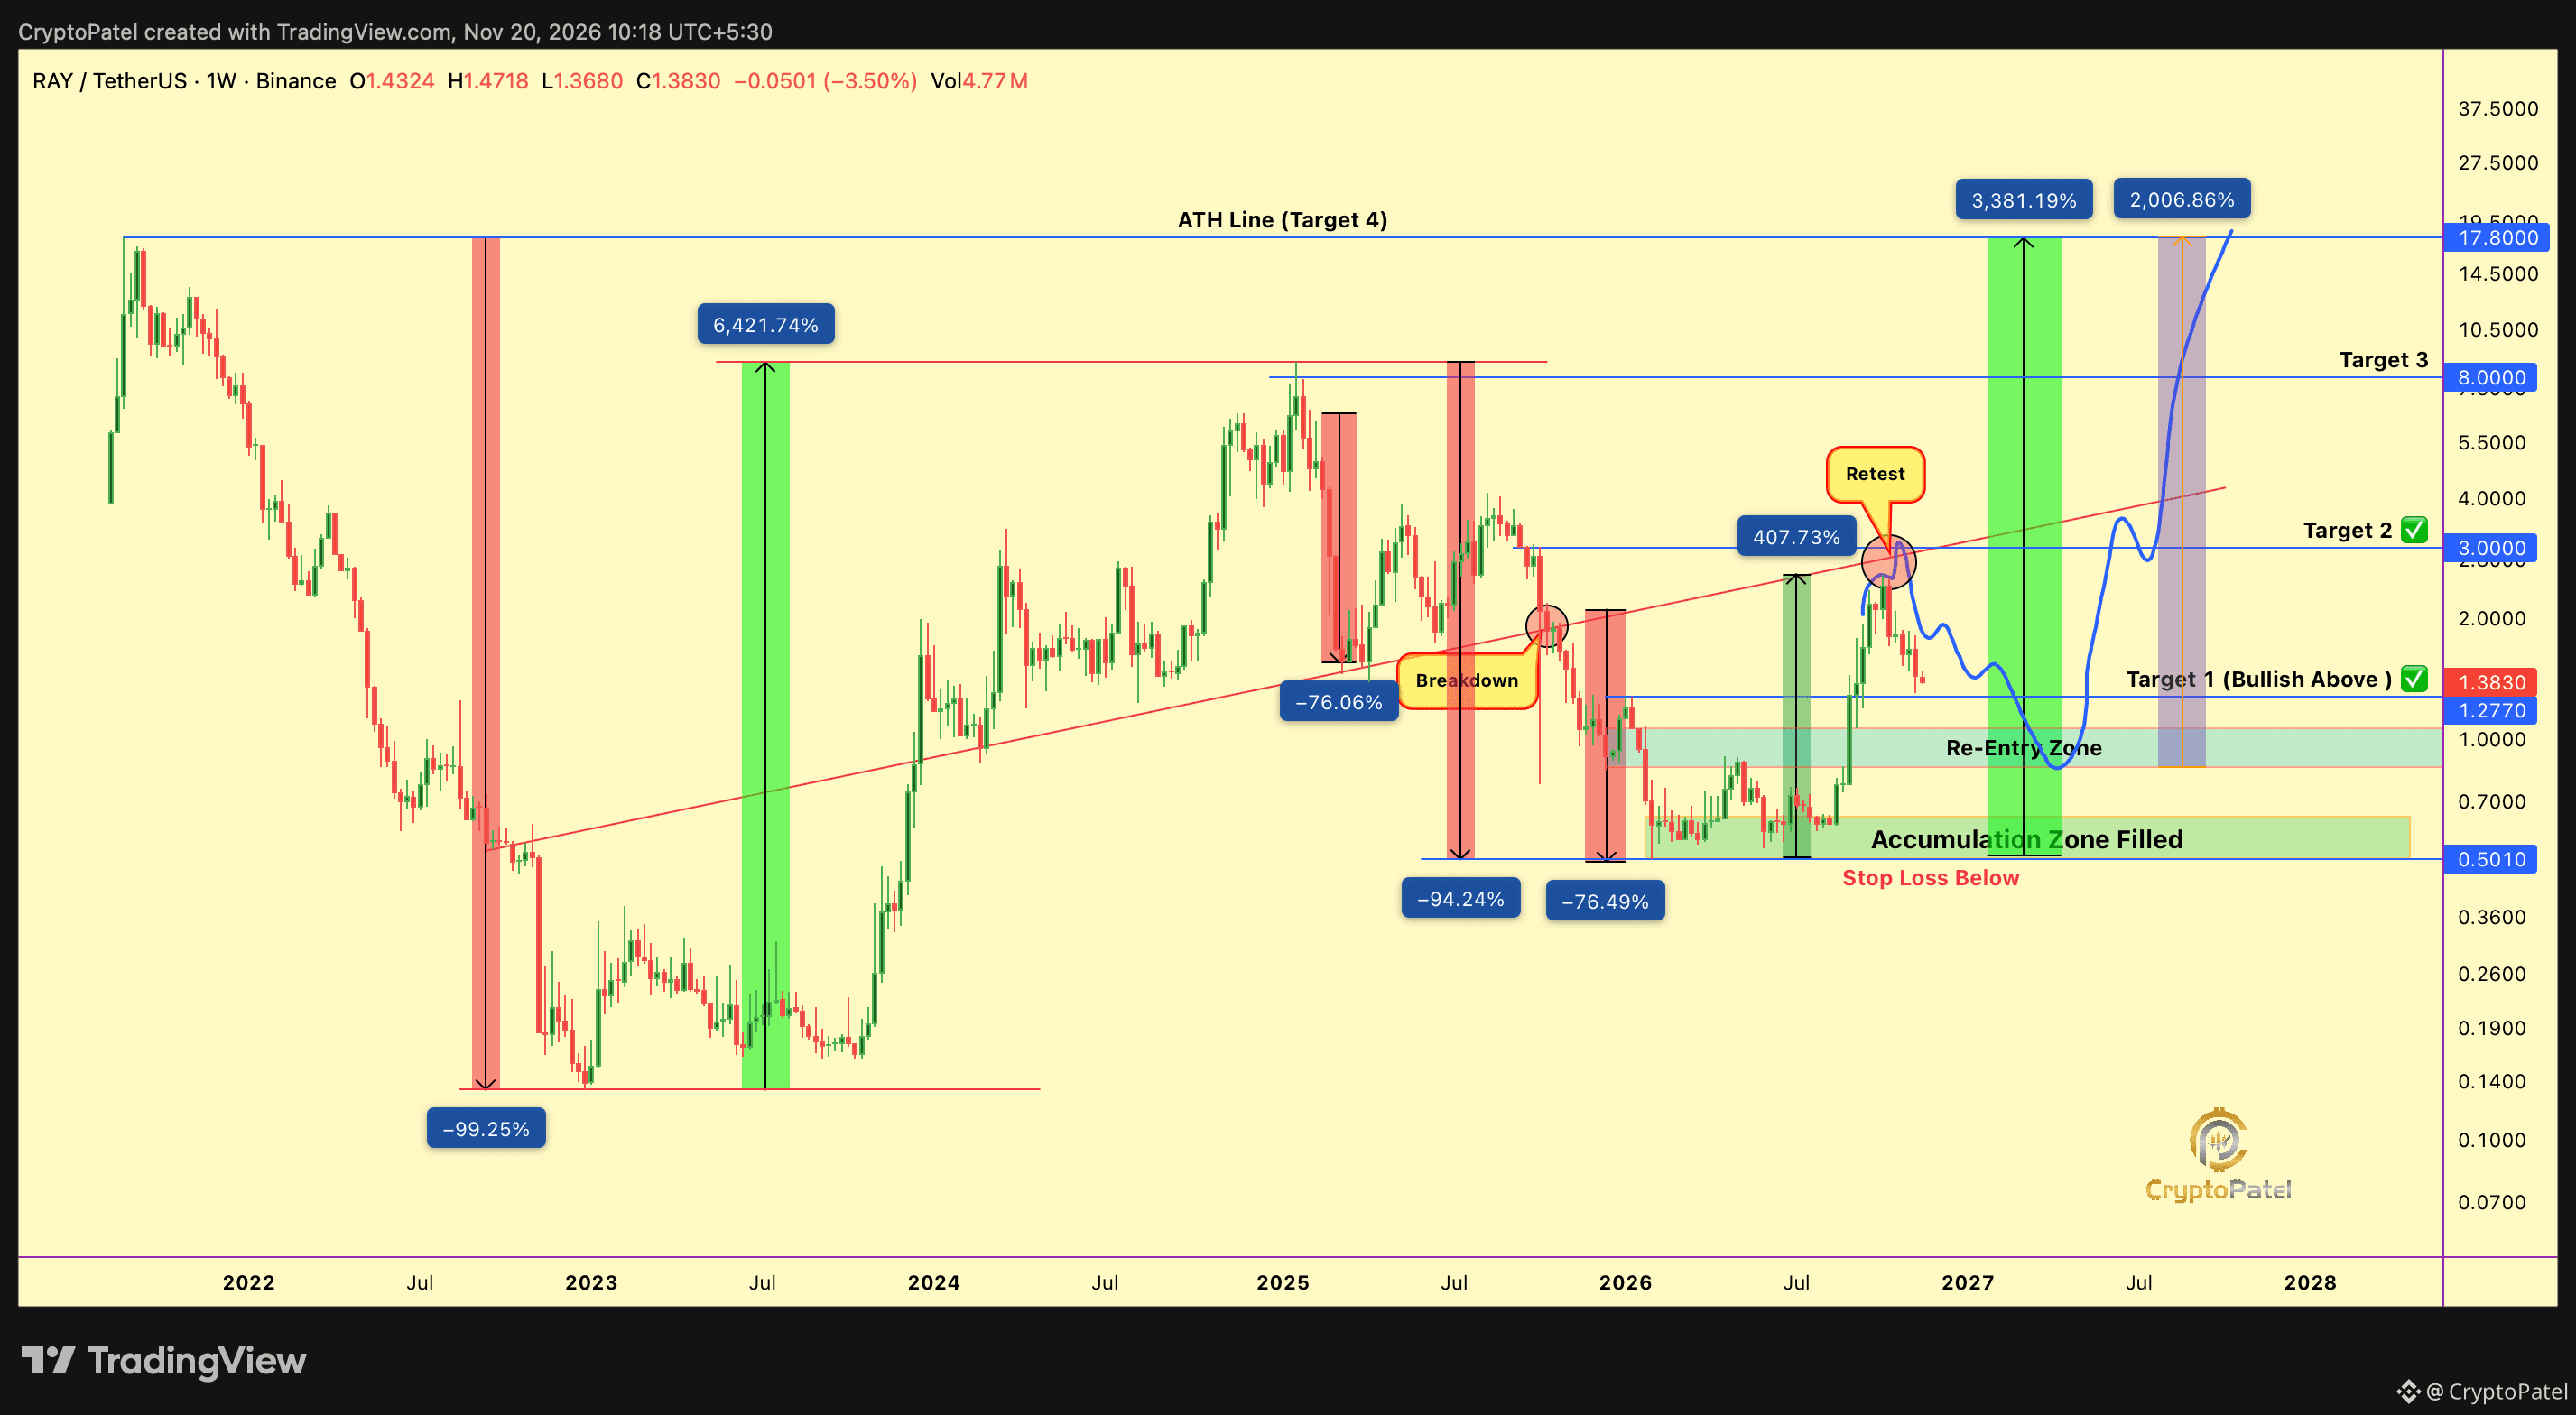
$RAY Already Delivered 407%. Now I'm Hunting for the Next 20x Opportunity.
Raydium is turning real protocol revenue into token buybacks.
🔹 30%+ of circulating supply bought back.
🔹 Q3 2026 revenue surged 264% QoQ.
🔹 $5.23M spent on buybacks in one quarter.
🔹 Fixed maximum supply: 555M.
TECHNICAL ANALYSIS:
🔹 Our first accumulation zone delivered +407% ✅
🔹 Hope you booked profits when I called the top.
🔹 #RAY is now in a retracement phase.
🔹 Approaching our next re-entry zone: $1–$0.85.
KEY SUPPORT: $0.50: Price must hold this level to maintain the broader bullish outlook.
LONG-TERM TARGETS: $3 → $8 → $10 → $15 → $20
I previously highlighted 33x potential from our main accumulation zone.
Now I'm watching for another opportunity with ~20x potential from the re-entry zone.
First move delivered. Waiting for the next one.
Bookmark these levels.
TA Only. Not Financial Advice. ALWAYS DYOR.
{spot}(RAYUSDT)
$RAY Already Delivered 407%. Now I'm Hunting for the Next 20x Opportunity.
Raydium is turning real protocol revenue into token buybacks.
🔹 30%+ of circulating supply bought back.
🔹 Q3 2026 revenue surged 264% QoQ.
🔹 $5.23M spent on buybacks in one quarter.
🔹 Fixed maximum supply: 555M.
TECHNICAL ANALYSIS:
🔹 Our first accumulation zone delivered +407% ✅
🔹 Hope you booked profits when I called the top.
🔹 #RAY is now in a retracement phase.
🔹 Approaching our next re-entry zone: $1–$0.85.
KEY SUPPORT: $0.50: Price must hold this level to maintain the broader bullish outlook.
LONG-TERM TARGETS: $3 → $8 → $10 → $15 → $20
I previously highlighted 33x potential from our main accumulation zone.
Now I'm watching for another opportunity with ~20x potential from the re-entry zone.
First move delivered. Waiting for the next one.
Bookmark these levels.
TA Only. Not Financial Advice. ALWAYS DYOR.
Raydium is turning real protocol revenue into token buybacks.
🔹 30%+ of circulating supply bought back.
🔹 Q3 2026 revenue surged 264% QoQ.
🔹 $5.23M spent on buybacks in one quarter.
🔹 Fixed maximum supply: 555M.
TECHNICAL ANALYSIS:
🔹 Our first accumulation zone delivered +407% ✅
🔹 Hope you booked profits when I called the top.
🔹 #RAY is now in a retracement phase.
🔹 Approaching our next re-entry zone: $1–$0.85.
KEY SUPPORT: $0.50: Price must hold this level to maintain the broader bullish outlook.
LONG-TERM TARGETS: $3 → $8 → $10 → $15 → $20
I previously highlighted 33x potential from our main accumulation zone.
Now I'm watching for another opportunity with ~20x potential from the re-entry zone.
First move delivered. Waiting for the next one.
Bookmark these levels.
TA Only. Not Financial Advice. ALWAYS DYOR.
3
1.6k
·
--
🔴 $RAY SHORT · 1h
✅ Proven · P&F Double Bottom Breakdown
Entry 1.2979
Target 1.2716 (−2.0%)
Stop 1.4612 (+12.6%)
Reward:risk 0.2
📊 All coins, 1h: 74% won of 789 · avg +1.8%
🪙 On RAY: 2 of 3 won
Automated chart-pattern signal. Not financial advice.
#RAY #CryptoSignals
🔴 $RAY SHORT · 1h
✅ Proven · P&F Double Bottom Breakdown
Entry 1.2979
Target 1.2716 (−2.0%)
Stop 1.4612 (+12.6%)
Reward:risk 0.2
📊 All coins, 1h: 74% won of 789 · avg +1.8%
🪙 On RAY: 2 of 3 won
Automated chart-pattern signal. Not financial advice.
#RAY #CryptoSignals
✅ Proven · P&F Double Bottom Breakdown
Entry 1.2979
Target 1.2716 (−2.0%)
Stop 1.4612 (+12.6%)
Reward:risk 0.2
📊 All coins, 1h: 74% won of 789 · avg +1.8%
🪙 On RAY: 2 of 3 won
Automated chart-pattern signal. Not financial advice.
#RAY #CryptoSignals
1

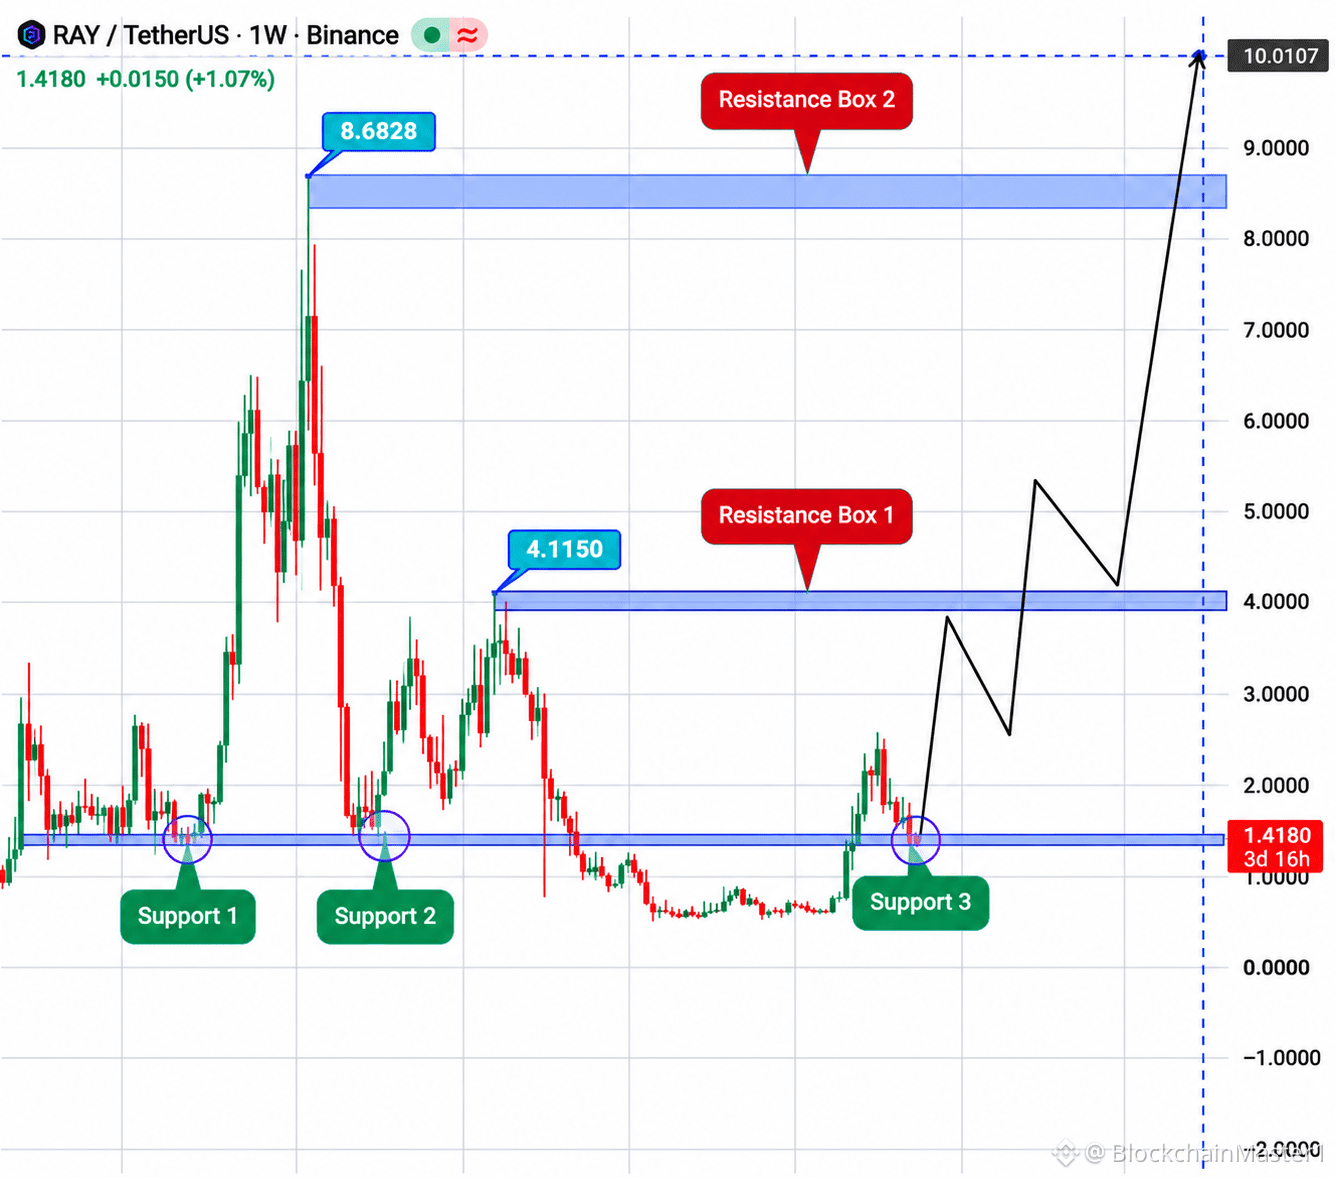
🚀 RAY (RAY/USDT) – Is a Major Bullish Breakout Coming?
Raydium is showing an interesting long-term technical setup. RAY is currently trading around $1.4161, down approximately 0.89%. Despite recent market weakness, the weekly chart suggests price is testing an important support zone that could become a potential accumulation area.
📊 Market Overview:
Current Price: $1.4161
Market Cap: $784.77 Million
Fully Diluted Market Cap: $784.77 Million
24H Volume: $22.82 Million
Market Rank: #60 Circulating Supply: 555 Million RAY
🔥 Technical Outlook:
The weekly chart shows a long-term symmetrical consolidation structure. RAY is holding near the important $1.30–$1.45 support region. A successful bounce could trigger a recovery toward the first major resistance around $4.00–$4.12. A confirmed breakout could open the door for a stronger bullish move.
🎯 Potential Entry Zone: $1.30–$1.45
🎯 Take Profit Targets:
TP1: $4.00
TP2: $5.00
TP3: $8.60
TP4: $10.00
🛑 Risk: A sustained breakdown below support could invalidate the bullish setup.
⚡ Bullish Confirmation: Strong weekly closes above resistance with increasing volume.
Could RAY reach $10 in the next major bull run?
#RAY #Raydium #CryptoAnalysis $RAY $SENT $LUNC
{spot}(LUNCUSDT)
🚀 RAY (RAY/USDT) – Is a Major Bullish Breakout Coming?
Raydium is showing an interesting long-term technical setup. RAY is currently trading around $1.4161, down approximately 0.89%. Despite recent market weakness, the weekly chart suggests price is testing an important support zone that could become a potential accumulation area.
📊 Market Overview:
Current Price: $1.4161
Market Cap: $784.77 Million
Fully Diluted Market Cap: $784.77 Million
24H Volume: $22.82 Million
Market Rank: #60 Circulating Supply: 555 Million RAY
🔥 Technical Outlook:
The weekly chart shows a long-term symmetrical consolidation structure. RAY is holding near the important $1.30–$1.45 support region. A successful bounce could trigger a recovery toward the first major resistance around $4.00–$4.12. A confirmed breakout could open the door for a stronger bullish move.
🎯 Potential Entry Zone: $1.30–$1.45
🎯 Take Profit Targets:
TP1: $4.00
TP2: $5.00
TP3: $8.60
TP4: $10.00
🛑 Risk: A sustained breakdown below support could invalidate the bullish setup.
⚡ Bullish Confirmation: Strong weekly closes above resistance with increasing volume.
Could RAY reach $10 in the next major bull run?
#RAY #Raydium #CryptoAnalysis $RAY $SENT $LUNC
Raydium is showing an interesting long-term technical setup. RAY is currently trading around $1.4161, down approximately 0.89%. Despite recent market weakness, the weekly chart suggests price is testing an important support zone that could become a potential accumulation area.
📊 Market Overview:
Current Price: $1.4161
Market Cap: $784.77 Million
Fully Diluted Market Cap: $784.77 Million
24H Volume: $22.82 Million
Market Rank: #60 Circulating Supply: 555 Million RAY
🔥 Technical Outlook:
The weekly chart shows a long-term symmetrical consolidation structure. RAY is holding near the important $1.30–$1.45 support region. A successful bounce could trigger a recovery toward the first major resistance around $4.00–$4.12. A confirmed breakout could open the door for a stronger bullish move.
🎯 Potential Entry Zone: $1.30–$1.45
🎯 Take Profit Targets:
TP1: $4.00
TP2: $5.00
TP3: $8.60
TP4: $10.00
🛑 Risk: A sustained breakdown below support could invalidate the bullish setup.
⚡ Bullish Confirmation: Strong weekly closes above resistance with increasing volume.
Could RAY reach $10 in the next major bull run?
#RAY #Raydium #CryptoAnalysis $RAY $SENT $LUNC

135

·
--
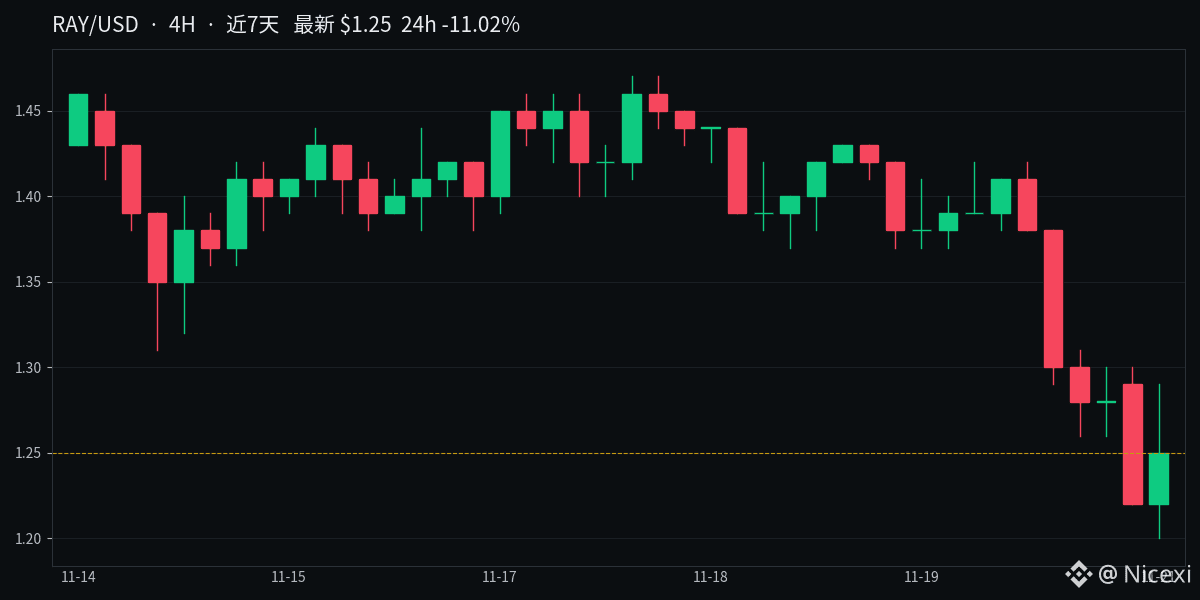
#RAY Technical Analysis: Support and Resistance
RAY has fallen sharply, down 11% in 24 hours. It’s currently at 1.25, right on the lower Bollinger Band at 1.24.
There’s one key level below: 1.20, the seven-day low. Price has tested it repeatedly over the past two days but hasn’t broken below it. If it holds, the next area to watch is around 1.37, where the Bollinger midline and MA25 are both acting as resistance. If 1.20 doesn’t hold, we’ll have to look for support further down.
The indicators also lean bearish: the moving averages are in a bearish alignment, MACD has formed a death cross, RSI is at 30.4 and nearing the oversold threshold, and trading volume has picked up. $RAY
#RAY Technical Analysis: Support and Resistance
RAY has fallen sharply, down 11% in 24 hours. It’s currently at 1.25, right on the lower Bollinger Band at 1.24.
There’s one key level below: 1.20, the seven-day low. Price has tested it repeatedly over the past two days but hasn’t broken below it. If it holds, the next area to watch is around 1.37, where the Bollinger midline and MA25 are both acting as resistance. If 1.20 doesn’t hold, we’ll have to look for support further down.
The indicators also lean bearish: the moving averages are in a bearish alignment, MACD has formed a death cross, RSI is at 30.4 and nearing the oversold threshold, and trading volume has picked up. $RAY
RAY has fallen sharply, down 11% in 24 hours. It’s currently at 1.25, right on the lower Bollinger Band at 1.24.
There’s one key level below: 1.20, the seven-day low. Price has tested it repeatedly over the past two days but hasn’t broken below it. If it holds, the next area to watch is around 1.37, where the Bollinger midline and MA25 are both acting as resistance. If 1.20 doesn’t hold, we’ll have to look for support further down.
The indicators also lean bearish: the moving averages are in a bearish alignment, MACD has formed a death cross, RSI is at 30.4 and nearing the oversold threshold, and trading volume has picked up. $RAY
30
·
--
🔴 $RAY SHORT · 1h
✅ Proven · Ascending Triangle
Entry 1.423
Target 1.3471 (−5.3%)
Stop 1.4781 (+3.9%)
Reward:risk 1.4
📊 All coins, 1h: 61% won of 155 · avg +3.3%
🪙 On RAY: no tracked trades yet
Automated chart-pattern signal. Not financial advice.
#RAY #CryptoSignals
🔴 $RAY SHORT · 1h
✅ Proven · Ascending Triangle
Entry 1.423
Target 1.3471 (−5.3%)
Stop 1.4781 (+3.9%)
Reward:risk 1.4
📊 All coins, 1h: 61% won of 155 · avg +3.3%
🪙 On RAY: no tracked trades yet
Automated chart-pattern signal. Not financial advice.
#RAY #CryptoSignals
✅ Proven · Ascending Triangle
Entry 1.423
Target 1.3471 (−5.3%)
Stop 1.4781 (+3.9%)
Reward:risk 1.4
📊 All coins, 1h: 61% won of 155 · avg +3.3%
🪙 On RAY: no tracked trades yet
Automated chart-pattern signal. Not financial advice.
#RAY #CryptoSignals
12

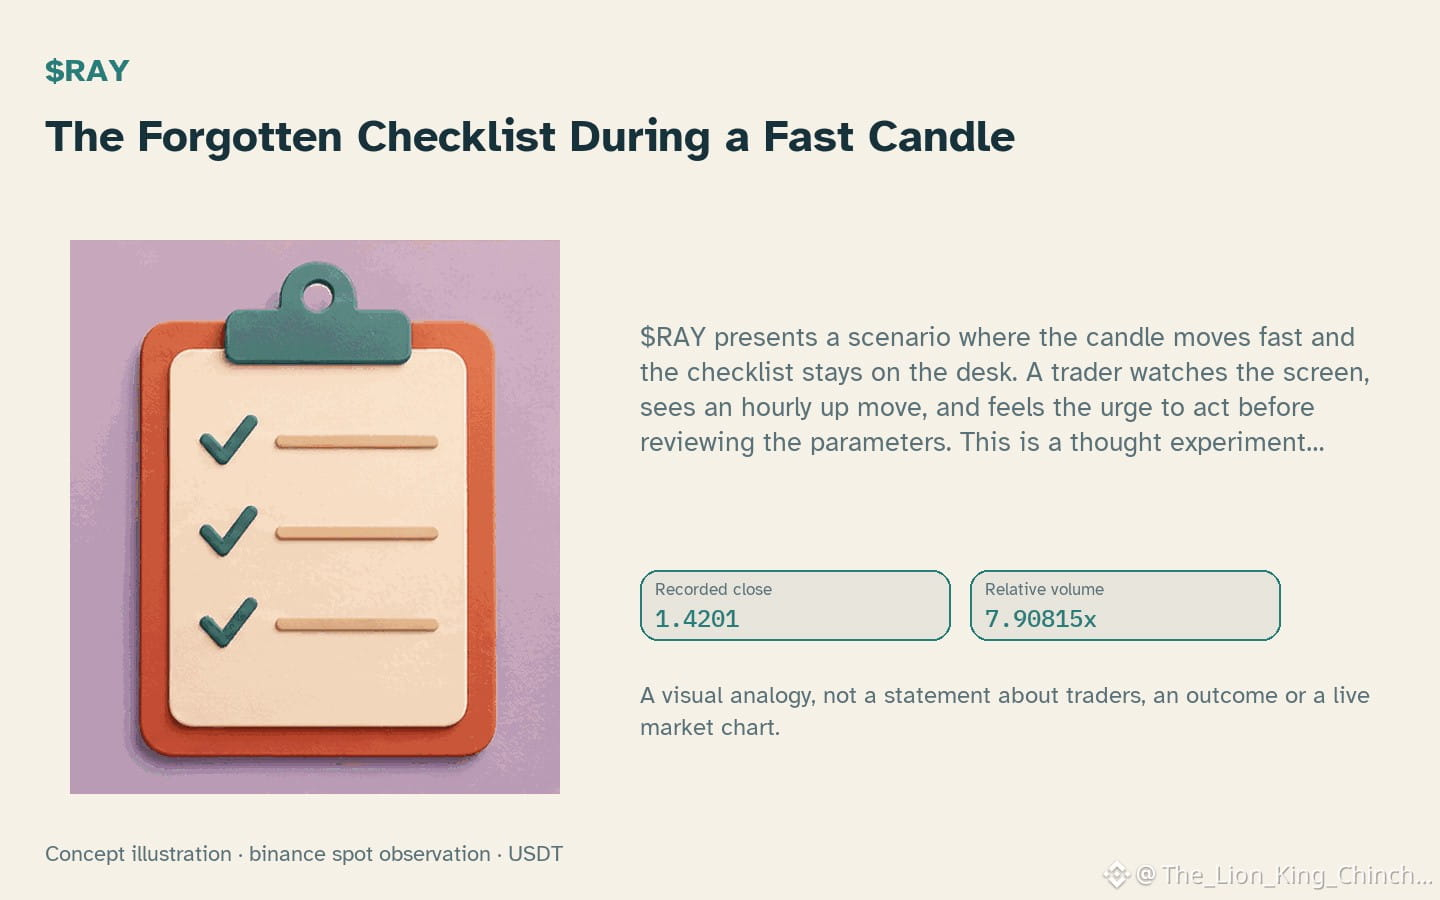
$RAY: The Forgotten Checklist During a Fast Candle
$RAY presents a scenario where the candle moves fast and the checklist stays on the desk. A trader watches the screen, sees an hourly up move, and feels the urge to act before reviewing the parameters. This is a thought experiment about a hypothetical mechanism, not a description of actual behavior. The candle closes above the local resistance level while volume sits at 7.91x baseline. The RSI reads 60.2. These are recorded observations, not predictions. The mechanism in question is a forgotten checklist: a set of conditions that should be reviewed before committing capital. One condition is whether the move aligns with the broader trend. Another is whether the volume confirms the move. A third is whether the risk-reward ratio is acceptable. In the current observation, the hourly change is 0.155159% and the daily change is -2.57272%. The candle is inside the recorded range. The volume is above baseline. The RSI is at 60.2. These facts alone do not confirm a trend or a reversal. They are inputs to a decision framework. A counterexample would be a candle that moves in the same direction but with volume below baseline and RSI at an extreme. In that case, the checklist would suggest caution. The self-check is to ask whether the checklist was reviewed before the decision. If the answer is no, the lesson is that the checklist is not a suggestion but a requirement. The reassessment condition is to wait for the next closed candle and re-evaluate the volume and RSI. If the volume remains above baseline and the RSI stays within bounds, the interpretation may hold. If not, the interpretation should be revised. The limits of this analysis are that candles and volume alone cannot confirm motives or causation. The observation is a snapshot, not a forecast.
Probabilistic market research, not a recommendation or guaranteed return.
A useful rule or a familiar shortcut?
#RAY #LearnCrypto #CryptoLearning
$RAY : The Forgotten Checklist During a Fast Candle
$RAY presents a scenario where the candle moves fast and the checklist stays on the desk. A trader watches the screen, sees an hourly up move, and feels the urge to act before reviewing the parameters. This is a thought experiment about a hypothetical mechanism, not a description of actual behavior. The candle closes above the local resistance level while volume sits at 7.91x baseline. The RSI reads 60.2. These are recorded observations, not predictions. The mechanism in question is a forgotten checklist: a set of conditions that should be reviewed before committing capital. One condition is whether the move aligns with the broader trend. Another is whether the volume confirms the move. A third is whether the risk-reward ratio is acceptable. In the current observation, the hourly change is 0.155159% and the daily change is -2.57272%. The candle is inside the recorded range. The volume is above baseline. The RSI is at 60.2. These facts alone do not confirm a trend or a reversal. They are inputs to a decision framework. A counterexample would be a candle that moves in the same direction but with volume below baseline and RSI at an extreme. In that case, the checklist would suggest caution. The self-check is to ask whether the checklist was reviewed before the decision. If the answer is no, the lesson is that the checklist is not a suggestion but a requirement. The reassessment condition is to wait for the next closed candle and re-evaluate the volume and RSI. If the volume remains above baseline and the RSI stays within bounds, the interpretation may hold. If not, the interpretation should be revised. The limits of this analysis are that candles and volume alone cannot confirm motives or causation. The observation is a snapshot, not a forecast.
Probabilistic market research, not a recommendation or guaranteed return.
A useful rule or a familiar shortcut?
#RAY #LearnCrypto #CryptoLearning
$RAY presents a scenario where the candle moves fast and the checklist stays on the desk. A trader watches the screen, sees an hourly up move, and feels the urge to act before reviewing the parameters. This is a thought experiment about a hypothetical mechanism, not a description of actual behavior. The candle closes above the local resistance level while volume sits at 7.91x baseline. The RSI reads 60.2. These are recorded observations, not predictions. The mechanism in question is a forgotten checklist: a set of conditions that should be reviewed before committing capital. One condition is whether the move aligns with the broader trend. Another is whether the volume confirms the move. A third is whether the risk-reward ratio is acceptable. In the current observation, the hourly change is 0.155159% and the daily change is -2.57272%. The candle is inside the recorded range. The volume is above baseline. The RSI is at 60.2. These facts alone do not confirm a trend or a reversal. They are inputs to a decision framework. A counterexample would be a candle that moves in the same direction but with volume below baseline and RSI at an extreme. In that case, the checklist would suggest caution. The self-check is to ask whether the checklist was reviewed before the decision. If the answer is no, the lesson is that the checklist is not a suggestion but a requirement. The reassessment condition is to wait for the next closed candle and re-evaluate the volume and RSI. If the volume remains above baseline and the RSI stays within bounds, the interpretation may hold. If not, the interpretation should be revised. The limits of this analysis are that candles and volume alone cannot confirm motives or causation. The observation is a snapshot, not a forecast.
Probabilistic market research, not a recommendation or guaranteed return.
A useful rule or a familiar shortcut?
#RAY #LearnCrypto #CryptoLearning
210

·
--
Bullish
A major milestone for Raydium: surpassing $8 billion in tokenized stock trading volume on Solana!
Raydium has officially announced a historic milestone, surpassing $8 billion in cumulative tokenized stock trading volume on the Solana network.
Impact on the RAY token:
This tremendous growth and high liquidity reflect the platform’s strong expansion beyond traditional trading and its significant entry into the tokenized assets sector (Tokenized Stocks). This achievement strengthens the platform’s ecosystem, increases use of its token, and positively impacts its market value as one of the key pillars of liquidity on the Solana network.
#Ray #raydium #DAB3_1997
#CryptoSelloffTriggersMultipleWhaleLiquidations
$RAY $RAYSOL
{future}(RAYSOLUSDT)
{spot}(RAYUSDT)
A major milestone for Raydium: surpassing $8 billion in tokenized stock trading volume on Solana!
Raydium has officially announced a historic milestone, surpassing $8 billion in cumulative tokenized stock trading volume on the Solana network.
Impact on the RAY token:
This tremendous growth and high liquidity reflect the platform’s strong expansion beyond traditional trading and its significant entry into the tokenized assets sector (Tokenized Stocks). This achievement strengthens the platform’s ecosystem, increases use of its token, and positively impacts its market value as one of the key pillars of liquidity on the Solana network.
#Ray #raydium #DAB3_1997
#CryptoSelloffTriggersMultipleWhaleLiquidations
$RAY $RAYSOL
Raydium has officially announced a historic milestone, surpassing $8 billion in cumulative tokenized stock trading volume on the Solana network.
Impact on the RAY token:
This tremendous growth and high liquidity reflect the platform’s strong expansion beyond traditional trading and its significant entry into the tokenized assets sector (Tokenized Stocks). This achievement strengthens the platform’s ecosystem, increases use of its token, and positively impacts its market value as one of the key pillars of liquidity on the Solana network.
#Ray #raydium #DAB3_1997
#CryptoSelloffTriggersMultipleWhaleLiquidations
$RAY $RAYSOL
1
16
$RAY: When RSI Diverges From Price Across Two Range Tests
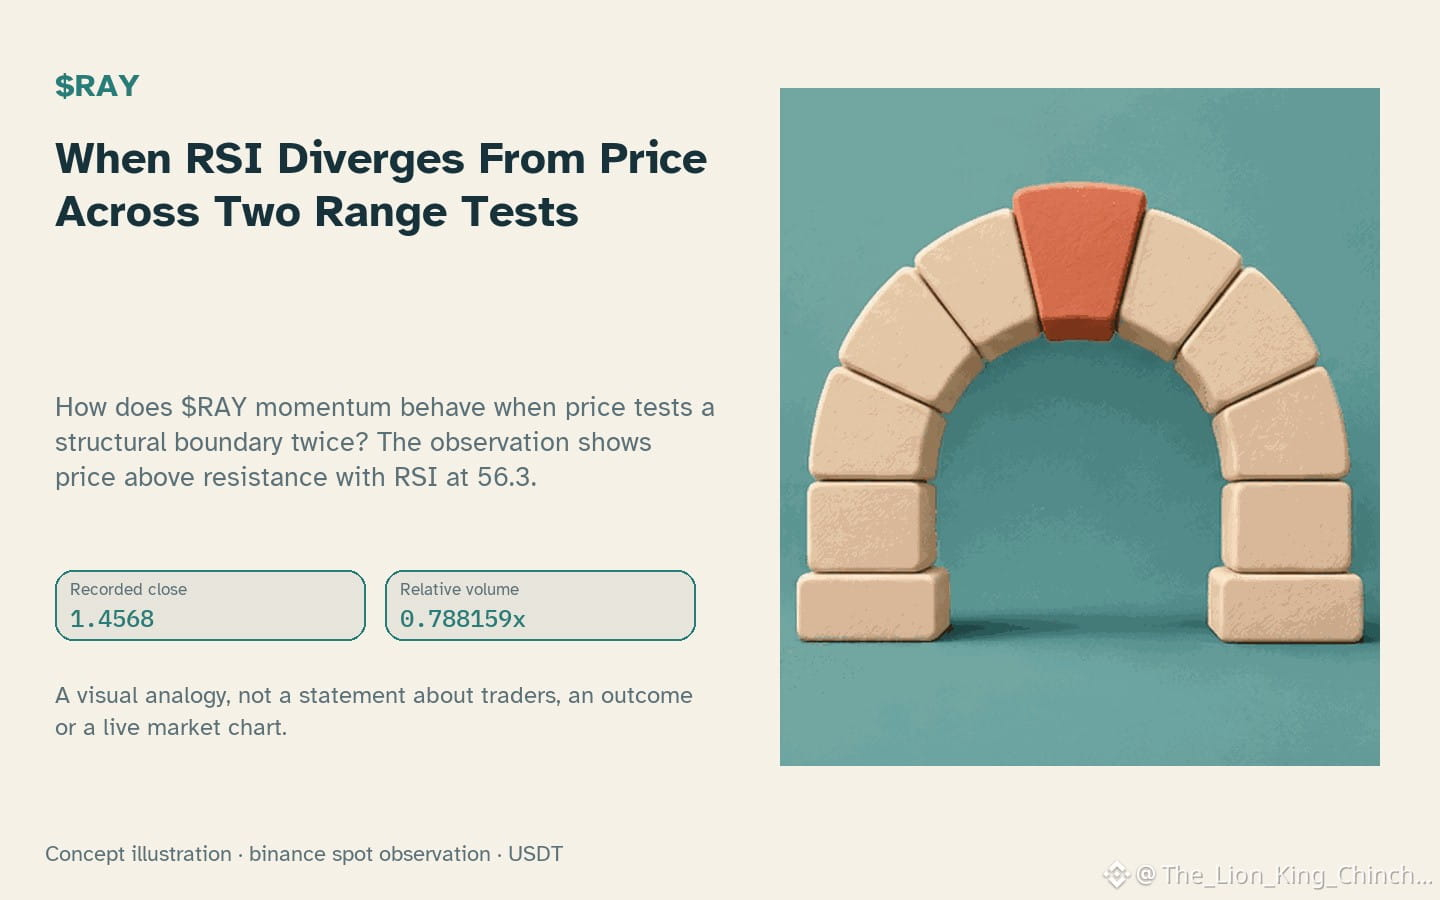
How does $RAY momentum behave when price tests a structural boundary twice? The observation shows price above resistance with RSI at 56.3.
Structure Check
A hypothetical mechanism suggests that if price makes a higher high at the same boundary, but RSI fails to make a higher high, this represents relative weakening pressure. This is not a confirmed signal. It is a conditional pattern. In this snapshot, relative volume is at 0.79x baseline, which is not above baseline. Low volume during a test often means the move lacks broad participation. If the next candle closes cleanly above resistance with sustained volume, the structure holds. If it retests and closes back below, the divergence becomes more significant.
Alternative Reading
Price staying above resistance could simply be noise. A single upper wick or gap might create a false break. The MACD histogram at 6.98705e-05 versus its signal line at -0.00218244 provides context but does not guarantee direction. If the next hourly change is 0.475895%, it confirms current momentum. However, if price reverses sharply, the initial divergence was not meaningful. This shows why we must wait for closed candles before claiming a break.
Limits and Self-Counterexample
This analysis relies solely on the stored observation at the current timestamp. It does not prove who bought or sold. It does not measure order flow or hidden liquidity. A counterexample occurs if price breaks out and immediately re-enters the range. In that case, the "divergence" was just a fakeout. To reassess, check if the next daily change exceeds -5.4026% in the same direction. If volume remains flat, the structural claim is weak. Do not interpret this as a prediction. Treat it as a hypothesis to be tested by future data.
Probabilistic market research, not a recommendation or guaranteed return.
#RAY #MarketAnalysis
$RAY : When RSI Diverges From Price Across Two Range Tests
How does $RAY momentum behave when price tests a structural boundary twice? The observation shows price above resistance with RSI at 56.3.
Structure Check
A hypothetical mechanism suggests that if price makes a higher high at the same boundary, but RSI fails to make a higher high, this represents relative weakening pressure. This is not a confirmed signal. It is a conditional pattern. In this snapshot, relative volume is at 0.79x baseline, which is not above baseline. Low volume during a test often means the move lacks broad participation. If the next candle closes cleanly above resistance with sustained volume, the structure holds. If it retests and closes back below, the divergence becomes more significant.
Alternative Reading
Price staying above resistance could simply be noise. A single upper wick or gap might create a false break. The MACD histogram at 6.98705e-05 versus its signal line at -0.00218244 provides context but does not guarantee direction. If the next hourly change is 0.475895%, it confirms current momentum. However, if price reverses sharply, the initial divergence was not meaningful. This shows why we must wait for closed candles before claiming a break.
Limits and Self-Counterexample
This analysis relies solely on the stored observation at the current timestamp. It does not prove who bought or sold. It does not measure order flow or hidden liquidity. A counterexample occurs if price breaks out and immediately re-enters the range. In that case, the "divergence" was just a fakeout. To reassess, check if the next daily change exceeds -5.4026% in the same direction. If volume remains flat, the structural claim is weak. Do not interpret this as a prediction. Treat it as a hypothesis to be tested by future data.
Probabilistic market research, not a recommendation or guaranteed return.
#RAY #MarketAnalysis
How does $RAY momentum behave when price tests a structural boundary twice? The observation shows price above resistance with RSI at 56.3.
Structure Check
A hypothetical mechanism suggests that if price makes a higher high at the same boundary, but RSI fails to make a higher high, this represents relative weakening pressure. This is not a confirmed signal. It is a conditional pattern. In this snapshot, relative volume is at 0.79x baseline, which is not above baseline. Low volume during a test often means the move lacks broad participation. If the next candle closes cleanly above resistance with sustained volume, the structure holds. If it retests and closes back below, the divergence becomes more significant.
Alternative Reading
Price staying above resistance could simply be noise. A single upper wick or gap might create a false break. The MACD histogram at 6.98705e-05 versus its signal line at -0.00218244 provides context but does not guarantee direction. If the next hourly change is 0.475895%, it confirms current momentum. However, if price reverses sharply, the initial divergence was not meaningful. This shows why we must wait for closed candles before claiming a break.
Limits and Self-Counterexample
This analysis relies solely on the stored observation at the current timestamp. It does not prove who bought or sold. It does not measure order flow or hidden liquidity. A counterexample occurs if price breaks out and immediately re-enters the range. In that case, the "divergence" was just a fakeout. To reassess, check if the next daily change exceeds -5.4026% in the same direction. If volume remains flat, the structural claim is weak. Do not interpret this as a prediction. Treat it as a hypothesis to be tested by future data.
Probabilistic market research, not a recommendation or guaranteed return.
#RAY #MarketAnalysis
40
$RAY: Does One Feed Represent All?
Does $RAY data from one venue answer trading questions? The choice frames uncertainty.
The Research Dilemma
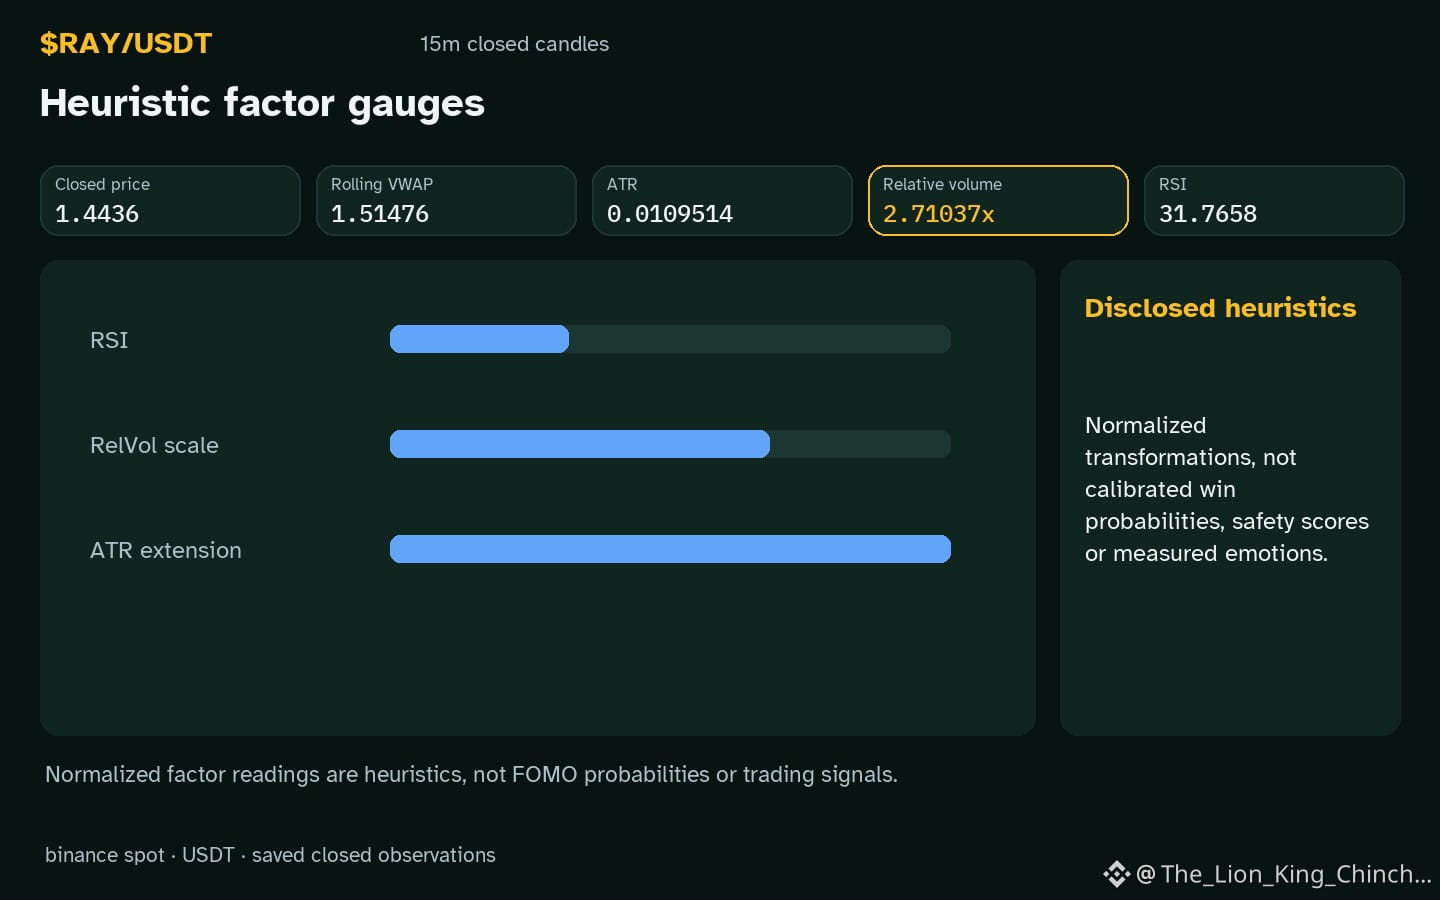
Public metrics often feel definitive. A reader sees relative volume 2.71x and RSI 31.8. These point to a specific state. They do not reveal global intent. One exchange is a single vantage point. Other venues hold different orders. Treating a single slice as truth creates false confidence.
The Trade-off
Imagine a rule. If hourly direction is down during active trading signals, the signal is deemed strong or weak. This depends on the feed. Higher confidence comes from one source. Clarity comes from admitting limits. Every extra source adds noise. Every single source risks ignorance. Selecting wide or narrow data shifts the conclusion on the same chart. The mechanism favors precision but hides bias. The bias is not honesty but scope. It matters for any asset, not just $RAY.
A Rule Worth Testing
Ask a self-check question. Would the conclusion survive if the data came from another desk? If no, name the limitation. A counterexample shows this clearly. If a desk shows buying while another rests, the truth sits between them. The check is simple. State the source. Then state the possible conflict. This keeps the analysis honest.
The mechanism survives by naming the container. The source defines the view. The view frames the limits. A broader lens lowers confidence but improves reliability. Better to be less sure and more accurate. Better to claim less and see more. Time is precious. Trust is harder to earn. Ask the question. Check the limits. Stay humble.
Probabilistic market research, not a recommendation or guaranteed return.
#RAY #CryptoCommunity #CryptoLearning
$RAY : Does One Feed Represent All?
Does $RAY data from one venue answer trading questions? The choice frames uncertainty.
The Research Dilemma
Public metrics often feel definitive. A reader sees relative volume 2.71x and RSI 31.8. These point to a specific state. They do not reveal global intent. One exchange is a single vantage point. Other venues hold different orders. Treating a single slice as truth creates false confidence.
The Trade-off
Imagine a rule. If hourly direction is down during active trading signals, the signal is deemed strong or weak. This depends on the feed. Higher confidence comes from one source. Clarity comes from admitting limits. Every extra source adds noise. Every single source risks ignorance. Selecting wide or narrow data shifts the conclusion on the same chart. The mechanism favors precision but hides bias. The bias is not honesty but scope. It matters for any asset, not just $RAY .
A Rule Worth Testing
Ask a self-check question. Would the conclusion survive if the data came from another desk? If no, name the limitation. A counterexample shows this clearly. If a desk shows buying while another rests, the truth sits between them. The check is simple. State the source. Then state the possible conflict. This keeps the analysis honest.
The mechanism survives by naming the container. The source defines the view. The view frames the limits. A broader lens lowers confidence but improves reliability. Better to be less sure and more accurate. Better to claim less and see more. Time is precious. Trust is harder to earn. Ask the question. Check the limits. Stay humble.
Probabilistic market research, not a recommendation or guaranteed return.
#RAY #CryptoCommunity #CryptoLearning
Does $RAY data from one venue answer trading questions? The choice frames uncertainty.
The Research Dilemma
Public metrics often feel definitive. A reader sees relative volume 2.71x and RSI 31.8. These point to a specific state. They do not reveal global intent. One exchange is a single vantage point. Other venues hold different orders. Treating a single slice as truth creates false confidence.
The Trade-off
Imagine a rule. If hourly direction is down during active trading signals, the signal is deemed strong or weak. This depends on the feed. Higher confidence comes from one source. Clarity comes from admitting limits. Every extra source adds noise. Every single source risks ignorance. Selecting wide or narrow data shifts the conclusion on the same chart. The mechanism favors precision but hides bias. The bias is not honesty but scope. It matters for any asset, not just $RAY .
A Rule Worth Testing
Ask a self-check question. Would the conclusion survive if the data came from another desk? If no, name the limitation. A counterexample shows this clearly. If a desk shows buying while another rests, the truth sits between them. The check is simple. State the source. Then state the possible conflict. This keeps the analysis honest.
The mechanism survives by naming the container. The source defines the view. The view frames the limits. A broader lens lowers confidence but improves reliability. Better to be less sure and more accurate. Better to claim less and see more. Time is precious. Trust is harder to earn. Ask the question. Check the limits. Stay humble.
Probabilistic market research, not a recommendation or guaranteed return.
#RAY #CryptoCommunity #CryptoLearning
31
$RAY: Why Pausing Your Analysis May Yield a Cleaner Entry
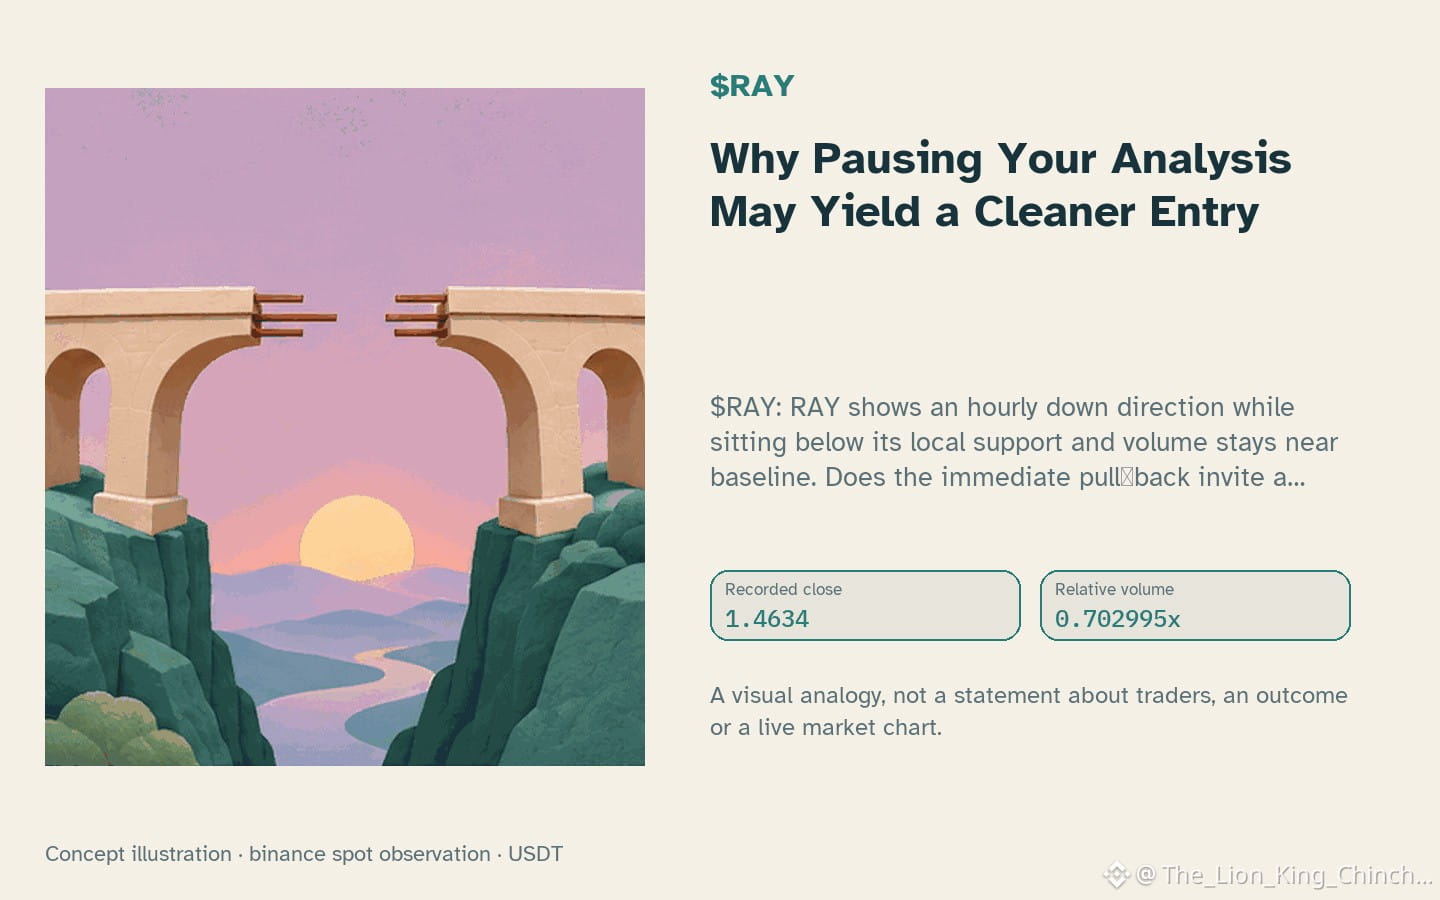
$RAY: RAY shows an hourly down direction while sitting below its local support and volume stays near baseline. Does the immediate pull‑back invite a hurried entry, or would a brief pause clarify the trade‑off between entry quality and chasing a move?
The dilemma centers on timing. Imagine two hypothetical traders: one places a limit just above the recent low as soon as the down bar closes, hoping to catch a rebound. The other waits for the price to retest the support zone, confirming that the down pressure has eased before committing. Both face the same observation – the price is below support and volume offers no extra confirmation – yet their outcomes differ based on how they balance immediacy against confirmation.
A practical rule to test is to measure entry quality by the distance between the entry point and the nearest support level, while the cost of chasing is reflected in the extra risk taken if the price continues lower. If the trader enters early, the stop may need to be set wider, increasing potential loss. Waiting a few candles could tighten the stop but also risk missing the move entirely.
The hypothesis can be invalidated if a subsequent hourly candle closes above the support level with a clear reversal pattern, showing that the early entry would have been unnecessary. Conversely, if the price breaks further down and the support holds, the delayed entry gains merit. Monitoring the next closed hourly candle will therefore provide a concrete reassessment condition.
Probabilistic market research, not a recommendation or guaranteed return.
#RAY #RiskManagement #CryptoLearning
$RAY : Why Pausing Your Analysis May Yield a Cleaner Entry
$RAY : RAY shows an hourly down direction while sitting below its local support and volume stays near baseline. Does the immediate pull‑back invite a hurried entry, or would a brief pause clarify the trade‑off between entry quality and chasing a move?
The dilemma centers on timing. Imagine two hypothetical traders: one places a limit just above the recent low as soon as the down bar closes, hoping to catch a rebound. The other waits for the price to retest the support zone, confirming that the down pressure has eased before committing. Both face the same observation – the price is below support and volume offers no extra confirmation – yet their outcomes differ based on how they balance immediacy against confirmation.
A practical rule to test is to measure entry quality by the distance between the entry point and the nearest support level, while the cost of chasing is reflected in the extra risk taken if the price continues lower. If the trader enters early, the stop may need to be set wider, increasing potential loss. Waiting a few candles could tighten the stop but also risk missing the move entirely.
The hypothesis can be invalidated if a subsequent hourly candle closes above the support level with a clear reversal pattern, showing that the early entry would have been unnecessary. Conversely, if the price breaks further down and the support holds, the delayed entry gains merit. Monitoring the next closed hourly candle will therefore provide a concrete reassessment condition.
Probabilistic market research, not a recommendation or guaranteed return.
#RAY #RiskManagement #CryptoLearning
$RAY : RAY shows an hourly down direction while sitting below its local support and volume stays near baseline. Does the immediate pull‑back invite a hurried entry, or would a brief pause clarify the trade‑off between entry quality and chasing a move?
The dilemma centers on timing. Imagine two hypothetical traders: one places a limit just above the recent low as soon as the down bar closes, hoping to catch a rebound. The other waits for the price to retest the support zone, confirming that the down pressure has eased before committing. Both face the same observation – the price is below support and volume offers no extra confirmation – yet their outcomes differ based on how they balance immediacy against confirmation.
A practical rule to test is to measure entry quality by the distance between the entry point and the nearest support level, while the cost of chasing is reflected in the extra risk taken if the price continues lower. If the trader enters early, the stop may need to be set wider, increasing potential loss. Waiting a few candles could tighten the stop but also risk missing the move entirely.
The hypothesis can be invalidated if a subsequent hourly candle closes above the support level with a clear reversal pattern, showing that the early entry would have been unnecessary. Conversely, if the price breaks further down and the support holds, the delayed entry gains merit. Monitoring the next closed hourly candle will therefore provide a concrete reassessment condition.
Probabilistic market research, not a recommendation or guaranteed return.
#RAY #RiskManagement #CryptoLearning
64

·
--
Bullish
🟢 $RAY BUY 🟢
{future}(RAYSOLUSDT)
📍 ENTRY: 1.4854-1.5142
🎯 TARGETS:
💰 1.5193
💰 1.5393
💰 1.6030
🛑 STOP: 1.4776
🚀 KEY SUPPORT BOUNCE — RAY BULLS ARE LOOKING FOR A REVERSAL
$RAY is reacting from key support, putting the upside levels in focus. 👀
⚡ Support defense → bullish continuation on watch.
📈 Confirmation remains key.
#RAY #RAYUSDT #CryptoSignals #TradingSignals #FuturesSignals #LongSignal
🟢 $RAY BUY 🟢
📍 ENTRY: 1.4854-1.5142
🎯 TARGETS:
💰 1.5193
💰 1.5393
💰 1.6030
🛑 STOP: 1.4776
🚀 KEY SUPPORT BOUNCE — RAY BULLS ARE LOOKING FOR A REVERSAL
$RAY is reacting from key support, putting the upside levels in focus. 👀
⚡ Support defense → bullish continuation on watch.
📈 Confirmation remains key.
#RAY #RAYUSDT #CryptoSignals #TradingSignals #FuturesSignals #LongSignal
📍 ENTRY: 1.4854-1.5142
🎯 TARGETS:
💰 1.5193
💰 1.5393
💰 1.6030
🛑 STOP: 1.4776
🚀 KEY SUPPORT BOUNCE — RAY BULLS ARE LOOKING FOR A REVERSAL
$RAY is reacting from key support, putting the upside levels in focus. 👀
⚡ Support defense → bullish continuation on watch.
📈 Confirmation remains key.
#RAY #RAYUSDT #CryptoSignals #TradingSignals #FuturesSignals #LongSignal
187

·
--
RAY buy pressure is strengthening.
Buy Share
15m 85.7% | 1h 66.1%
4h 60.3% | 12h 49.0% | 1D 48.4%
15m Flow
Buy $78.49K | Sell $13.15K
Net +$65.34K | B/S 5.97
Cash Share 0.5%
Market
12h 48.8% | 1D 50.3%
Order Book: Ask-heavy (0.84)
Buy-side flow is strong, while order-book depth remains ask-heavy.
RADAVOX Market Intelligence
#RAY #Crypto
RAY buy pressure is strengthening.
Buy Share
15m 85.7% | 1h 66.1%
4h 60.3% | 12h 49.0% | 1D 48.4%
15m Flow
Buy $78.49K | Sell $13.15K
Net +$65.34K | B/S 5.97
Cash Share 0.5%
Market
12h 48.8% | 1D 50.3%
Order Book: Ask-heavy (0.84)
Buy-side flow is strong, while order-book depth remains ask-heavy.
RADAVOX Market Intelligence
#RAY #Crypto
Buy Share
15m 85.7% | 1h 66.1%
4h 60.3% | 12h 49.0% | 1D 48.4%
15m Flow
Buy $78.49K | Sell $13.15K
Net +$65.34K | B/S 5.97
Cash Share 0.5%
Market
12h 48.8% | 1D 50.3%
Order Book: Ask-heavy (0.84)
Buy-side flow is strong, while order-book depth remains ask-heavy.
RADAVOX Market Intelligence
#RAY #Crypto
6

·
--
$RAY or $JUP for the next leg? Only one.
RAY is $1.66 after getting hit 7.47% today, with the 4h window down 7.8%. Ugly chart. 📉
Price sits below the 20d and 50d MAs, RSI is 41, and volume is just $2.22M, only 0.6x its 20d average. This is not a tape I want to chase, especially while $ETH sets the mood.
At $1.66, I want a reclaim. Lose it and I’m staying out. Funding is flat at 0.000%. ⚡
Pick your side. 👀
#RAY #Crypto #Binance
$RAY or $JUP for the next leg? Only one.
RAY is $1.66 after getting hit 7.47% today, with the 4h window down 7.8%. Ugly chart. 📉
Price sits below the 20d and 50d MAs, RSI is 41, and volume is just $2.22M, only 0.6x its 20d average. This is not a tape I want to chase, especially while $ETH sets the mood.
At $1.66, I want a reclaim. Lose it and I’m staying out. Funding is flat at 0.000%. ⚡
Pick your side. 👀
#RAY #Crypto #Binance
RAY is $1.66 after getting hit 7.47% today, with the 4h window down 7.8%. Ugly chart. 📉
Price sits below the 20d and 50d MAs, RSI is 41, and volume is just $2.22M, only 0.6x its 20d average. This is not a tape I want to chase, especially while $ETH sets the mood.
At $1.66, I want a reclaim. Lose it and I’m staying out. Funding is flat at 0.000%. ⚡
Pick your side. 👀
#RAY #Crypto #Binance
11
·
--
Bullish
🟢 $RAY BUY 🟢
{future}(RAYSOLUSDT)
📍 ENTRY: 1.6518-1.6911
🎯 TARGETS:
💰 1.7134
💰 1.7279
💰 1.8701
🛑 STOP: 1.6358
🚀 KEY SUPPORT BOUNCE — RAY BULLS ARE LOOKING FOR A REVERSAL
$RAY is reacting from key support, putting the upside levels in focus. 👀
⚡ Support defense → bullish continuation on watch.
📈 Confirmation remains key.
#RAY #RAYUSDT #CryptoSignals #TradingSignals #FuturesSignals #LongSignal
🟢 $RAY BUY 🟢
📍 ENTRY: 1.6518-1.6911
🎯 TARGETS:
💰 1.7134
💰 1.7279
💰 1.8701
🛑 STOP: 1.6358
🚀 KEY SUPPORT BOUNCE — RAY BULLS ARE LOOKING FOR A REVERSAL
$RAY is reacting from key support, putting the upside levels in focus. 👀
⚡ Support defense → bullish continuation on watch.
📈 Confirmation remains key.
#RAY #RAYUSDT #CryptoSignals #TradingSignals #FuturesSignals #LongSignal
📍 ENTRY: 1.6518-1.6911
🎯 TARGETS:
💰 1.7134
💰 1.7279
💰 1.8701
🛑 STOP: 1.6358
🚀 KEY SUPPORT BOUNCE — RAY BULLS ARE LOOKING FOR A REVERSAL
$RAY is reacting from key support, putting the upside levels in focus. 👀
⚡ Support defense → bullish continuation on watch.
📈 Confirmation remains key.
#RAY #RAYUSDT #CryptoSignals #TradingSignals #FuturesSignals #LongSignal
237
Log in to explore more content
Join global crypto users on Binance Square
⚡️ Get latest and useful information about crypto.
💬 Trusted by the world’s largest crypto exchange.
👍 Discover real insights from verified creators.
Email / Phone number
Trending Topics
1
#NvidiaLoses$2.7TrillionInMonthAndAHalf
16,477 views
113 Discussing
2
#CanBTCReboundAfterFallingBelow60K?
732,977 views
2,932 Discussing
3
#GlobalStocksFaceLongestLosingStreakSince2023
265,205 views
1,963 Discussing
4
#BlackRockIBITPostsRecord$541MSingleDayOutflow
30,570 views
88 Discussing
5
#AnthropicPlungesTowardIPOPriceonDay2
134,831 views
1,189 Discussing
6
#TwentyOneCapitalAdds172.25BTC
61,462 views
647 Discussing
7
#HKBillWouldExcludeTokenizedDepositsFromVirtualAssets
7,591 views
50 Discussing
8
#BNBDropsBelow540USDTWith8.46%DailyDecline
74,156 views
637 Discussing
9
#HKBillProposesHK$100KFineForUnauthorizedCryptoTitles
2,490 views
22 Discussing
10
#BitMineFaces$10.1BUnrealizedETHLoss
5,188 views
28 Discussing