
#nvdabusdt
nvdabusdt
2,404 views
26 Discussing
Hot
Latest

·
--
Article
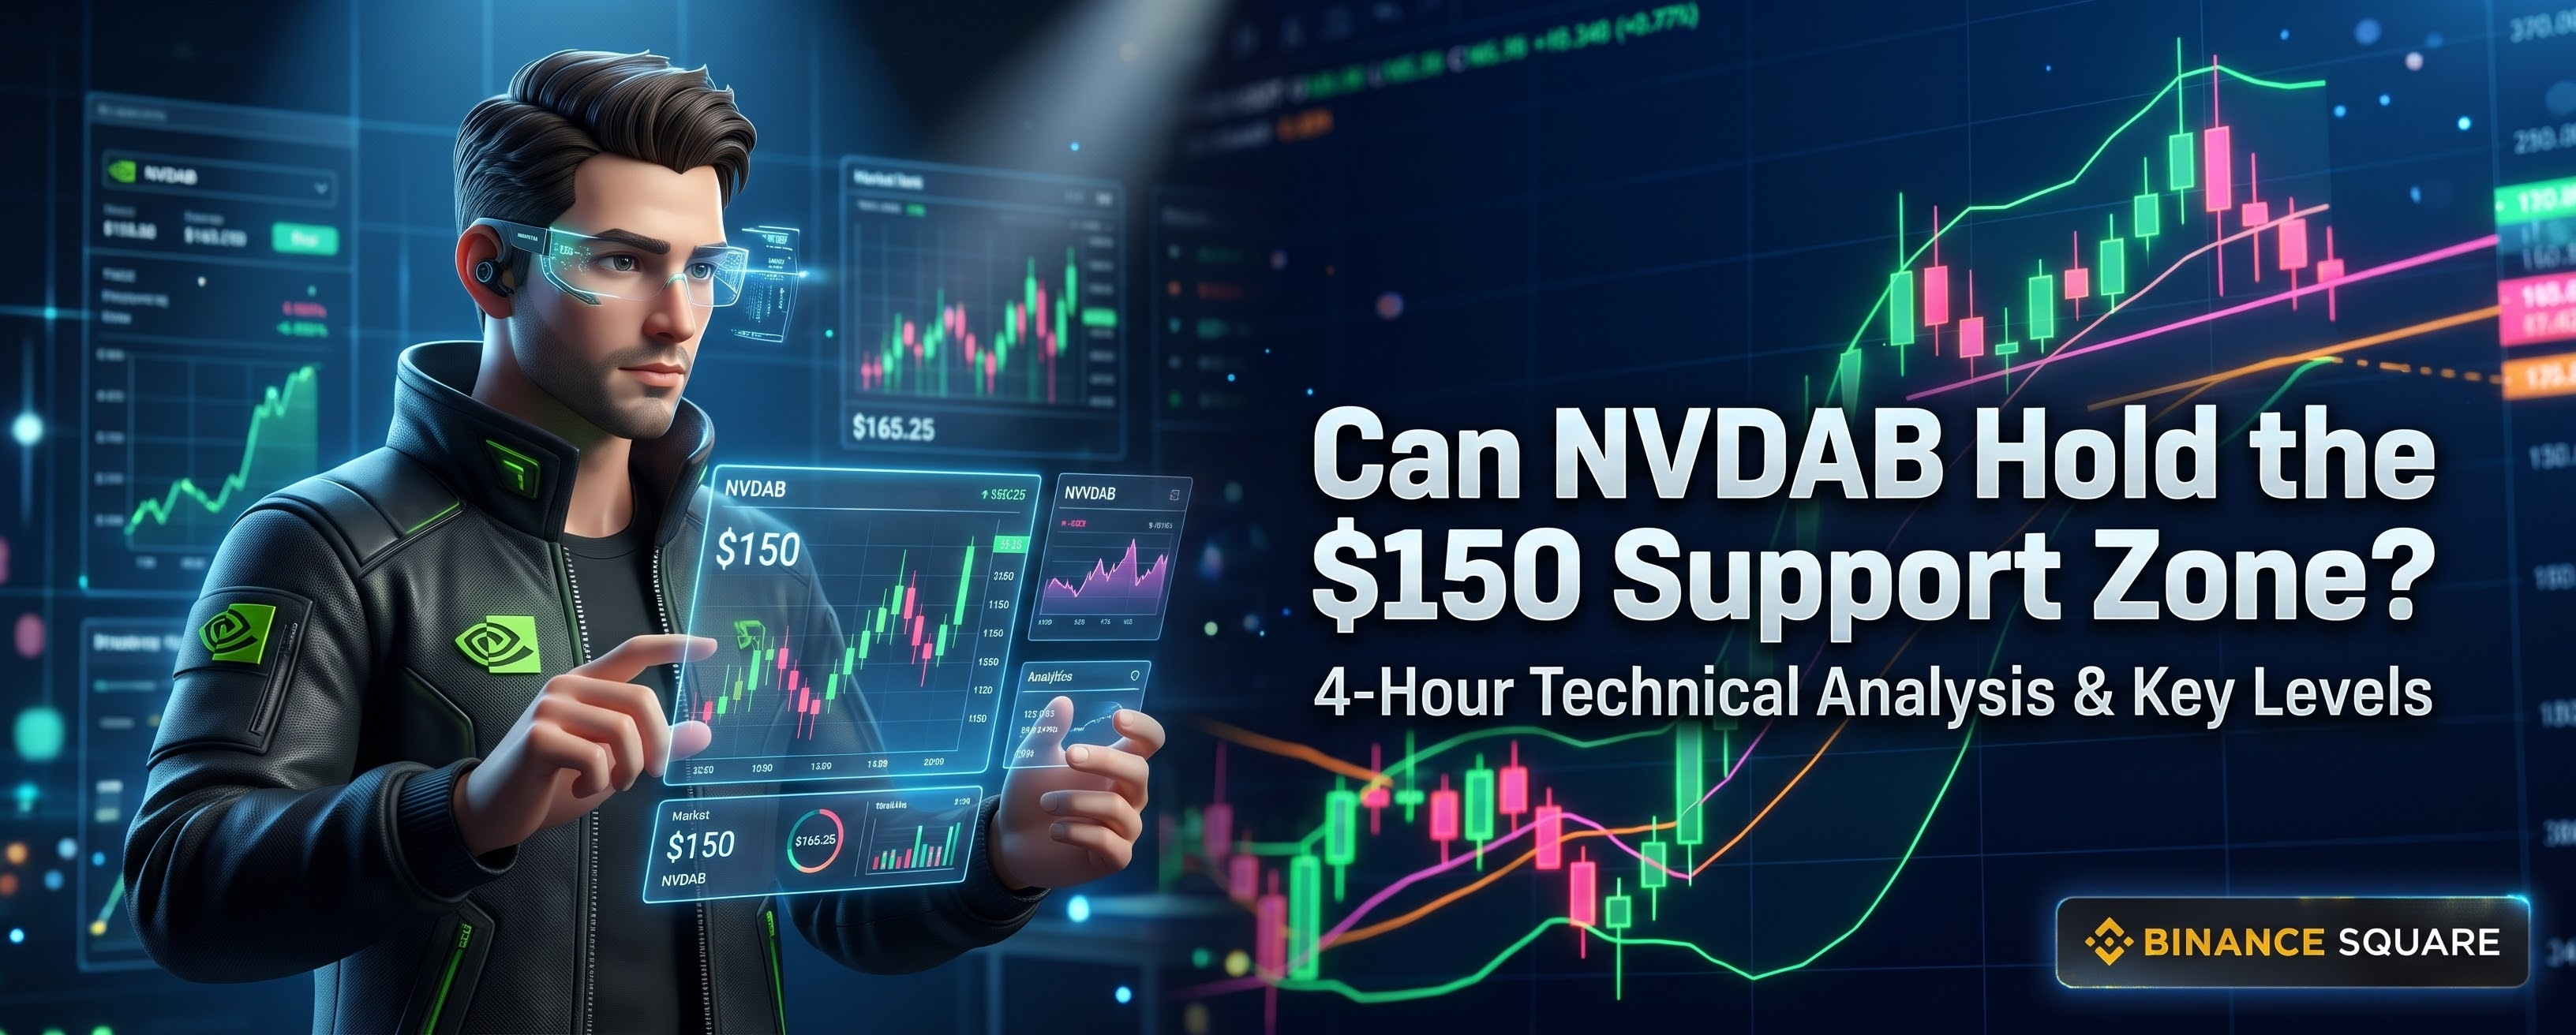
Can NVDAB Hold the $150 Support Zone? Full 4-Hour Technical Analysis & Key Levels
Can NVDAB Hold th🚨 NVDAB/USDT (4H) Market Update: Bearish Pressure Meets Key Demand Zone
NVIDIA tokenized stock (NVDAB) is currently trading around $165.25 (-6.37% over the last 24 hours), experiencing sharp volatility after a sustained multi-day downtrend from its recent swing high of $220.45.
📊 Technical Analysis (4-Hour Timeframe)
Trend & Market Structure: The 4H chart shows a clear bearish structure characterized by lower highs and lower lows. However, after sweeping liquidity down to the 24h low of $149.23, buyers stepped in aggressively, printing strong bullish recovery candles back above the $165.00 mark.
Bollinger Bands (20, 2): Price recently pierced below the lower Bollinger Band (DN: $157.51), signaling short-term oversold exhaustion. It has now reclaimed the lower band and is heading toward the middle band (MB: $171.65), which acts as immediate dynamic resistance. The upper band sits higher at $185.79.
Momentum Indicators (RSI & KDJ):
RSI (6) is recovering from oversold territory, currently sitting at 42.40—leaving plenty of room for an upside relief bounce before hitting overbought levels.
KDJ shows a fresh bullish crossover (K: 44.46, D: 39.33, J: 54.71), supporting short-term upward momentum.
🔑 Key Levels to Watch
Immediate Resistance: $171.65 (Bollinger Middle Band), followed by $177.67 (24h High). A clean 4H candle close above $171.65 could open the door for a broader relief rally.
Key Support: $157.51 (Lower Bollinger Band) and the major structural floor at $149.23. Holding above $157.50 keeps the short-term recovery intact.
🌐 Fundamental & Macro Outlook
Tech Sector Rotation & Risk Sentiment: Tokenized equities like NVDAB closely track traditional Wall Street sentiment around AI hardware demand and semiconductor valuations. Recent pullbacks across high-beta tech stocks reflect broader macroeconomic caution and profit-taking ahead of key US economic data releases and earnings catalysts.
Liquidity & Volume: With $262.74M in 24h USDT volume, market participation remains elevated, confirming that institutional and retail traders are actively defending the $150 psychological zone.
💡 Trading Takeaway: While the broader 4H trend remains bearish, the sharp rejection from $149.23 alongside recovering RSI and KDJ indicators points toward a potential short-term relief bounce. Watch how price reacts at the $171.65 resistance level before looking for trend continuation.
Disclaimer: This content is for informational purposes only and does not constitute financial advice. Always manage your risk and DYOR.
$NVDAB #NVIDIA #NVDABUSDT
Can NVDAB Hold the $150 Support Zone? Full 4-Hour Technical Analysis & Key Levels Can NVDAB Hold th
🚨 NVDAB/USDT (4H) Market Update: Bearish Pressure Meets Key Demand Zone
NVIDIA tokenized stock (NVDAB) is currently trading around $165.25 (-6.37% over the last 24 hours), experiencing sharp volatility after a sustained multi-day downtrend from its recent swing high of $220.45.
📊 Technical Analysis (4-Hour Timeframe)
Trend & Market Structure: The 4H chart shows a clear bearish structure characterized by lower highs and lower lows. However, after sweeping liquidity down to the 24h low of $149.23, buyers stepped in aggressively, printing strong bullish recovery candles back above the $165.00 mark.
Bollinger Bands (20, 2): Price recently pierced below the lower Bollinger Band (DN: $157.51), signaling short-term oversold exhaustion. It has now reclaimed the lower band and is heading toward the middle band (MB: $171.65), which acts as immediate dynamic resistance. The upper band sits higher at $185.79.
Momentum Indicators (RSI & KDJ):
RSI (6) is recovering from oversold territory, currently sitting at 42.40—leaving plenty of room for an upside relief bounce before hitting overbought levels.
KDJ shows a fresh bullish crossover (K: 44.46, D: 39.33, J: 54.71), supporting short-term upward momentum.
🔑 Key Levels to Watch
Immediate Resistance: $171.65 (Bollinger Middle Band), followed by $177.67 (24h High). A clean 4H candle close above $171.65 could open the door for a broader relief rally.
Key Support: $157.51 (Lower Bollinger Band) and the major structural floor at $149.23. Holding above $157.50 keeps the short-term recovery intact.
🌐 Fundamental & Macro Outlook
Tech Sector Rotation & Risk Sentiment: Tokenized equities like NVDAB closely track traditional Wall Street sentiment around AI hardware demand and semiconductor valuations. Recent pullbacks across high-beta tech stocks reflect broader macroeconomic caution and profit-taking ahead of key US economic data releases and earnings catalysts.
Liquidity & Volume: With $262.74M in 24h USDT volume, market participation remains elevated, confirming that institutional and retail traders are actively defending the $150 psychological zone.
💡 Trading Takeaway: While the broader 4H trend remains bearish, the sharp rejection from $149.23 alongside recovering RSI and KDJ indicators points toward a potential short-term relief bounce. Watch how price reacts at the $171.65 resistance level before looking for trend continuation.
Disclaimer: This content is for informational purposes only and does not constitute financial advice. Always manage your risk and DYOR.
$NVDAB #NVIDIA #NVDABUSDT
NVIDIA tokenized stock (NVDAB) is currently trading around $165.25 (-6.37% over the last 24 hours), experiencing sharp volatility after a sustained multi-day downtrend from its recent swing high of $220.45.
📊 Technical Analysis (4-Hour Timeframe)
Trend & Market Structure: The 4H chart shows a clear bearish structure characterized by lower highs and lower lows. However, after sweeping liquidity down to the 24h low of $149.23, buyers stepped in aggressively, printing strong bullish recovery candles back above the $165.00 mark.
Bollinger Bands (20, 2): Price recently pierced below the lower Bollinger Band (DN: $157.51), signaling short-term oversold exhaustion. It has now reclaimed the lower band and is heading toward the middle band (MB: $171.65), which acts as immediate dynamic resistance. The upper band sits higher at $185.79.
Momentum Indicators (RSI & KDJ):
RSI (6) is recovering from oversold territory, currently sitting at 42.40—leaving plenty of room for an upside relief bounce before hitting overbought levels.
KDJ shows a fresh bullish crossover (K: 44.46, D: 39.33, J: 54.71), supporting short-term upward momentum.
🔑 Key Levels to Watch
Immediate Resistance: $171.65 (Bollinger Middle Band), followed by $177.67 (24h High). A clean 4H candle close above $171.65 could open the door for a broader relief rally.
Key Support: $157.51 (Lower Bollinger Band) and the major structural floor at $149.23. Holding above $157.50 keeps the short-term recovery intact.
🌐 Fundamental & Macro Outlook
Tech Sector Rotation & Risk Sentiment: Tokenized equities like NVDAB closely track traditional Wall Street sentiment around AI hardware demand and semiconductor valuations. Recent pullbacks across high-beta tech stocks reflect broader macroeconomic caution and profit-taking ahead of key US economic data releases and earnings catalysts.
Liquidity & Volume: With $262.74M in 24h USDT volume, market participation remains elevated, confirming that institutional and retail traders are actively defending the $150 psychological zone.
💡 Trading Takeaway: While the broader 4H trend remains bearish, the sharp rejection from $149.23 alongside recovering RSI and KDJ indicators points toward a potential short-term relief bounce. Watch how price reacts at the $171.65 resistance level before looking for trend continuation.
Disclaimer: This content is for informational purposes only and does not constitute financial advice. Always manage your risk and DYOR.
$NVDAB #NVIDIA #NVDABUSDT
81

·
--
Bullish
🚨 $NVDA Just Crashed 27%… And Smart Money Is Quietly Loading Bags.
Everyone panicking. I'm buying. Here's why. 👇
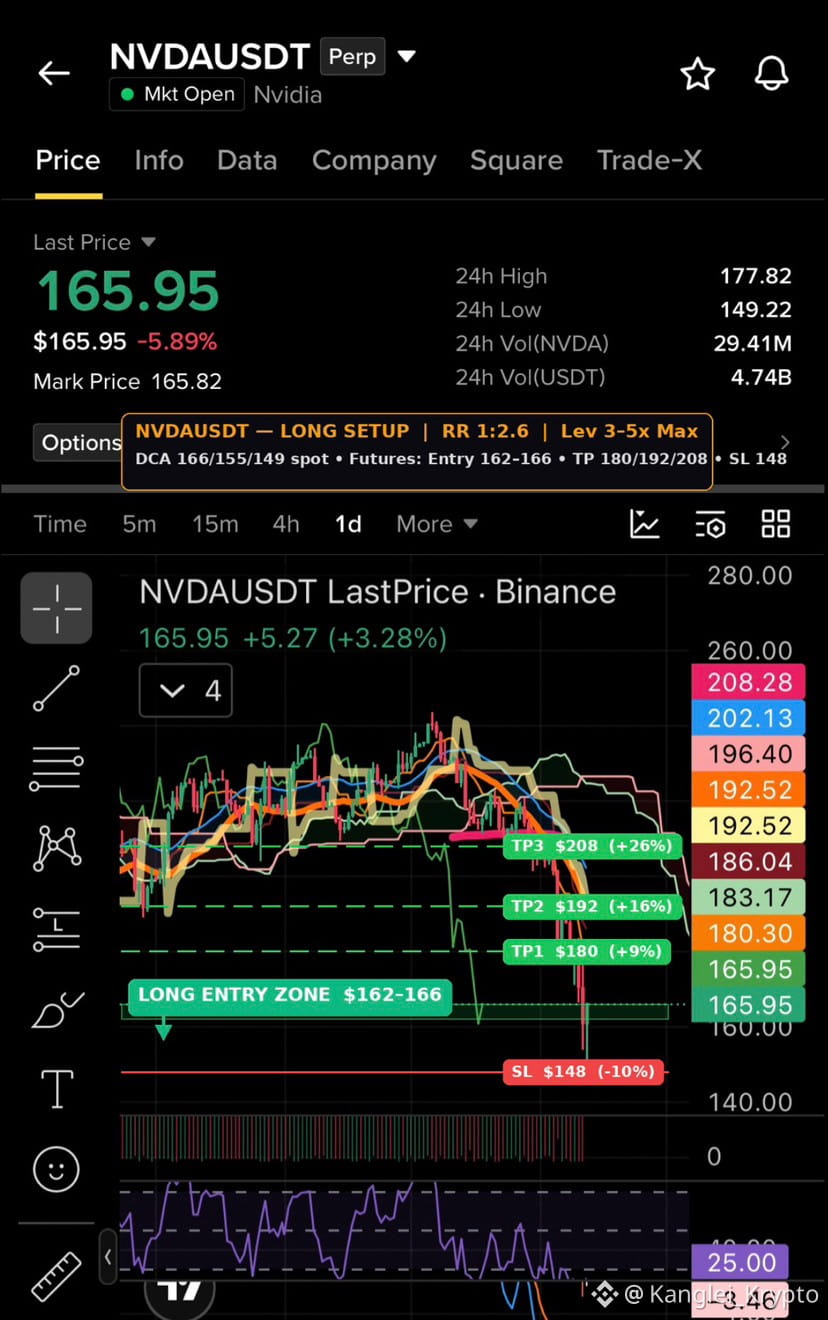
The chart is ugly — capitulation wick, broken supports, doom on the timeline. But zoom out: RSI at 25, price pinned at a major demand zone, and 24h volume at $4.74B. That's not weakness. That's a transfer of wealth from weak hands to patient ones. 📉→📈
📌 SPOT BUY PLAN (DCA):
▪️ Buy 1: $166 (current)
▪️ Buy 2: $155
▪️ Buy 3: $149 (24h low retest)
📌 FUTURES LONG SETUP:
▪️ Entry: $162–166
▪️ TP1: $180 (+9%) 🎯
▪️ TP2: $192 (+16%) 🎯
▪️ TP3: $208 (+27%) 🚀
▪️ SL: $148 (below 24h low) ❌
▪️ Leverage: 3–5x max. This is a falling knife — respect the stop.
⚠️ The Controversy: Bulls say AI demand is infinite and this is the dip of the year. Bears say NVDA's valuation was a house of cards and $140 is next. Truth? Oversold bounces are the most profitable trades in crypto — IF you survive to see them. Position small or don't play.
Weak hands sell the bottom. Strong hands buy the fear. Which one are you? 💬👇
🚨Not financial advice. Trade your plan, not your emotions. $NVDAB $NVDA.US
#HuangExitNvidiaStrategyInFocus #NVDABUSDT #NVDAUSDT
{spot}(NVDABUSDT)
{future}(NVDAUSDT)
🚨 $NVDA Just Crashed 27%… And Smart Money Is Quietly Loading Bags.
Everyone panicking. I'm buying. Here's why. 👇
The chart is ugly — capitulation wick, broken supports, doom on the timeline. But zoom out: RSI at 25, price pinned at a major demand zone, and 24h volume at $4.74B. That's not weakness. That's a transfer of wealth from weak hands to patient ones. 📉→📈
📌 SPOT BUY PLAN (DCA):
▪️ Buy 1: $166 (current)
▪️ Buy 2: $155
▪️ Buy 3: $149 (24h low retest)
📌 FUTURES LONG SETUP:
▪️ Entry: $162–166
▪️ TP1: $180 (+9%) 🎯
▪️ TP2: $192 (+16%) 🎯
▪️ TP3: $208 (+27%) 🚀
▪️ SL: $148 (below 24h low) ❌
▪️ Leverage: 3–5x max. This is a falling knife — respect the stop.
⚠️ The Controversy: Bulls say AI demand is infinite and this is the dip of the year. Bears say NVDA's valuation was a house of cards and $140 is next. Truth? Oversold bounces are the most profitable trades in crypto — IF you survive to see them. Position small or don't play.
Weak hands sell the bottom. Strong hands buy the fear. Which one are you? 💬👇
🚨Not financial advice. Trade your plan, not your emotions. $NVDAB $NVDA.US
#HuangExitNvidiaStrategyInFocus #NVDABUSDT #NVDAUSDT
Everyone panicking. I'm buying. Here's why. 👇
The chart is ugly — capitulation wick, broken supports, doom on the timeline. But zoom out: RSI at 25, price pinned at a major demand zone, and 24h volume at $4.74B. That's not weakness. That's a transfer of wealth from weak hands to patient ones. 📉→📈
📌 SPOT BUY PLAN (DCA):
▪️ Buy 1: $166 (current)
▪️ Buy 2: $155
▪️ Buy 3: $149 (24h low retest)
📌 FUTURES LONG SETUP:
▪️ Entry: $162–166
▪️ TP1: $180 (+9%) 🎯
▪️ TP2: $192 (+16%) 🎯
▪️ TP3: $208 (+27%) 🚀
▪️ SL: $148 (below 24h low) ❌
▪️ Leverage: 3–5x max. This is a falling knife — respect the stop.
⚠️ The Controversy: Bulls say AI demand is infinite and this is the dip of the year. Bears say NVDA's valuation was a house of cards and $140 is next. Truth? Oversold bounces are the most profitable trades in crypto — IF you survive to see them. Position small or don't play.
Weak hands sell the bottom. Strong hands buy the fear. Which one are you? 💬👇
🚨Not financial advice. Trade your plan, not your emotions. $NVDAB $NVDA.US
#HuangExitNvidiaStrategyInFocus #NVDABUSDT #NVDAUSDT
NVDAB-2.86%
NVDAUS-3.23%
Adrianna Gonzalea zAhY:
🙏🙏🙏🙏🙏
5
1
7
3.6k

·
--
Verified
NVDAB down 4.9% amid Nvidia board investigation: will 175.59 hold?$NVDAB is trading at 178.84 (-4.86%) after hitting a low of 175.59. The price is below EMA(21) and EMA(50) on all timeframes; on the daily chart, RSI(6) is 22.47.
Background: Nvidia’s board of directors announced an independent investigation following media reports that CEO Jensen Huang may have been targeted in a foreign intelligence operation. China’s Ministry of Foreign Affairs called the allegations unfounded. NVDA shares fell about 5% in premarket trading from the 186.64 close, and are down around 22% for the month. NVDAB trades around the clock, so it reacted to the news before the market opened. The investigation is still ongoing; this is not a finding of guilt.
NVDAB down 4.9% amid Nvidia board investigation: will 175.59 hold?
$NVDAB is trading at 178.84 (-4.86%) after hitting a low of 175.59. The price is below EMA(21) and EMA(50) on all timeframes; on the daily chart, RSI(6) is 22.47.
Background: Nvidia’s board of directors announced an independent investigation following media reports that CEO Jensen Huang may have been targeted in a foreign intelligence operation. China’s Ministry of Foreign Affairs called the allegations unfounded. NVDA shares fell about 5% in premarket trading from the 186.64 close, and are down around 22% for the month. NVDAB trades around the clock, so it reacted to the news before the market opened. The investigation is still ongoing; this is not a finding of guilt.
Background: Nvidia’s board of directors announced an independent investigation following media reports that CEO Jensen Huang may have been targeted in a foreign intelligence operation. China’s Ministry of Foreign Affairs called the allegations unfounded. NVDA shares fell about 5% in premarket trading from the 186.64 close, and are down around 22% for the month. NVDAB trades around the clock, so it reacted to the news before the market opened. The investigation is still ongoing; this is not a finding of guilt.
1
112

·
--
$NVDABUSDT
🔻 $NVDABUSDT SHORT SETUP 🔴 Sellers are stepping in — here's the setup. ⚡
$NVDABUSDT is showing clear bearish momentum with a 4.58% decline over the last 24 hours, currently hovering just above its daily lows. Increased selling pressure and strong quote volume indicate that traders are actively offloading positions, signaling a potential continuation of the downward trend.
📊 24h: -4.58% | Vol: $11,674,897.68
📉 TRADE PLAN
🔹 Entry: 197.89
🛑 Stop Loss: 201.20
🎯 TP1: 192.85
🎯 TP2: 190.10
🎯 TP3: 187.50
⚖️ Risk:Reward (TP1): 1:1.52
🔔 Trigger: A confirmed hourly close below the 197.00 support level would provide the necessary conviction to initiate this short position.
⚠️ Risk Note: Market volatility is currently elevated; ensure your position size is managed to account for potential price swings during this downtrend.
Always wait for a clear breakdown in price action before committing to your market entry.
Click below 👇🏻 to trade
$NVDAB
Follow @T4_TZX for more updates...
#NVDABUSDT #CryptoTrading #MarketAnalysis #BinanceSquare
$NVDABUSDT
🔻 $NVDABUSDT SHORT SETUP 🔴 Sellers are stepping in — here's the setup. ⚡
$NVDABUSDT is showing clear bearish momentum with a 4.58% decline over the last 24 hours, currently hovering just above its daily lows. Increased selling pressure and strong quote volume indicate that traders are actively offloading positions, signaling a potential continuation of the downward trend.
📊 24h: -4.58% | Vol: $11,674,897.68
📉 TRADE PLAN
🔹 Entry: 197.89
🛑 Stop Loss: 201.20
🎯 TP1: 192.85
🎯 TP2: 190.10
🎯 TP3: 187.50
⚖️ Risk:Reward (TP1): 1:1.52
🔔 Trigger: A confirmed hourly close below the 197.00 support level would provide the necessary conviction to initiate this short position.
⚠️ Risk Note: Market volatility is currently elevated; ensure your position size is managed to account for potential price swings during this downtrend.
Always wait for a clear breakdown in price action before committing to your market entry.
Click below 👇🏻 to trade
$NVDAB
Follow @T4_TZX for more updates...
#NVDABUSDT #CryptoTrading #MarketAnalysis #BinanceSquare
🔻 $NVDABUSDT SHORT SETUP 🔴 Sellers are stepping in — here's the setup. ⚡
$NVDABUSDT is showing clear bearish momentum with a 4.58% decline over the last 24 hours, currently hovering just above its daily lows. Increased selling pressure and strong quote volume indicate that traders are actively offloading positions, signaling a potential continuation of the downward trend.
📊 24h: -4.58% | Vol: $11,674,897.68
📉 TRADE PLAN
🔹 Entry: 197.89
🛑 Stop Loss: 201.20
🎯 TP1: 192.85
🎯 TP2: 190.10
🎯 TP3: 187.50
⚖️ Risk:Reward (TP1): 1:1.52
🔔 Trigger: A confirmed hourly close below the 197.00 support level would provide the necessary conviction to initiate this short position.
⚠️ Risk Note: Market volatility is currently elevated; ensure your position size is managed to account for potential price swings during this downtrend.
Always wait for a clear breakdown in price action before committing to your market entry.
Click below 👇🏻 to trade
$NVDAB
Follow @T4_TZX for more updates...
#NVDABUSDT #CryptoTrading #MarketAnalysis #BinanceSquare
3
·
--
Article
WHALES QUIETLY DUMP THE TOKENIZED EMPIRE WHILE RETAIL BLINDLY GOBBLES UP THE HIGHS ON THE NEWS$NVDAB Price: 219.30 USDT (+1.82%). The market is intoxicated by fresh fundamentals: NVIDIA has officially expanded its partnership with Meta, announcing plans to buy a stake in its shares for $3 billion, and is also rolling out large-scale AI clusters with Oracle. But behind this bull-market celebration lies cynical market-maker distribution.
WHALES QUIETLY DUMP THE TOKENIZED EMPIRE WHILE RETAIL BLINDLY GOBBLES UP THE HIGHS ON THE NEWS
$NVDAB Price: 219.30 USDT (+1.82%). The market is intoxicated by fresh fundamentals: NVIDIA has officially expanded its partnership with Meta, announcing plans to buy a stake in its shares for $3 billion, and is also rolling out large-scale AI clusters with Oracle. But behind this bull-market celebration lies cynical market-maker distribution.
66

·
--
Bullish
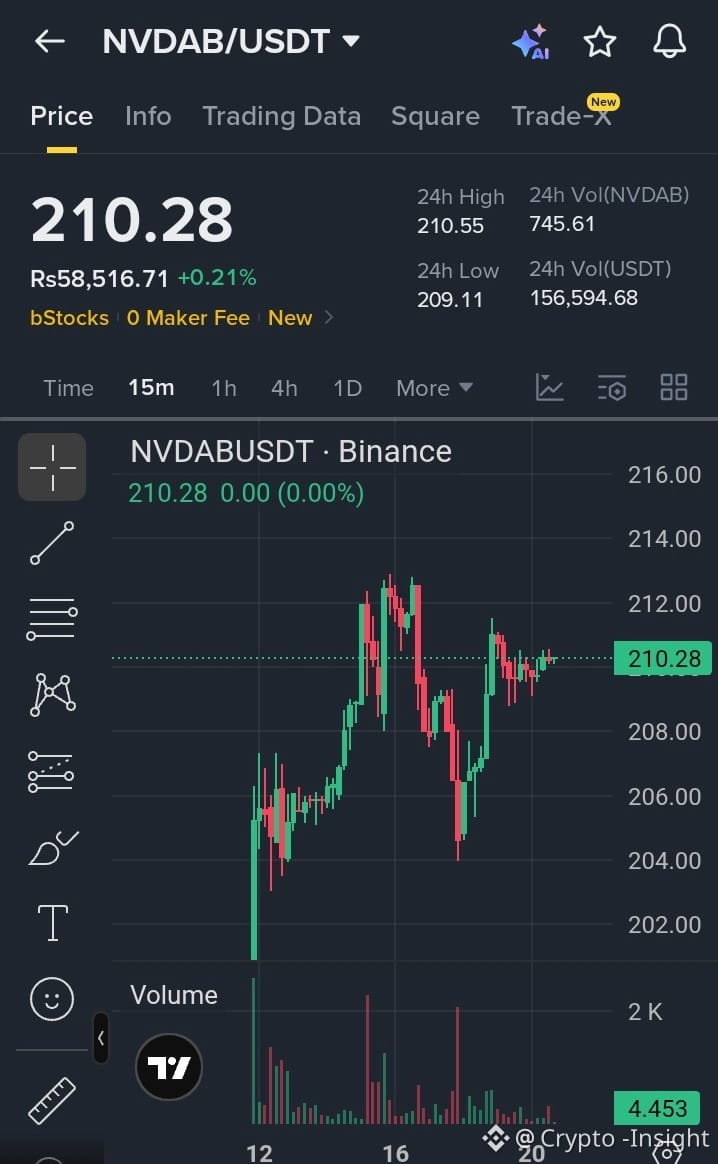
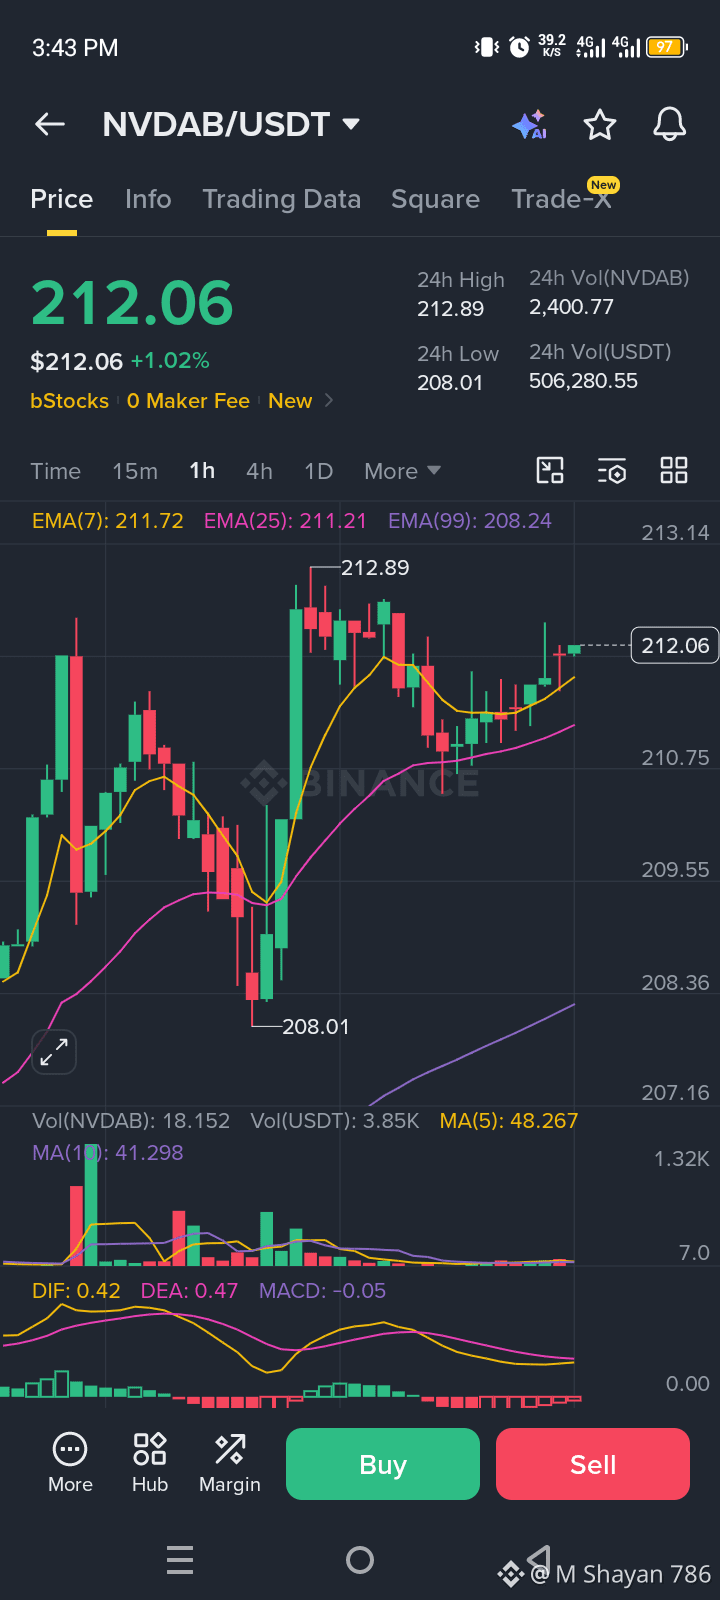
$NVDAB /USDT BULLS ARE LOADING FOR A BREAKOUT 🚀 RESISTANCE IS ONE PUSH AWAY!
$NVDAB /USDT is trading near 210.28 and holding firmly above key intraday support levels. The chart shows a steady bullish structure with buyers consistently defending dips above 209.00. With price hovering just below the recent high at 210.55, momentum is building for a potential breakout that could spark the next move higher.
📈 TRADE SETUP:
🟢 LONG ENTRY: 209.80 - 210.50
🎯 TP1: 210.55
🎯 TP2: 212.00
🎯 TP3: 214.00
🛑 SL: 208.50
📊 MARKET OUTLOOK:
The short-term bias remains bullish while price stays above the 209.00 support zone. A decisive break above 210.55 could attract fresh buying pressure and drive NVDAB toward the 212.00–214.00 resistance area. Buyers currently maintain control of the trend.
#NVDABUSDT #TradingSetup #Binance #TechnicalAnalysis #BullishMomentum $NVDAB
{spot}(NVDABUSDT)
$NVDAB /USDT BULLS ARE LOADING FOR A BREAKOUT 🚀 RESISTANCE IS ONE PUSH AWAY!
$NVDAB /USDT is trading near 210.28 and holding firmly above key intraday support levels. The chart shows a steady bullish structure with buyers consistently defending dips above 209.00. With price hovering just below the recent high at 210.55, momentum is building for a potential breakout that could spark the next move higher.
📈 TRADE SETUP:
🟢 LONG ENTRY: 209.80 - 210.50
🎯 TP1: 210.55
🎯 TP2: 212.00
🎯 TP3: 214.00
🛑 SL: 208.50
📊 MARKET OUTLOOK:
The short-term bias remains bullish while price stays above the 209.00 support zone. A decisive break above 210.55 could attract fresh buying pressure and drive NVDAB toward the 212.00–214.00 resistance area. Buyers currently maintain control of the trend.
#NVDABUSDT #TradingSetup #Binance #TechnicalAnalysis #BullishMomentum $NVDAB
$NVDAB /USDT is trading near 210.28 and holding firmly above key intraday support levels. The chart shows a steady bullish structure with buyers consistently defending dips above 209.00. With price hovering just below the recent high at 210.55, momentum is building for a potential breakout that could spark the next move higher.
📈 TRADE SETUP:
🟢 LONG ENTRY: 209.80 - 210.50
🎯 TP1: 210.55
🎯 TP2: 212.00
🎯 TP3: 214.00
🛑 SL: 208.50
📊 MARKET OUTLOOK:
The short-term bias remains bullish while price stays above the 209.00 support zone. A decisive break above 210.55 could attract fresh buying pressure and drive NVDAB toward the 212.00–214.00 resistance area. Buyers currently maintain control of the trend.
#NVDABUSDT #TradingSetup #Binance #TechnicalAnalysis #BullishMomentum $NVDAB
1
67

#AIStocksWhatNext
Nvidia's soaring demand and record AI sector revenues prove that compute spend isn't just a short-term bounce; it reflects fundamental infrastructure migration. While tech leaders urge caution, state-level initiatives like the proposed U.S. "AI Force" highlight how critical AI has become to national economic strategy and future GDP growth. Government backing provides a strong long-term tailwind for leading AI equities.
Are you adding to your AI portfolio? Share your current holdings via the trade sharing widget below!
#AIstocks
#NVDIA
#NVDABUSDT
{spot}(NVDABUSDT)
{future}(NVDAUSDT)
#AIStocksWhatNext
Nvidia's soaring demand and record AI sector revenues prove that compute spend isn't just a short-term bounce; it reflects fundamental infrastructure migration. While tech leaders urge caution, state-level initiatives like the proposed U.S. "AI Force" highlight how critical AI has become to national economic strategy and future GDP growth. Government backing provides a strong long-term tailwind for leading AI equities.
Are you adding to your AI portfolio? Share your current holdings via the trade sharing widget below!
#AIstocks
#NVDIA
#NVDABUSDT
Nvidia's soaring demand and record AI sector revenues prove that compute spend isn't just a short-term bounce; it reflects fundamental infrastructure migration. While tech leaders urge caution, state-level initiatives like the proposed U.S. "AI Force" highlight how critical AI has become to national economic strategy and future GDP growth. Government backing provides a strong long-term tailwind for leading AI equities.
Are you adding to your AI portfolio? Share your current holdings via the trade sharing widget below!
#AIstocks
#NVDIA
#NVDABUSDT
31



·
--
Bullish
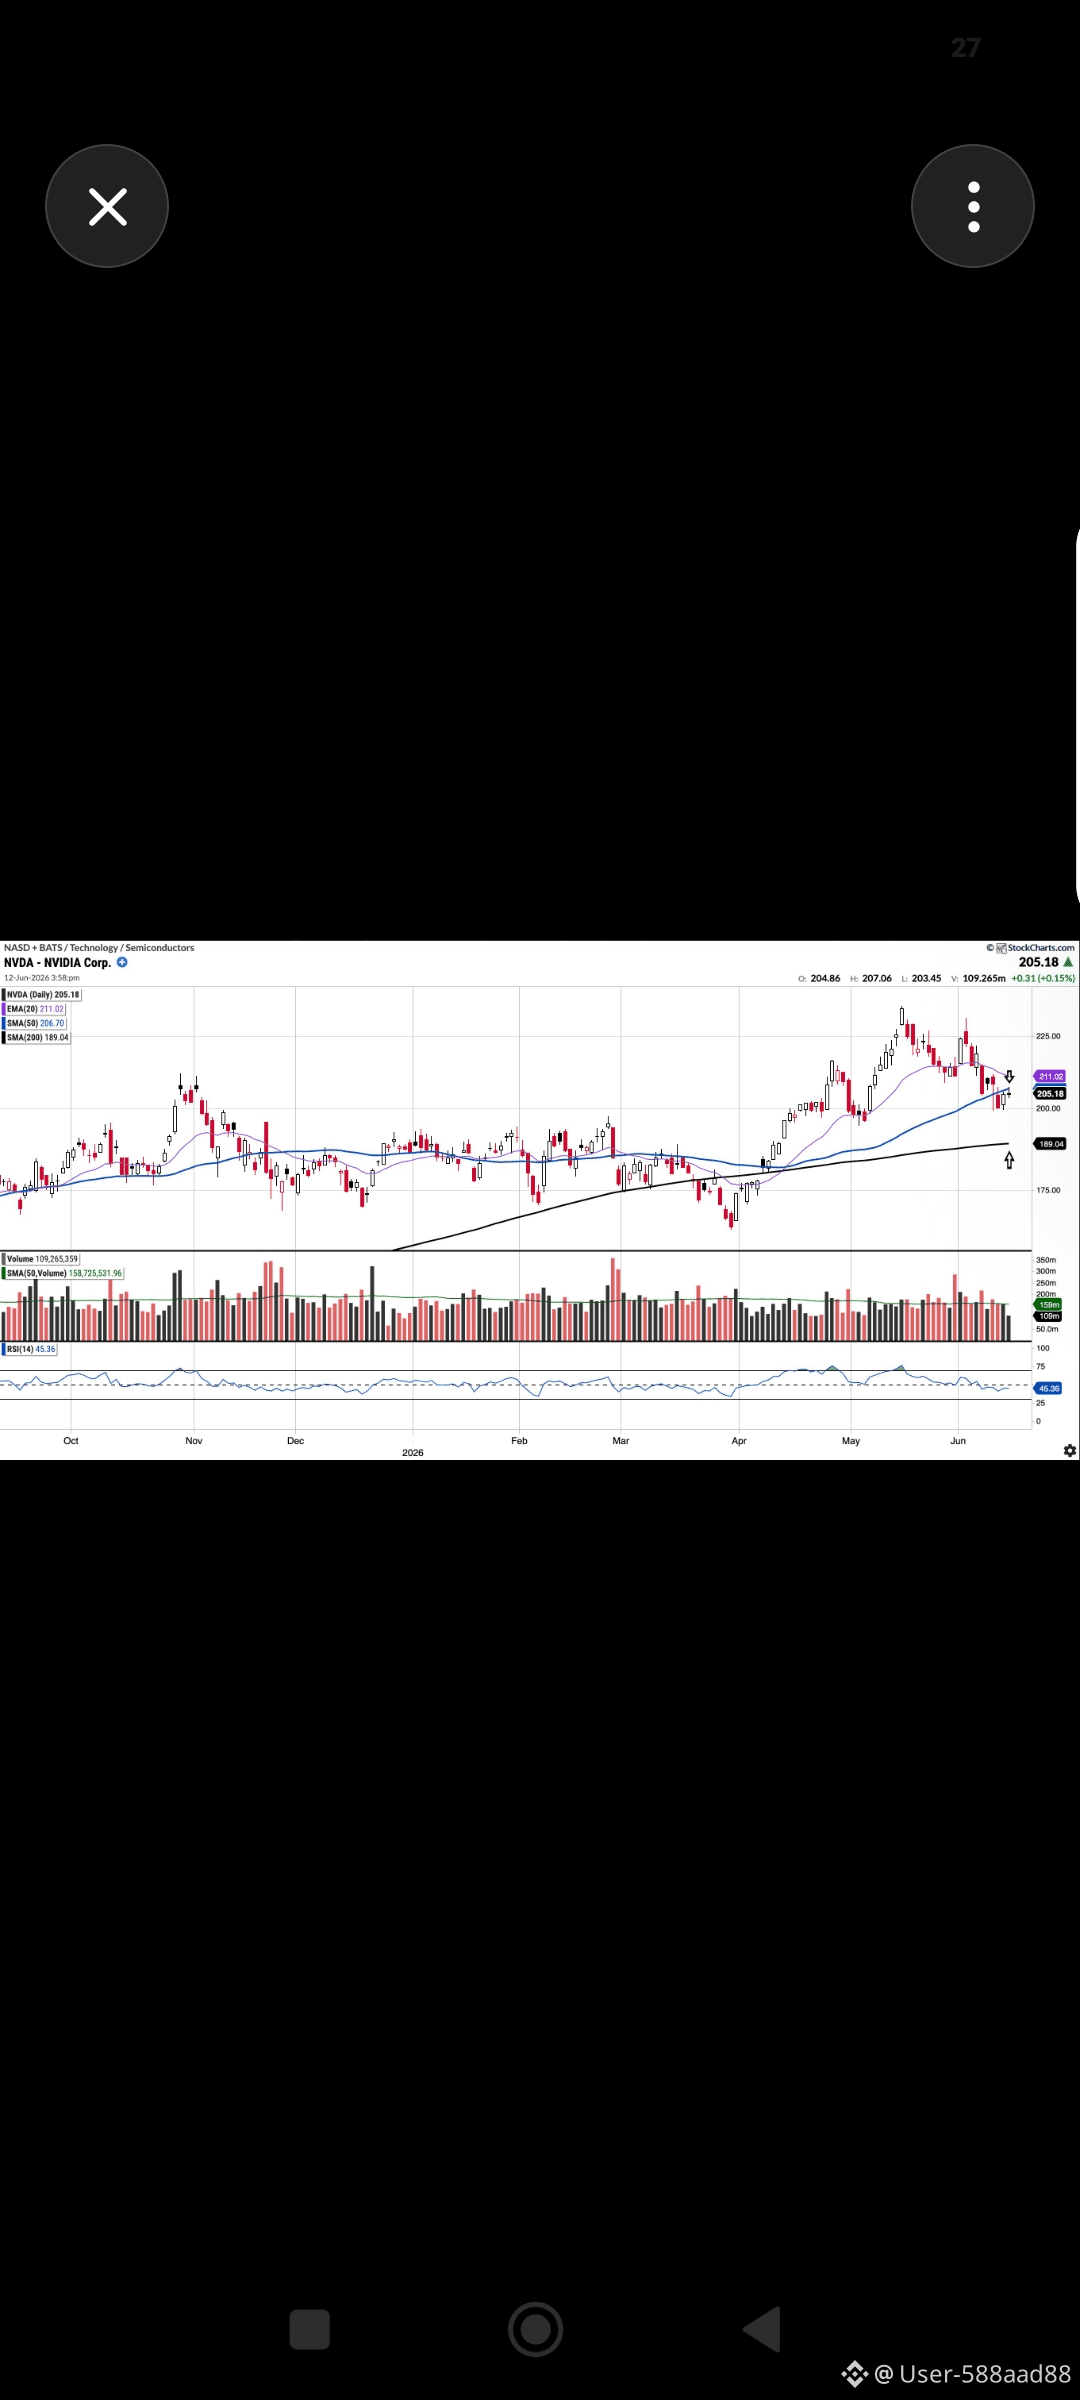
NVDAB, TSLAB & MSFTB — Latest Short Analysis 📊
Assuming you mean the stock-linked symbols NVDA, TSLA and MSFT.
🟢 NVDAB / NVDA
Bullish: Nvidia delivered stronger-than-expected results and issued an upbeat revenue outlook, reinforcing the AI-growth story. Short-term volatility may remain high after the sharp reaction to earnings.
🟡 TSLAB / TSLA
Neutral to bullish: Tesla's recent rally is facing a short-term test, so momentum traders should watch whether the stock can maintain its recent trend. �
🟢 MSFTB / MSFT
Bullish: Microsoft remains supported by strong AI and Azure growth; its latest reported quarterly revenue was about $90 billion, with Azure growth of 43% according to the recent earnings coverage. �
Quick ranking: 🥇 NVDA | 🥈 MSFT | 🥉 TSLA
*Not financial advice—markets can change rapidly.* $NVDAB #NVDABUSDT
{spot}(NVDABUSDT)
$TSLAB #TSLABUSDT
{spot}(TSLABUSDT)
$MSFTB #MSFTBUSDT
{spot}(MSFTBUSDT)
[NVDAB TSLAB MSFTB](https://www.binance.com/en/trade/NVDA_USDT. https://www.binance.com/en/trade/TSLA_USDT. https://www.binance.com/en/trade/MSFT_USDT.)
NVDAB, TSLAB & MSFTB — Latest Short Analysis 📊
Assuming you mean the stock-linked symbols NVDA, TSLA and MSFT.
🟢 NVDAB / NVDA
Bullish: Nvidia delivered stronger-than-expected results and issued an upbeat revenue outlook, reinforcing the AI-growth story. Short-term volatility may remain high after the sharp reaction to earnings.
🟡 TSLAB / TSLA
Neutral to bullish: Tesla's recent rally is facing a short-term test, so momentum traders should watch whether the stock can maintain its recent trend. �
🟢 MSFTB / MSFT
Bullish: Microsoft remains supported by strong AI and Azure growth; its latest reported quarterly revenue was about $90 billion, with Azure growth of 43% according to the recent earnings coverage. �
Quick ranking: 🥇 NVDA | 🥈 MSFT | 🥉 TSLA
*Not financial advice—markets can change rapidly.* $NVDAB #NVDABUSDT
$TSLAB #TSLABUSDT
$MSFTB #MSFTBUSDT
NVDAB TSLAB MSFTB
Assuming you mean the stock-linked symbols NVDA, TSLA and MSFT.
🟢 NVDAB / NVDA
Bullish: Nvidia delivered stronger-than-expected results and issued an upbeat revenue outlook, reinforcing the AI-growth story. Short-term volatility may remain high after the sharp reaction to earnings.
🟡 TSLAB / TSLA
Neutral to bullish: Tesla's recent rally is facing a short-term test, so momentum traders should watch whether the stock can maintain its recent trend. �
🟢 MSFTB / MSFT
Bullish: Microsoft remains supported by strong AI and Azure growth; its latest reported quarterly revenue was about $90 billion, with Azure growth of 43% according to the recent earnings coverage. �
Quick ranking: 🥇 NVDA | 🥈 MSFT | 🥉 TSLA
*Not financial advice—markets can change rapidly.* $NVDAB #NVDABUSDT
$TSLAB #TSLABUSDT
$MSFTB #MSFTBUSDT
NVDAB TSLAB MSFTB
78

·
--
🔥 $NVDAB
{spot}(NVDABUSDT)
#NVDABUSDT — Unusual buying activity alert! 🚀
• Trend: Bullish / strong buying momentum (Unusual Buying Activity) 🟢
• Current price: 239.00 (+0.07% over 24 hours)
• Suggested stop-loss: 232.00
🎯 Targets (if momentum continues):
1️⃣ 245.00
2️⃣ 252.00
3️⃣ 260.00
📊 Analysis:
The tokenized version of NVIDIA shares is showing notable and unusual activity, with around 487,000 USDT poured into buying over just 4 minutes, representing 11% of the immediate liquidity movement. This intense interest reflects traders’ desire to gain exposure to real-world assets (RWA) within the blockchain environment. With daily trading volume reaching 4.86 million USDT, there appears to be institutional activity or growing interest in this type of asset. Remember that it represents the performance of the underlying stock, so keeping up with NVIDIA news and traditional markets is essential alongside technical analysis. Always make sure to set an appropriate stop-loss to manage risk with this type of tokenized asset.
$RLC
{future}(RLCUSDT)
$B
{alpha}(560x6bdcce4a559076e37755a78ce0c06214e59e4444)
#WIF #ARB #BTC走势分析 #viralpost
🔥 $NVDAB
#NVDABUSDT — Unusual buying activity alert! 🚀
• Trend: Bullish / strong buying momentum (Unusual Buying Activity) 🟢
• Current price: 239.00 (+0.07% over 24 hours)
• Suggested stop-loss: 232.00
🎯 Targets (if momentum continues):
1️⃣ 245.00
2️⃣ 252.00
3️⃣ 260.00
📊 Analysis:
The tokenized version of NVIDIA shares is showing notable and unusual activity, with around 487,000 USDT poured into buying over just 4 minutes, representing 11% of the immediate liquidity movement. This intense interest reflects traders’ desire to gain exposure to real-world assets (RWA) within the blockchain environment. With daily trading volume reaching 4.86 million USDT, there appears to be institutional activity or growing interest in this type of asset. Remember that it represents the performance of the underlying stock, so keeping up with NVIDIA news and traditional markets is essential alongside technical analysis. Always make sure to set an appropriate stop-loss to manage risk with this type of tokenized asset.
$RLC
$B
#WIF #ARB #BTC走势分析 #viralpost
#NVDABUSDT — Unusual buying activity alert! 🚀
• Trend: Bullish / strong buying momentum (Unusual Buying Activity) 🟢
• Current price: 239.00 (+0.07% over 24 hours)
• Suggested stop-loss: 232.00
🎯 Targets (if momentum continues):
1️⃣ 245.00
2️⃣ 252.00
3️⃣ 260.00
📊 Analysis:
The tokenized version of NVIDIA shares is showing notable and unusual activity, with around 487,000 USDT poured into buying over just 4 minutes, representing 11% of the immediate liquidity movement. This intense interest reflects traders’ desire to gain exposure to real-world assets (RWA) within the blockchain environment. With daily trading volume reaching 4.86 million USDT, there appears to be institutional activity or growing interest in this type of asset. Remember that it represents the performance of the underlying stock, so keeping up with NVIDIA news and traditional markets is essential alongside technical analysis. Always make sure to set an appropriate stop-loss to manage risk with this type of tokenized asset.
$RLC
$B
#WIF #ARB #BTC走势分析 #viralpost
3
178

·
--
$NVDAB 🚀 NVDAB Coin is one to watch!
The crypto market never sleeps, and NVDAB is starting to catch the attention of traders looking for the next opportunity.
✅ Growing market interest
✅ Active community support
✅ Worth adding to your watchlist
If you're trading, keep an eye on NVDAB/USDT and always wait for confirmation before entering a position. Smart traders follow their strategy—they don't chase hype.
📊 DYOR (Do Your Own Research) and manage your risk. Never invest more than you can afford to lose.
What's your view on NVDAB? Bullish or bearish? 👇
{spot}(NVDABUSDT)
#NVDABUSDT #crypto #Binance #altcoins
$NVDAB 🚀 NVDAB Coin is one to watch!
The crypto market never sleeps, and NVDAB is starting to catch the attention of traders looking for the next opportunity.
✅ Growing market interest
✅ Active community support
✅ Worth adding to your watchlist
If you're trading, keep an eye on NVDAB/USDT and always wait for confirmation before entering a position. Smart traders follow their strategy—they don't chase hype.
📊 DYOR (Do Your Own Research) and manage your risk. Never invest more than you can afford to lose.
What's your view on NVDAB? Bullish or bearish? 👇
#NVDABUSDT #crypto #Binance #altcoins
The crypto market never sleeps, and NVDAB is starting to catch the attention of traders looking for the next opportunity.
✅ Growing market interest
✅ Active community support
✅ Worth adding to your watchlist
If you're trading, keep an eye on NVDAB/USDT and always wait for confirmation before entering a position. Smart traders follow their strategy—they don't chase hype.
📊 DYOR (Do Your Own Research) and manage your risk. Never invest more than you can afford to lose.
What's your view on NVDAB? Bullish or bearish? 👇
#NVDABUSDT #crypto #Binance #altcoins

82


Quoted content has been removed
1
13


·
--
Bullish
The best coin on Binance is $NVDAB #NVDABUSDT yes $GOOGLB #GoldRetreatsFromTwoWeekHigh $NVDAB #BitcoinUpNearly7%ThisWeek #KospiFalls4.91%TriggersCircuitBreaker #KospiFalls4.91%TriggersCircuitBreaker
The best coin on Binance is $NVDAB #NVDABUSDT yes $GOOGLB #GoldRetreatsFromTwoWeekHigh $NVDAB #BitcoinUpNearly7%ThisWeek #KospiFalls4.91%TriggersCircuitBreaker #KospiFalls4.91%TriggersCircuitBreaker
1
46

·
--
Bullish
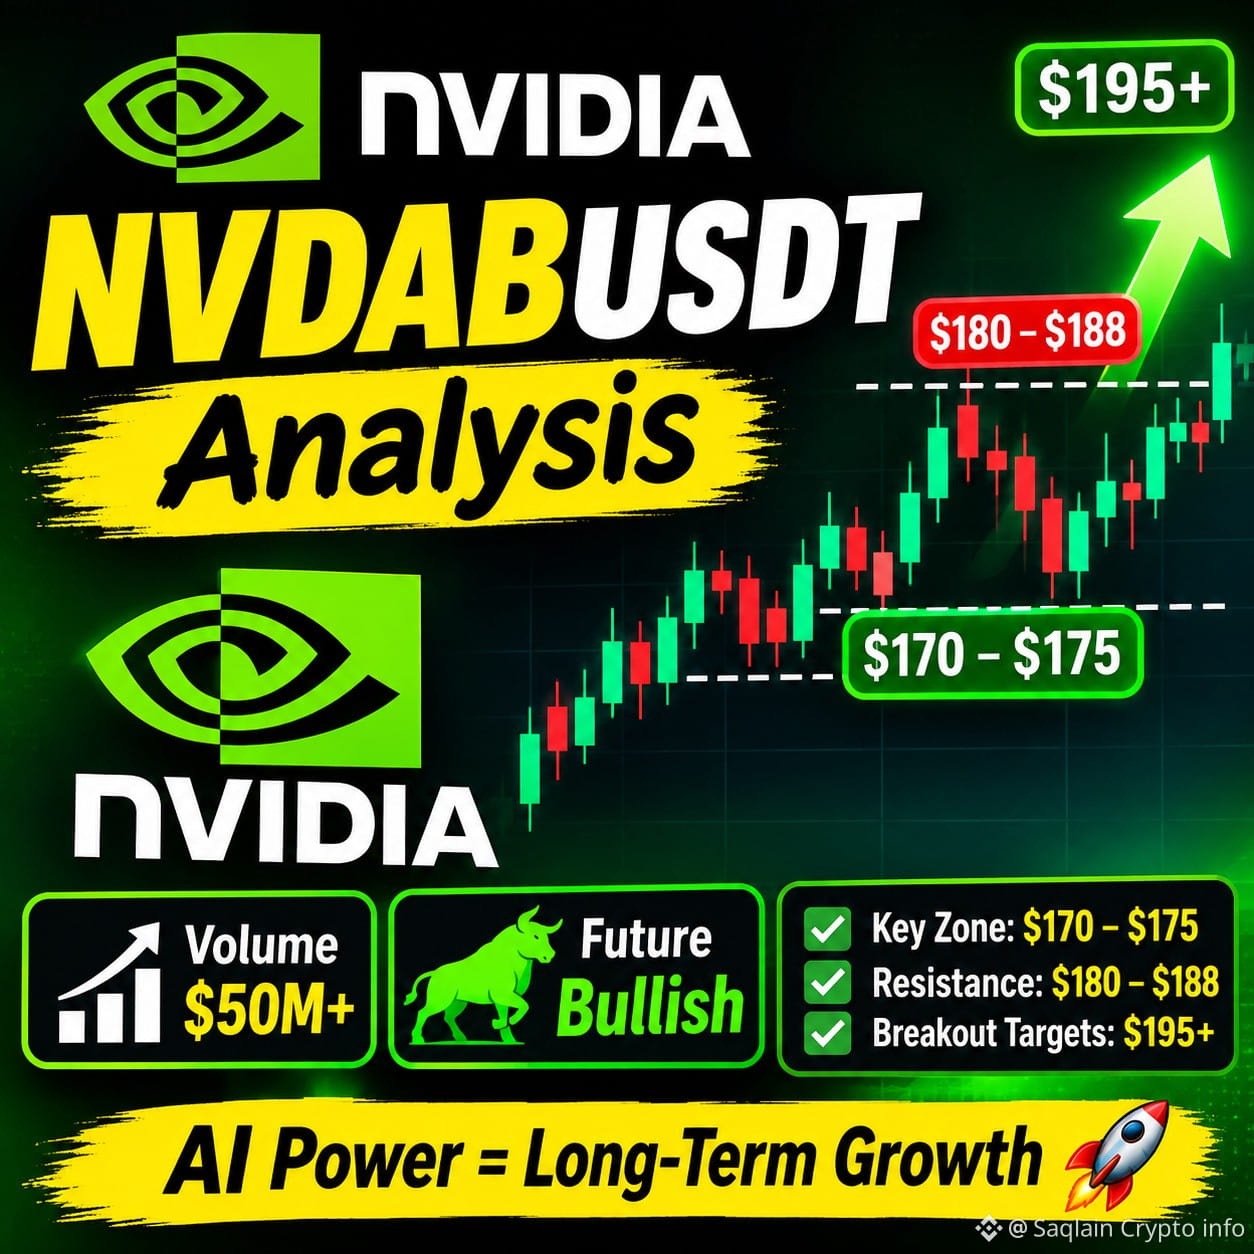
🚀 $NVDAB USDT — Bullish Recovery Setup?
$NVDAB is showing signs of recovery after a sharp correction. Price is around $176, with strong trading activity and volume.
📊 Volume: ~ $50M+ recent spot volume
📈 Momentum: Buyers are trying to regain control
🔥 Key Zone: $170–$175
🎯 Resistance: $180–$188
🚀 A breakout above $188 with strong volume could open the way toward $195+.
NVIDiA’s AI dominance and long-term growth story remain major catalysts, but short-term volatility is still high.
$NVDAB
Future: Bullish if $170–$175 holds and volume continues rising. A break below this zone could bring another correction.
{spot}(NVDABUSDT)
#NVDAB #NVDABUSDT #AI #Binance #TradFiForBeginners
🚀 $NVDAB USDT — Bullish Recovery Setup?
$NVDAB is showing signs of recovery after a sharp correction. Price is around $176, with strong trading activity and volume.
📊 Volume: ~ $50M+ recent spot volume
📈 Momentum: Buyers are trying to regain control
🔥 Key Zone: $170–$175
🎯 Resistance: $180–$188
🚀 A breakout above $188 with strong volume could open the way toward $195+.
NVIDiA’s AI dominance and long-term growth story remain major catalysts, but short-term volatility is still high.
$NVDAB
Future: Bullish if $170–$175 holds and volume continues rising. A break below this zone could bring another correction.
#NVDAB #NVDABUSDT #AI #Binance #TradFiForBeginners
$NVDAB is showing signs of recovery after a sharp correction. Price is around $176, with strong trading activity and volume.
📊 Volume: ~ $50M+ recent spot volume
📈 Momentum: Buyers are trying to regain control
🔥 Key Zone: $170–$175
🎯 Resistance: $180–$188
🚀 A breakout above $188 with strong volume could open the way toward $195+.
NVIDiA’s AI dominance and long-term growth story remain major catalysts, but short-term volatility is still high.
$NVDAB
Future: Bullish if $170–$175 holds and volume continues rising. A break below this zone could bring another correction.
#NVDAB #NVDABUSDT #AI #Binance #TradFiForBeginners
181

·
--
Bullish
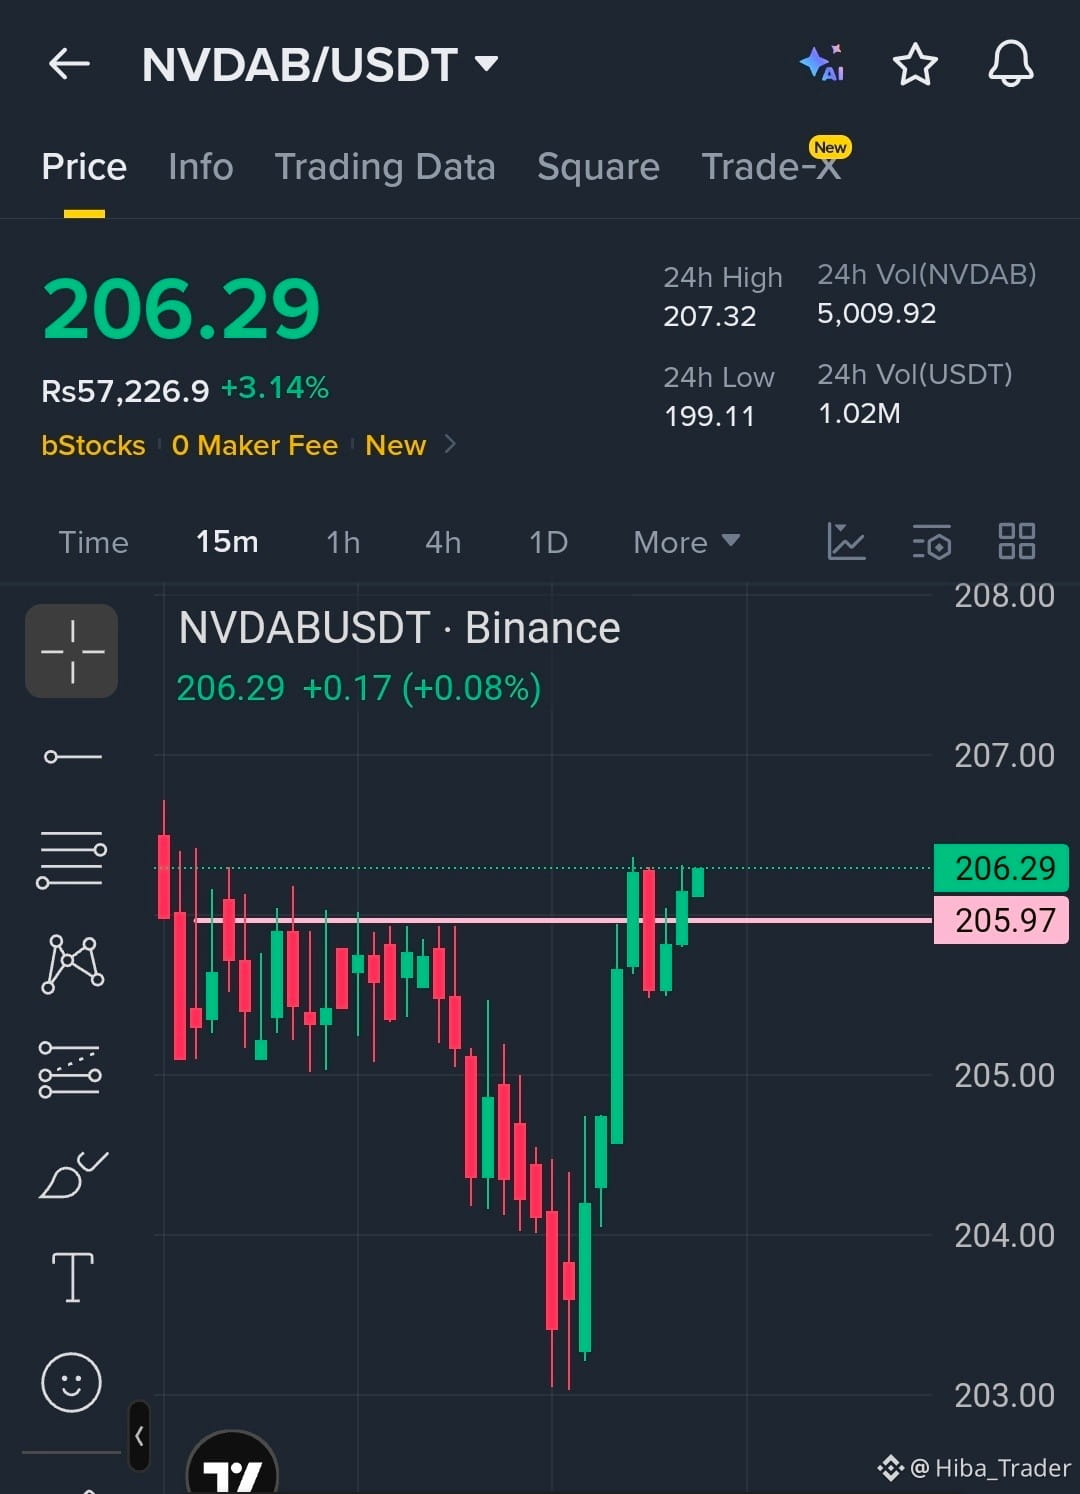
$NVDAB /USDT BULLISH CONSOLIDATION ABOVE SUPPORT – BREAKOUT ABOVE 207 COULD TRIGGER NEXT LEG UP
$NVDAB /USDT is currently trading around 206.29, showing a mild bullish structure after holding above the 205–204 support zone. Price is consolidating just below the key resistance at 207.3, indicating accumulation before a potential directional breakout. Buyers are still maintaining control as long as price stays above 205, but momentum is currently neutral-to-bullish pending confirmation.
If price breaks and holds above 207.3, it could trigger a fresh bullish continuation toward higher liquidity zones. However, failure to break resistance may lead to a short-term pullback toward support before another attempt upward.
---
Trade Setup
🔹 Long Position (Breakout Buy)
Entry: 207.5 – 208.0 (on confirmed breakout)
TP1: 209.5
TP2: 212.0
TP3: 215.0
SL: 203.8
🔹 Alternative Long (Support Buy)
Entry: 204.0 – 205.0
TP: same as above
SL: 201.5
🔹 Short Position (Rejection Trade)
Entry: 206.5 – 207.3 (if rejection confirmed)
TP1: 204.5
TP2: 202.0
TP3: 199.0
SL: 208.5
---
Market Outlook
Short-term trend remains slightly bullish as long as price holds above 205. A breakout above 207.3 would strengthen momentum, while rejection may extend sideways consolidation before the next move.
---
#NVDAB #NVDABUSDT #CryptoAnalysis #BreakoutWatch #TradingSetup
$NVDAB /USDT BULLISH CONSOLIDATION ABOVE SUPPORT – BREAKOUT ABOVE 207 COULD TRIGGER NEXT LEG UP
$NVDAB /USDT is currently trading around 206.29, showing a mild bullish structure after holding above the 205–204 support zone. Price is consolidating just below the key resistance at 207.3, indicating accumulation before a potential directional breakout. Buyers are still maintaining control as long as price stays above 205, but momentum is currently neutral-to-bullish pending confirmation.
If price breaks and holds above 207.3, it could trigger a fresh bullish continuation toward higher liquidity zones. However, failure to break resistance may lead to a short-term pullback toward support before another attempt upward.
---
Trade Setup
🔹 Long Position (Breakout Buy)
Entry: 207.5 – 208.0 (on confirmed breakout)
TP1: 209.5
TP2: 212.0
TP3: 215.0
SL: 203.8
🔹 Alternative Long (Support Buy)
Entry: 204.0 – 205.0
TP: same as above
SL: 201.5
🔹 Short Position (Rejection Trade)
Entry: 206.5 – 207.3 (if rejection confirmed)
TP1: 204.5
TP2: 202.0
TP3: 199.0
SL: 208.5
---
Market Outlook
Short-term trend remains slightly bullish as long as price holds above 205. A breakout above 207.3 would strengthen momentum, while rejection may extend sideways consolidation before the next move.
---
#NVDAB #NVDABUSDT #CryptoAnalysis #BreakoutWatch #TradingSetup
$NVDAB /USDT is currently trading around 206.29, showing a mild bullish structure after holding above the 205–204 support zone. Price is consolidating just below the key resistance at 207.3, indicating accumulation before a potential directional breakout. Buyers are still maintaining control as long as price stays above 205, but momentum is currently neutral-to-bullish pending confirmation.
If price breaks and holds above 207.3, it could trigger a fresh bullish continuation toward higher liquidity zones. However, failure to break resistance may lead to a short-term pullback toward support before another attempt upward.
---
Trade Setup
🔹 Long Position (Breakout Buy)
Entry: 207.5 – 208.0 (on confirmed breakout)
TP1: 209.5
TP2: 212.0
TP3: 215.0
SL: 203.8
🔹 Alternative Long (Support Buy)
Entry: 204.0 – 205.0
TP: same as above
SL: 201.5
🔹 Short Position (Rejection Trade)
Entry: 206.5 – 207.3 (if rejection confirmed)
TP1: 204.5
TP2: 202.0
TP3: 199.0
SL: 208.5
---
Market Outlook
Short-term trend remains slightly bullish as long as price holds above 205. A breakout above 207.3 would strengthen momentum, while rejection may extend sideways consolidation before the next move.
---
#NVDAB #NVDABUSDT #CryptoAnalysis #BreakoutWatch #TradingSetup
1
58
·
--
Bearish
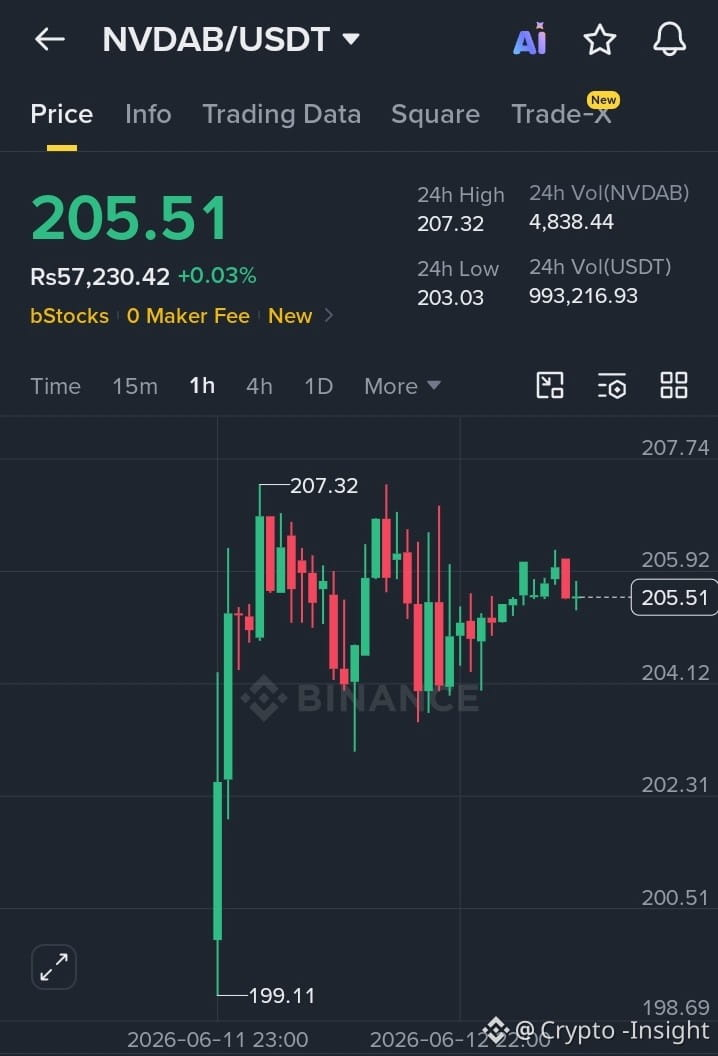
$NVDAB /USDT RANGE TIGHTENS — BREAKOUT MOMENT LOADING ABOVE 207 📊⚡
$NVDAB /USDT is consolidating in a tight range around 205 after repeated rejection from the 207.32–207.74 resistance zone. Price is holding above the 200–202 support area, showing equilibrium between buyers and sellers. The next move will likely be a volatility expansion once either side of the range breaks.
📈 Trade Setup (Long)
Entry: 203.00 – 205.50
TP1: 207.30
TP2: 210.00
TP3: 214.00
SL: 199.00
📉 Alternate Trade Setup (Short)
Entry: 206.50 – 207.50
TP1: 203.00
TP2: 200.50
TP3: 198.00
SL: 210.00
📊 Market Outlook
NVDAB is currently neutral with a slight bullish bias as long as price holds above 202. A breakout above 207.74 could trigger continuation toward higher levels, while a breakdown below 200 would shift momentum to the downside.
#NVDAB #NVDABUSDT #CryptoTrading #RangeBreakout #StocksToken $NVDAB
{spot}(NVDABUSDT)
$NVDAB /USDT RANGE TIGHTENS — BREAKOUT MOMENT LOADING ABOVE 207 📊⚡
$NVDAB /USDT is consolidating in a tight range around 205 after repeated rejection from the 207.32–207.74 resistance zone. Price is holding above the 200–202 support area, showing equilibrium between buyers and sellers. The next move will likely be a volatility expansion once either side of the range breaks.
📈 Trade Setup (Long)
Entry: 203.00 – 205.50
TP1: 207.30
TP2: 210.00
TP3: 214.00
SL: 199.00
📉 Alternate Trade Setup (Short)
Entry: 206.50 – 207.50
TP1: 203.00
TP2: 200.50
TP3: 198.00
SL: 210.00
📊 Market Outlook
NVDAB is currently neutral with a slight bullish bias as long as price holds above 202. A breakout above 207.74 could trigger continuation toward higher levels, while a breakdown below 200 would shift momentum to the downside.
#NVDAB #NVDABUSDT #CryptoTrading #RangeBreakout #StocksToken $NVDAB
$NVDAB /USDT is consolidating in a tight range around 205 after repeated rejection from the 207.32–207.74 resistance zone. Price is holding above the 200–202 support area, showing equilibrium between buyers and sellers. The next move will likely be a volatility expansion once either side of the range breaks.
📈 Trade Setup (Long)
Entry: 203.00 – 205.50
TP1: 207.30
TP2: 210.00
TP3: 214.00
SL: 199.00
📉 Alternate Trade Setup (Short)
Entry: 206.50 – 207.50
TP1: 203.00
TP2: 200.50
TP3: 198.00
SL: 210.00
📊 Market Outlook
NVDAB is currently neutral with a slight bullish bias as long as price holds above 202. A breakout above 207.74 could trigger continuation toward higher levels, while a breakdown below 200 would shift momentum to the downside.
#NVDAB #NVDABUSDT #CryptoTrading #RangeBreakout #StocksToken $NVDAB
12


·
--
Bearish
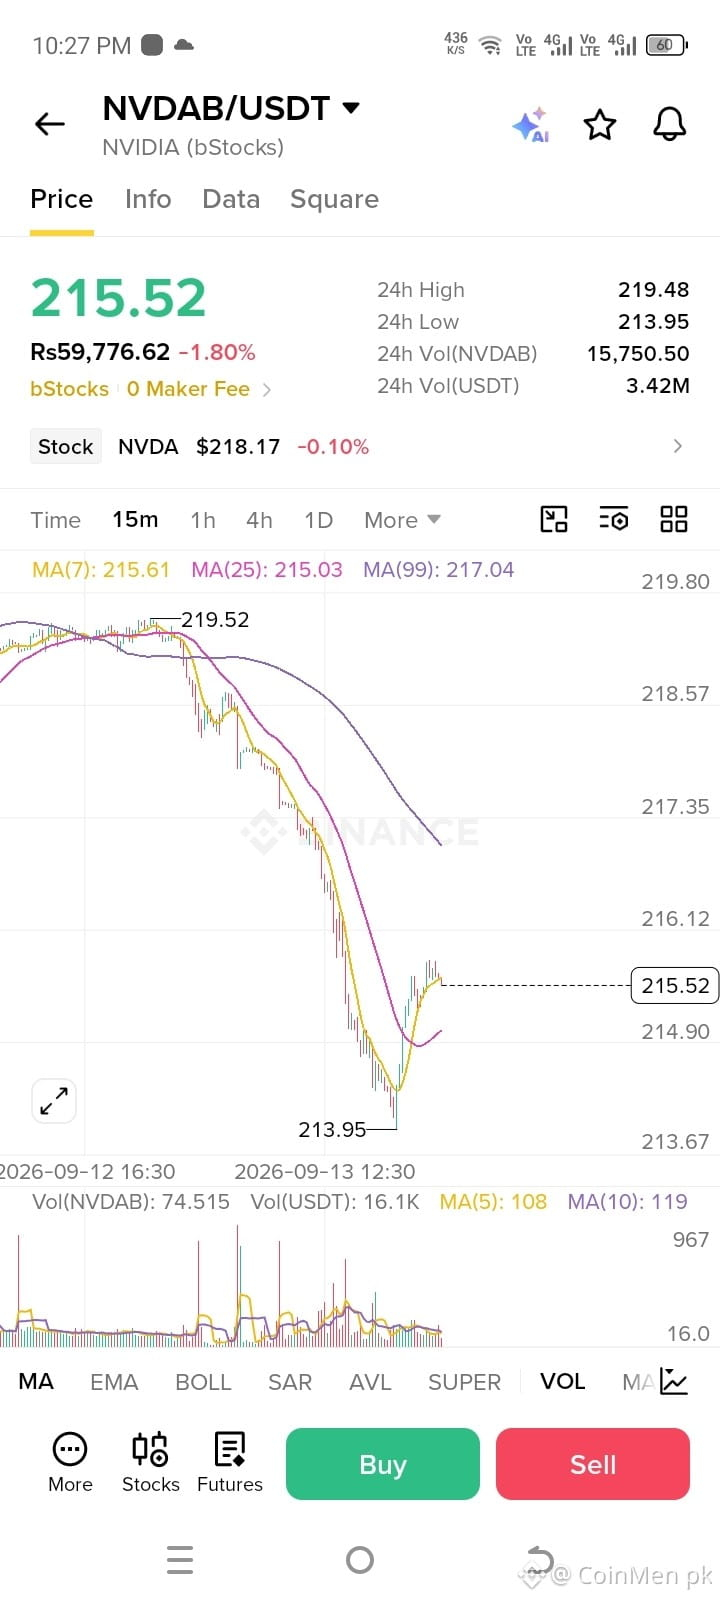
$NVDAB TRADERS, IS THE NEXT BREAKOUT COMING?
$NVDAB is holding around the $220 zone after a recent pullback. Buyers are trying to regain control, but the next resistance could decide the direction.
Support: $212–$215
Resistance: $224–$228
Breakout above $228 $235–$245 possible
Below $212 bullish setup weakens
I’m watching $228 closely. A clean breakout with strong volume could start the next leg higher.
Breakout or rejection? What’s your $NVDAB target?
$230, $240 or $250? 👇
⚠️ NFA. Trade with proper risk management.
{spot}(NVDABUSDT)
#NVDAB #NVDABUSDT #Crypto
#BinanceSquare #stocks
$NVDAB TRADERS, IS THE NEXT BREAKOUT COMING?
$NVDAB is holding around the $220 zone after a recent pullback. Buyers are trying to regain control, but the next resistance could decide the direction.
Support: $212–$215
Resistance: $224–$228
Breakout above $228 $235–$245 possible
Below $212 bullish setup weakens
I’m watching $228 closely. A clean breakout with strong volume could start the next leg higher.
Breakout or rejection? What’s your $NVDAB target?
$230, $240 or $250? 👇
⚠️ NFA. Trade with proper risk management.
#NVDAB #NVDABUSDT #Crypto
#BinanceSquare #stocks
$NVDAB is holding around the $220 zone after a recent pullback. Buyers are trying to regain control, but the next resistance could decide the direction.
Support: $212–$215
Resistance: $224–$228
Breakout above $228 $235–$245 possible
Below $212 bullish setup weakens
I’m watching $228 closely. A clean breakout with strong volume could start the next leg higher.
Breakout or rejection? What’s your $NVDAB target?
$230, $240 or $250? 👇
⚠️ NFA. Trade with proper risk management.
#NVDAB #NVDABUSDT #Crypto
#BinanceSquare #stocks
9
Log in to explore more content
Join global crypto users on Binance Square
⚡️ Get latest and useful information about crypto.
💬 Trusted by the world’s largest crypto exchange.
👍 Discover real insights from verified creators.
Email / Phone number
Trending Topics
1
#USPPIMissMayEaseBTCPressure
20,104 views
496 Discussing
2
#BitcoinCoreDisclosesTorTrafficVulnerability
6,055 views
223 Discussing
3
#WhatWillDriveCryptoandStocks’NextRebound?
119,096 views
1,427 Discussing
4
#BitcoinBreaksBelow200WeekMovingAverage
31,627 views
396 Discussing
5
#SpaceXTeslaMergerTalksWouldCombine30220BTC
10,893 views
205 Discussing
6
#Anthropic’s6xIPODemandSignalsPotentialRecordRaise
39,605 views
647 Discussing
7
#USCryptoETFsLose$1.48BInFiveDays
1,919 views
39 Discussing
8
#KoreaDigitalAssetBasicActFinalDraftExpectedEarlyJanuary
3,427 views
20 Discussing
9
#RippleRLUSDMarketCapSurpassesPayPalPYUSD
6,288 views
114 Discussing
10
#JaneStreetNearlyOctuplesFidelityBitcoinETFHoldings
14,967 views
227 Discussing