
#learnwithfatima
learnwithfatima
1M views
2,280 Discussing
Hot
Latest


·
--

Article
Beyond the Closing Bell: How 24/7 Markets Are Changing Price DiscoveryThe traditional trading week is becoming less relevant for certain market events.
U.S. equity markets operate for only 32.5 hours per week, equal to 19.3% of the total week, while those regular sessions still account for 87.2% of U.S. equity volume. The remaining 80.7% of the week has historically offered limited access to traditional equity markets.
That gap is now becoming a market of its own.
RWA-linked perpetuals allow traders to maintain exposure to equity-linked assets, ETFs and even selected pre-IPO companies outside normal U.S. market hours. Recent events around the September 16 FOMC decision, September 17 SEC Innovation Exemption, September 21 S&P DJI rebalance and Anthropic's expected IPO provide four different examples of how this market is developing.
The important question is not simply whether assets can trade 24/7.
It is whether price discovery is increasingly happening before traditional markets reopen.
The Fed Decision Tested Overnight Price Discovery
On September 16, 2026, the Federal Open Market Committee raised the federal funds target range by 25 basis points to 3.75%-4.00%.
The decision was unanimous at 12-0, but the dot plot delivered the stronger signal. 16 of 18 FOMC participants projected at least one additional rate increase by the end of 2026.
That was a major change from the start of the year, when markets had been pricing roughly four rate cuts.
The Treasury market was also moving. The U.S. 10-year yield had increased from 4.76% to 5.01% during September, a 25-basis-point rise, adding to the sensitivity around inflation, oil prices and future Fed policy.
The Fed statement arrived at 18:00 UTC, only two hours before the U.S. cash-market close.
That left a relatively narrow window for traditional equities to respond.
Perpetual markets, however, remained open.
From Wednesday's close to Thursday's U.S. equity open, several contracts recorded substantial moves:
Contract| Overnight moveSPYUSDT| +1.11%TMFUSDT| +2.45%TBTUSDT| -1.32%UVXYUSDT| -5.94%
Across 16 equity-linked perpetuals, the median contract captured 97% of the subsequent opening gap.
The individual figures were also striking:
SPY: 91%QQQ: 97%IWM: 99%TMF: 104%UVXY: 96%
The directional hit rate across the 16-name sample was 100%, while approximately US$1.02 billion traded while U.S. cash markets were closed.
This does not mean perpetual prices perfectly predict the next session. The data instead shows that a significant amount of the next session's directional move had already been reflected in an always-open market.
The SEC Announcement Produced a Different Reaction
The next test came from regulation rather than monetary policy.
On September 17, the SEC announced temporary conditional exemptions covering certain distributed-ledger venues trading tokenized NMS stocks and certain liquidity providers. The exemptions are scheduled to run until September 17, 2031, subject to their conditions and possible modification.
The timing was important because the announcement arrived around the U.S. market close.
The response was concentrated in crypto-linked equities rather than the broader equity market.
From Thursday's 20:00 UTC close through Friday's 13:30 UTC open:
HOOD +4.67%CRCL +4.43%BMNR +4.18%MSTR +4.04%COIN +3.24%
Meanwhile:
SPY -0.16%
This created a clear separation between the broader market and companies more directly connected to the crypto and tokenization theme.
But there was an important difference from the FOMC example.
The perpetual market's median priced-in ratio was approximately 140% of the eventual opening gap.
In other words, the overnight market correctly captured the direction, but the magnitude was subsequently adjusted when traditional cash-market liquidity returned.
That distinction is important.
Continuous trading can provide earlier price discovery without guaranteeing precise price discovery.
The overnight market can tell traders where positioning is developing, while the opening auction and deeper cash liquidity can still change the final magnitude.
The Weekend Became a Tradable Event
The next example moved beyond overnight trading.
The S&P DJI rebalance became effective before the September 21, 2026 Monday open. The rebalance had already been announced on September 4, meaning traders had several weeks to position around the event.
During the market closure surrounding the rebalance, 198 TradFi perpetuals recorded US$7.25 billion in trading volume.
That is a much broader market than a single stock or ETF.
The index additions gained an average of 1.01%, compared with 0.39% for SPY.
That represented approximately 0.6 percentage points of relative performance against the benchmark.
But the individual results were far from uniform.
The most heavily traded addition by notional was SNDK, with approximately US$744 million traded.
Its return?
Only +0.30%.
That is an important detail because it shows that simply being added to an index did not automatically determine the strongest individual performance.
With 24/7 perpetual markets, traders could take different positions on individual constituents throughout the weekend instead of waiting for Monday's opening session.
The market was therefore not only trading the index event.
It was trading the differences between individual names.
Anthropic Shows How Early Price Discovery Can Begin
The most unusual part of the report is arguably the pre-IPO market.
Anthropic does not yet have publicly traded shares, but a perpetual market is already allowing eligible traders to form views around its implied valuation.
In September 2026, Anthropic perpetual trading reached US$643 million in month-to-date volume, already exceeding the US$590 million recorded during all of August.
Across 12 venues:
Binance accounted for 32% of September volume.
Industry open interest reached approximately US$80 million, with Binance representing 39% of that open interest.
On Binance alone, open interest increased from US$16.6 million to US$31.2 million over 30 days.
That is an 88% increase.
The price had also moved substantially.
From August 1 to September 21, the Anthropic perpetual increased from approximately US$1,437 to US$2,091, representing a 45.5% increase.
Then came reports that Anthropic had pushed its expected IPO timing toward November.
The weekend reaction was relatively small.
The perpetual moved from approximately US$2,103 to US$2,084, a decline of just 0.89%.
At the same time, the OpenAI perpetual gained approximately 3.00%.
The limited Anthropic reaction does not prove exactly how much of the IPO-delay information had already been priced in. It does, however, show that a market was already available to absorb company-specific information before a conventional public listing.
And there is an important distinction:
Trading the Anthropic perpetual does not provide ownership of Anthropic shares or an entitlement to an eventual IPO allocation.
It is derivative exposure to a market-implied price
Four Events, Four Different Types of Information
These examples cover very different catalysts:
September 16: monetary policySeptember 17: securities regulationSeptember 21: index rebalancingSeptember 2026: pre-IPO company developments
Yet the underlying mechanism was similar.
Information arrived when traditional equity markets were closed or unavailable, and perpetual markets provided a venue for traders to adjust exposure immediately.
That is where the significance of RWA-linked perpetuals becomes clearer.
They are not simply extending trading hours.
They are creating a separate layer of continuous market-based expectations around traditional assets and events.
The Data Behind the Shift
Several figures from the September 22 Binance Research report illustrate the scale:
19.3% — share of the week occupied by regular U.S. equity sessions87.2% — share of U.S. equity volume occurring during those sessionsUS$1.02B — perpetual volume outside regular U.S. hours after the FOMC97% — median opening-gap capture across 16 equity-linked perpetuals100% — directional hit rate in the 16-name FOMC sampleUS$7.25B — TradFi perpetual volume around the S&P rebalance weekend198 — TradFi perpetual contracts included in that weekend activity1.01% — average return of S&P rebalance additions0.39% — SPY return over the same comparisonUS$744M — SNDK notional traded, the largest among the selected additionsUS$643M — Anthropic perpetual volume in September MTDUS$590M — Anthropic perpetual volume during August32% — Binance share of September Anthropic volume39% — Binance share of industry Anthropic open interestUS$16.6M → US$31.2M — Binance Anthropic open interest over 30 days+88% — increase in that open interest+45.5% — Anthropic perpetual price change from August 1 to September 21
These figures point to activity, not merely theory.
What This Means for Market Structure
The biggest change may be the reduction in the importance of the traditional opening bell.
For decades, the closing bell created a natural pause. A major announcement after hours could generate a large gap when trading resumed because investors had to wait for the next session to express their views through conventional markets.
That structure is becoming less absolute.
A Fed decision can be repriced overnight.
regulatory announcement can move crypto-linked equities before the next open.
An index rebalance can be traded throughout the weekend.
A private company's valuation can develop a liquid derivative market before its shares are publicly listed.
This does not eliminate opening gaps.
Instead, it potentially moves part of the price-discovery process earlier.
The September data also shows why the distinction between direction and magnitude matters.
The FOMC sample showed a 97% median capture of the opening move, while the SEC-related episode had a 140% median priced-in ratio.
So 24/7 pricing should not automatically be interpreted as a perfect forecast of the next cash-market price.
It is better understood as another layer of information about how traders are positioning when traditional markets are closed.
The Bigger Takeaway
The RWA narrative is often discussed in terms of tokenizing assets.
But the more interesting development may be what happens after an asset becomes tradable on-chain.
Once a market can operate continuously, the traditional distinction between “market hours” and “market closed” becomes less meaningful.
The September 2026 examples show four different stages of that transition:
Macro information → overnight repricingRegulatory information → sector-specific repricingKnown index events → weekend positioningPrivate-company developments → pre-IPO price discovery
The numbers are still early, and perpetual markets have their own risks, including funding costs, liquidity differences and the possibility that overnight prices diverge from the eventual cash-market opening.
But the direction of market structure is becoming clearer.
The question is no longer whether investors can trade outside the traditional session.
They already can.
The more important question is:
If information can be priced 24/7, how much of the “opening bell” will still remain as a true starting point for price discovery?
This is informational content, not investment advice.
#LearnWithFatima $BTC
{future}(BTCUSDT)
Beyond the Closing Bell: How 24/7 Markets Are Changing Price Discovery
The traditional trading week is becoming less relevant for certain market events.
U.S. equity markets operate for only 32.5 hours per week, equal to 19.3% of the total week, while those regular sessions still account for 87.2% of U.S. equity volume. The remaining 80.7% of the week has historically offered limited access to traditional equity markets.
That gap is now becoming a market of its own.
RWA-linked perpetuals allow traders to maintain exposure to equity-linked assets, ETFs and even selected pre-IPO companies outside normal U.S. market hours. Recent events around the September 16 FOMC decision, September 17 SEC Innovation Exemption, September 21 S&P DJI rebalance and Anthropic's expected IPO provide four different examples of how this market is developing.
The important question is not simply whether assets can trade 24/7.
It is whether price discovery is increasingly happening before traditional markets reopen.
The Fed Decision Tested Overnight Price Discovery
On September 16, 2026, the Federal Open Market Committee raised the federal funds target range by 25 basis points to 3.75%-4.00%.
The decision was unanimous at 12-0, but the dot plot delivered the stronger signal. 16 of 18 FOMC participants projected at least one additional rate increase by the end of 2026.
That was a major change from the start of the year, when markets had been pricing roughly four rate cuts.
The Treasury market was also moving. The U.S. 10-year yield had increased from 4.76% to 5.01% during September, a 25-basis-point rise, adding to the sensitivity around inflation, oil prices and future Fed policy.
The Fed statement arrived at 18:00 UTC, only two hours before the U.S. cash-market close.
That left a relatively narrow window for traditional equities to respond.
Perpetual markets, however, remained open.
From Wednesday's close to Thursday's U.S. equity open, several contracts recorded substantial moves:
Contract| Overnight moveSPYUSDT| +1.11%TMFUSDT| +2.45%TBTUSDT| -1.32%UVXYUSDT| -5.94%
Across 16 equity-linked perpetuals, the median contract captured 97% of the subsequent opening gap.
The individual figures were also striking:
SPY: 91%QQQ: 97%IWM: 99%TMF: 104%UVXY: 96%
The directional hit rate across the 16-name sample was 100%, while approximately US$1.02 billion traded while U.S. cash markets were closed.
This does not mean perpetual prices perfectly predict the next session. The data instead shows that a significant amount of the next session's directional move had already been reflected in an always-open market.
The SEC Announcement Produced a Different Reaction
The next test came from regulation rather than monetary policy.
On September 17, the SEC announced temporary conditional exemptions covering certain distributed-ledger venues trading tokenized NMS stocks and certain liquidity providers. The exemptions are scheduled to run until September 17, 2031, subject to their conditions and possible modification.
The timing was important because the announcement arrived around the U.S. market close.
The response was concentrated in crypto-linked equities rather than the broader equity market.
From Thursday's 20:00 UTC close through Friday's 13:30 UTC open:
HOOD +4.67%CRCL +4.43%BMNR +4.18%MSTR +4.04%COIN +3.24%
Meanwhile:
SPY -0.16%
This created a clear separation between the broader market and companies more directly connected to the crypto and tokenization theme.
But there was an important difference from the FOMC example.
The perpetual market's median priced-in ratio was approximately 140% of the eventual opening gap.
In other words, the overnight market correctly captured the direction, but the magnitude was subsequently adjusted when traditional cash-market liquidity returned.
That distinction is important.
Continuous trading can provide earlier price discovery without guaranteeing precise price discovery.
The overnight market can tell traders where positioning is developing, while the opening auction and deeper cash liquidity can still change the final magnitude.
The Weekend Became a Tradable Event
The next example moved beyond overnight trading.
The S&P DJI rebalance became effective before the September 21, 2026 Monday open. The rebalance had already been announced on September 4, meaning traders had several weeks to position around the event.
During the market closure surrounding the rebalance, 198 TradFi perpetuals recorded US$7.25 billion in trading volume.
That is a much broader market than a single stock or ETF.
The index additions gained an average of 1.01%, compared with 0.39% for SPY.
That represented approximately 0.6 percentage points of relative performance against the benchmark.
But the individual results were far from uniform.
The most heavily traded addition by notional was SNDK, with approximately US$744 million traded.
Its return?
Only +0.30%.
That is an important detail because it shows that simply being added to an index did not automatically determine the strongest individual performance.
With 24/7 perpetual markets, traders could take different positions on individual constituents throughout the weekend instead of waiting for Monday's opening session.
The market was therefore not only trading the index event.
It was trading the differences between individual names.
Anthropic Shows How Early Price Discovery Can Begin
The most unusual part of the report is arguably the pre-IPO market.
Anthropic does not yet have publicly traded shares, but a perpetual market is already allowing eligible traders to form views around its implied valuation.
In September 2026, Anthropic perpetual trading reached US$643 million in month-to-date volume, already exceeding the US$590 million recorded during all of August.
Across 12 venues:
Binance accounted for 32% of September volume.
Industry open interest reached approximately US$80 million, with Binance representing 39% of that open interest.
On Binance alone, open interest increased from US$16.6 million to US$31.2 million over 30 days.
That is an 88% increase.
The price had also moved substantially.
From August 1 to September 21, the Anthropic perpetual increased from approximately US$1,437 to US$2,091, representing a 45.5% increase.
Then came reports that Anthropic had pushed its expected IPO timing toward November.
The weekend reaction was relatively small.
The perpetual moved from approximately US$2,103 to US$2,084, a decline of just 0.89%.
At the same time, the OpenAI perpetual gained approximately 3.00%.
The limited Anthropic reaction does not prove exactly how much of the IPO-delay information had already been priced in. It does, however, show that a market was already available to absorb company-specific information before a conventional public listing.
And there is an important distinction:
Trading the Anthropic perpetual does not provide ownership of Anthropic shares or an entitlement to an eventual IPO allocation.
It is derivative exposure to a market-implied price
Four Events, Four Different Types of Information
These examples cover very different catalysts:
September 16: monetary policySeptember 17: securities regulationSeptember 21: index rebalancingSeptember 2026: pre-IPO company developments
Yet the underlying mechanism was similar.
Information arrived when traditional equity markets were closed or unavailable, and perpetual markets provided a venue for traders to adjust exposure immediately.
That is where the significance of RWA-linked perpetuals becomes clearer.
They are not simply extending trading hours.
They are creating a separate layer of continuous market-based expectations around traditional assets and events.
The Data Behind the Shift
Several figures from the September 22 Binance Research report illustrate the scale:
19.3% — share of the week occupied by regular U.S. equity sessions87.2% — share of U.S. equity volume occurring during those sessionsUS$1.02B — perpetual volume outside regular U.S. hours after the FOMC97% — median opening-gap capture across 16 equity-linked perpetuals100% — directional hit rate in the 16-name FOMC sampleUS$7.25B — TradFi perpetual volume around the S&P rebalance weekend198 — TradFi perpetual contracts included in that weekend activity1.01% — average return of S&P rebalance additions0.39% — SPY return over the same comparisonUS$744M — SNDK notional traded, the largest among the selected additionsUS$643M — Anthropic perpetual volume in September MTDUS$590M — Anthropic perpetual volume during August32% — Binance share of September Anthropic volume39% — Binance share of industry Anthropic open interestUS$16.6M → US$31.2M — Binance Anthropic open interest over 30 days+88% — increase in that open interest+45.5% — Anthropic perpetual price change from August 1 to September 21
These figures point to activity, not merely theory.
What This Means for Market Structure
The biggest change may be the reduction in the importance of the traditional opening bell.
For decades, the closing bell created a natural pause. A major announcement after hours could generate a large gap when trading resumed because investors had to wait for the next session to express their views through conventional markets.
That structure is becoming less absolute.
A Fed decision can be repriced overnight.
regulatory announcement can move crypto-linked equities before the next open.
An index rebalance can be traded throughout the weekend.
A private company's valuation can develop a liquid derivative market before its shares are publicly listed.
This does not eliminate opening gaps.
Instead, it potentially moves part of the price-discovery process earlier.
The September data also shows why the distinction between direction and magnitude matters.
The FOMC sample showed a 97% median capture of the opening move, while the SEC-related episode had a 140% median priced-in ratio.
So 24/7 pricing should not automatically be interpreted as a perfect forecast of the next cash-market price.
It is better understood as another layer of information about how traders are positioning when traditional markets are closed.
The Bigger Takeaway
The RWA narrative is often discussed in terms of tokenizing assets.
But the more interesting development may be what happens after an asset becomes tradable on-chain.
Once a market can operate continuously, the traditional distinction between “market hours” and “market closed” becomes less meaningful.
The September 2026 examples show four different stages of that transition:
Macro information → overnight repricingRegulatory information → sector-specific repricingKnown index events → weekend positioningPrivate-company developments → pre-IPO price discovery
The numbers are still early, and perpetual markets have their own risks, including funding costs, liquidity differences and the possibility that overnight prices diverge from the eventual cash-market opening.
But the direction of market structure is becoming clearer.
The question is no longer whether investors can trade outside the traditional session.
They already can.
The more important question is:
If information can be priced 24/7, how much of the “opening bell” will still remain as a true starting point for price discovery?
This is informational content, not investment advice.
#LearnWithFatima $BTC
U.S. equity markets operate for only 32.5 hours per week, equal to 19.3% of the total week, while those regular sessions still account for 87.2% of U.S. equity volume. The remaining 80.7% of the week has historically offered limited access to traditional equity markets.
That gap is now becoming a market of its own.
RWA-linked perpetuals allow traders to maintain exposure to equity-linked assets, ETFs and even selected pre-IPO companies outside normal U.S. market hours. Recent events around the September 16 FOMC decision, September 17 SEC Innovation Exemption, September 21 S&P DJI rebalance and Anthropic's expected IPO provide four different examples of how this market is developing.
The important question is not simply whether assets can trade 24/7.
It is whether price discovery is increasingly happening before traditional markets reopen.
The Fed Decision Tested Overnight Price Discovery
On September 16, 2026, the Federal Open Market Committee raised the federal funds target range by 25 basis points to 3.75%-4.00%.
The decision was unanimous at 12-0, but the dot plot delivered the stronger signal. 16 of 18 FOMC participants projected at least one additional rate increase by the end of 2026.
That was a major change from the start of the year, when markets had been pricing roughly four rate cuts.
The Treasury market was also moving. The U.S. 10-year yield had increased from 4.76% to 5.01% during September, a 25-basis-point rise, adding to the sensitivity around inflation, oil prices and future Fed policy.
The Fed statement arrived at 18:00 UTC, only two hours before the U.S. cash-market close.
That left a relatively narrow window for traditional equities to respond.
Perpetual markets, however, remained open.
From Wednesday's close to Thursday's U.S. equity open, several contracts recorded substantial moves:
Contract| Overnight moveSPYUSDT| +1.11%TMFUSDT| +2.45%TBTUSDT| -1.32%UVXYUSDT| -5.94%
Across 16 equity-linked perpetuals, the median contract captured 97% of the subsequent opening gap.
The individual figures were also striking:
SPY: 91%QQQ: 97%IWM: 99%TMF: 104%UVXY: 96%
The directional hit rate across the 16-name sample was 100%, while approximately US$1.02 billion traded while U.S. cash markets were closed.
This does not mean perpetual prices perfectly predict the next session. The data instead shows that a significant amount of the next session's directional move had already been reflected in an always-open market.
The SEC Announcement Produced a Different Reaction
The next test came from regulation rather than monetary policy.
On September 17, the SEC announced temporary conditional exemptions covering certain distributed-ledger venues trading tokenized NMS stocks and certain liquidity providers. The exemptions are scheduled to run until September 17, 2031, subject to their conditions and possible modification.
The timing was important because the announcement arrived around the U.S. market close.
The response was concentrated in crypto-linked equities rather than the broader equity market.
From Thursday's 20:00 UTC close through Friday's 13:30 UTC open:
HOOD +4.67%CRCL +4.43%BMNR +4.18%MSTR +4.04%COIN +3.24%
Meanwhile:
SPY -0.16%
This created a clear separation between the broader market and companies more directly connected to the crypto and tokenization theme.
But there was an important difference from the FOMC example.
The perpetual market's median priced-in ratio was approximately 140% of the eventual opening gap.
In other words, the overnight market correctly captured the direction, but the magnitude was subsequently adjusted when traditional cash-market liquidity returned.
That distinction is important.
Continuous trading can provide earlier price discovery without guaranteeing precise price discovery.
The overnight market can tell traders where positioning is developing, while the opening auction and deeper cash liquidity can still change the final magnitude.
The Weekend Became a Tradable Event
The next example moved beyond overnight trading.
The S&P DJI rebalance became effective before the September 21, 2026 Monday open. The rebalance had already been announced on September 4, meaning traders had several weeks to position around the event.
During the market closure surrounding the rebalance, 198 TradFi perpetuals recorded US$7.25 billion in trading volume.
That is a much broader market than a single stock or ETF.
The index additions gained an average of 1.01%, compared with 0.39% for SPY.
That represented approximately 0.6 percentage points of relative performance against the benchmark.
But the individual results were far from uniform.
The most heavily traded addition by notional was SNDK, with approximately US$744 million traded.
Its return?
Only +0.30%.
That is an important detail because it shows that simply being added to an index did not automatically determine the strongest individual performance.
With 24/7 perpetual markets, traders could take different positions on individual constituents throughout the weekend instead of waiting for Monday's opening session.
The market was therefore not only trading the index event.
It was trading the differences between individual names.
Anthropic Shows How Early Price Discovery Can Begin
The most unusual part of the report is arguably the pre-IPO market.
Anthropic does not yet have publicly traded shares, but a perpetual market is already allowing eligible traders to form views around its implied valuation.
In September 2026, Anthropic perpetual trading reached US$643 million in month-to-date volume, already exceeding the US$590 million recorded during all of August.
Across 12 venues:
Binance accounted for 32% of September volume.
Industry open interest reached approximately US$80 million, with Binance representing 39% of that open interest.
On Binance alone, open interest increased from US$16.6 million to US$31.2 million over 30 days.
That is an 88% increase.
The price had also moved substantially.
From August 1 to September 21, the Anthropic perpetual increased from approximately US$1,437 to US$2,091, representing a 45.5% increase.
Then came reports that Anthropic had pushed its expected IPO timing toward November.
The weekend reaction was relatively small.
The perpetual moved from approximately US$2,103 to US$2,084, a decline of just 0.89%.
At the same time, the OpenAI perpetual gained approximately 3.00%.
The limited Anthropic reaction does not prove exactly how much of the IPO-delay information had already been priced in. It does, however, show that a market was already available to absorb company-specific information before a conventional public listing.
And there is an important distinction:
Trading the Anthropic perpetual does not provide ownership of Anthropic shares or an entitlement to an eventual IPO allocation.
It is derivative exposure to a market-implied price
Four Events, Four Different Types of Information
These examples cover very different catalysts:
September 16: monetary policySeptember 17: securities regulationSeptember 21: index rebalancingSeptember 2026: pre-IPO company developments
Yet the underlying mechanism was similar.
Information arrived when traditional equity markets were closed or unavailable, and perpetual markets provided a venue for traders to adjust exposure immediately.
That is where the significance of RWA-linked perpetuals becomes clearer.
They are not simply extending trading hours.
They are creating a separate layer of continuous market-based expectations around traditional assets and events.
The Data Behind the Shift
Several figures from the September 22 Binance Research report illustrate the scale:
19.3% — share of the week occupied by regular U.S. equity sessions87.2% — share of U.S. equity volume occurring during those sessionsUS$1.02B — perpetual volume outside regular U.S. hours after the FOMC97% — median opening-gap capture across 16 equity-linked perpetuals100% — directional hit rate in the 16-name FOMC sampleUS$7.25B — TradFi perpetual volume around the S&P rebalance weekend198 — TradFi perpetual contracts included in that weekend activity1.01% — average return of S&P rebalance additions0.39% — SPY return over the same comparisonUS$744M — SNDK notional traded, the largest among the selected additionsUS$643M — Anthropic perpetual volume in September MTDUS$590M — Anthropic perpetual volume during August32% — Binance share of September Anthropic volume39% — Binance share of industry Anthropic open interestUS$16.6M → US$31.2M — Binance Anthropic open interest over 30 days+88% — increase in that open interest+45.5% — Anthropic perpetual price change from August 1 to September 21
These figures point to activity, not merely theory.
What This Means for Market Structure
The biggest change may be the reduction in the importance of the traditional opening bell.
For decades, the closing bell created a natural pause. A major announcement after hours could generate a large gap when trading resumed because investors had to wait for the next session to express their views through conventional markets.
That structure is becoming less absolute.
A Fed decision can be repriced overnight.
regulatory announcement can move crypto-linked equities before the next open.
An index rebalance can be traded throughout the weekend.
A private company's valuation can develop a liquid derivative market before its shares are publicly listed.
This does not eliminate opening gaps.
Instead, it potentially moves part of the price-discovery process earlier.
The September data also shows why the distinction between direction and magnitude matters.
The FOMC sample showed a 97% median capture of the opening move, while the SEC-related episode had a 140% median priced-in ratio.
So 24/7 pricing should not automatically be interpreted as a perfect forecast of the next cash-market price.
It is better understood as another layer of information about how traders are positioning when traditional markets are closed.
The Bigger Takeaway
The RWA narrative is often discussed in terms of tokenizing assets.
But the more interesting development may be what happens after an asset becomes tradable on-chain.
Once a market can operate continuously, the traditional distinction between “market hours” and “market closed” becomes less meaningful.
The September 2026 examples show four different stages of that transition:
Macro information → overnight repricingRegulatory information → sector-specific repricingKnown index events → weekend positioningPrivate-company developments → pre-IPO price discovery
The numbers are still early, and perpetual markets have their own risks, including funding costs, liquidity differences and the possibility that overnight prices diverge from the eventual cash-market opening.
But the direction of market structure is becoming clearer.
The question is no longer whether investors can trade outside the traditional session.
They already can.
The more important question is:
If information can be priced 24/7, how much of the “opening bell” will still remain as a true starting point for price discovery?
This is informational content, not investment advice.
#LearnWithFatima $BTC
1
142
·
--
Article
Bitcoin Breaks $85K as Short Squeeze Meets a New Macro TestBitcoin entered the week with its strongest move in months, climbing above $85,000 on September 21 and reaching an intraday high around $85,166, its highest level since January. The move came after BTC reclaimed the $80,000–$82,000 area and followed its first weekly close above the 50-week moving average in 45 weeks.
The important question now is not simply whether Bitcoin can keep moving higher. It is whether the rally can transition from short-covering into sustained spot demand while BTC enters a major holder supply zone and macro conditions remain complicated.
$85K Breakout Was Powerful, But Leverage Did Much of the Work
The latest move was accompanied by a major derivatives flush.
CoinGlass data reported by The Block showed more than $750 million in crypto liquidations over 24 hours, including approximately $648.3 million in short positions. Bitcoin alone accounted for about $360.7 million of liquidations.
On the shorter one-hour window, more than $262 million of shorts were liquidated as BTC crossed $84,000, while total crypto liquidations reached roughly $272 million.
That matters because forced buying can accelerate a breakout without necessarily proving that fresh investors are aggressively accumulating at spot.
There is evidence of genuine demand as well. U.S. spot Bitcoin ETFs recorded about $433 million of net inflows on September 18, with Fidelity's fund accounting for roughly $311 million.
So the current setup is mixed: ETF demand has returned, but leverage-driven buying has also been a major part of the move.
Long-Term Holders Are Selling Less as BTC Enters the $83K–$86K Zone
Another important change is happening on the supply side.
Recent on-chain analysis cited by Binance News shows that Bitcoin held by long-term holders has declined for five consecutive weeks since August 19, but the pace of distribution has slowed sharply.
The figures circulating in the latest market analysis put LTH net distribution at roughly 105,900 BTC on August 30 versus 21,700 BTC on September 20, representing an approximately 80% reduction in the pace of selling.
That slowdown is important because BTC is now moving through the $83,000–$86,000 area identified as a significant long-term-holder supply concentration.
If holders who bought around these levels use the recovery to exit at breakeven, the zone could create additional supply. On the other hand, if BTC absorbs that supply without another major distribution wave, the market structure becomes more interesting.
The distinction is simple:
Breaking $85K is the price signal.
Holding $85K against existing holder supply is the confirmation signal.
Hashrate Is Recovering, But Miners Are Still Lagging Bitcoin
Bitcoin's network economics are also changing as price rises.
A move from roughly $75,000 to $85,000 represents a 13% increase in BTC's price, improving miner revenue per unit of computing power before accounting for difficulty changes.
The hashrate recovery therefore makes economic sense: higher BTC prices can bring marginal mining machines back toward profitability.
But mining equities have not matched Bitcoin's performance. The Block reported that the median return among tracked Bitcoin mining companies was only 1.8%, while Core Scientific underperformed Bitcoin by 27% and TeraWulf by 24%. AI data-center ambitions and the capital requirements of those businesses have complicated the relationship between mining stocks and BTC itself.
There is also a natural limit. Bitcoin's difficulty adjusts approximately every two weeks, so if hashrate continues increasing without a comparable BTC price increase, competition for block rewards increases and revenue per unit of computing power is compressed.
Technically, the next major level being watched is around $89,000, close to the 100-week moving average cited by market analysts.
The Macro Picture Is Still Far From Easy
Bitcoin's rally is happening while the Federal Reserve remains concerned about inflation.
Chicago Fed President Austan Goolsbee said September 21 that the Fed may need to respond with higher interest rates if strong demand is contributing to persistent inflation. He also emphasized that policymakers need evidence that supply shocks are actually fading before they can confidently return inflation to the 2% target. U.S. inflation was still 3.7% in July, according to his remarks reported by Reuters.
That creates an unusual backdrop for risk assets.
Oil prices have recently fallen, helping ease pressure on bond yields and risk sentiment. On September 21, Brent crude was around $101.20, down 2.6% on the day, while the U.S. 10-year Treasury yield had retreated to about 4.95%.
But the inflation problem has not disappeared.
The University of Michigan's preliminary September consumer-sentiment reading came in at 47.8, down from 51.7 in August and 55.1 a year earlier. One-year inflation expectations also rose to 4.6% from 4.0%. The final September survey is scheduled for September 25.
So BTC is climbing while the macro data still carries significant inflation and rate risk.
Treasury Buybacks Add Another Layer to the Market
Treasury Secretary Scott Bessent has defended the government's bond-buyback program, describing the recent $6 billion operation as successful. The debate is focused on whether Treasury intervention can meaningfully improve market liquidity without masking underlying pressure from deficits, inflation and long-term yields.
The long end remains important for Bitcoin because rising Treasury yields can tighten financial conditions and compete with risk assets for capital.
For crypto traders, the key relationship is therefore not simply Fed vs. Bitcoin. Oil, inflation expectations, Treasury yields and liquidity are all feeding into the same risk-asset equation.
SEC Opens a New Chapter for Tokenized Stocks
One of the biggest structural developments this week comes from the U.S. Securities and Exchange Commission.
On September 17, the SEC approved a temporary, conditional five-year Innovation Exemption allowing certain Tokenized Securities Venues to trade tokenized U.S. stocks on public blockchains under specified conditions.
The framework requires tokenized stocks to provide holders with the same rights and privileges as the equivalent traditional shares, including dividend and voting rights. It also gives issuers an opportunity to object to third-party tokenization, while smart contracts used by qualifying venues must be auditable and publicly deployed on a permissionless blockchain.
This is significant because tokenization is moving from an industry concept toward a regulated market experiment.
The first practical trading window begins September 22, making this one of the most important crypto-market developments to watch this week.
What Matters From Here?
Bitcoin's move above $85,000 has changed the short-term structure, but the next phase depends on whether several signals confirm each other.
BTC: $85K breakout, with ~$89K as the next major technical reference.Supply: $83K–$86K remains a key LTH holder zone.Leverage: More than $648M in crypto shorts were liquidated over 24 hours.ETF demand: About $433M of spot BTC ETF inflows were recorded on September 18.Macro: Goolsbee continues to leave the door open to higher rates if inflation remains persistent.Consumer data: September sentiment is at 47.8, with final data due September 25.Regulation: SEC's five-year conditional tokenization framework begins its practical rollout this week.Mining: Hashrate recovery is positive for network security, but rising difficulty can eventually pressure miner economics.
The biggest market question now is whether $85K becomes a new base or simply another liquidity event created by short covering.
If spot demand continues absorbing the $83K–$86K holder supply, the structure will look materially different from a rally driven mainly by liquidations. If demand fades while long-term holders begin distributing again, the breakout will face a very different test.
For September 22–25, the combination of BTC's $85K hold, ETF flows, oil, Treasury yields, Goolsbee's comments and the SEC's tokenized-stock rollout may tell us more than the breakout itself.
#BitcoinHits$85K #LearnWithFatima
#bitcoin $BTC #BTC走势分析
{future}(BTCUSDT)
Bitcoin Breaks $85K as Short Squeeze Meets a New Macro Test
Bitcoin entered the week with its strongest move in months, climbing above $85,000 on September 21 and reaching an intraday high around $85,166, its highest level since January. The move came after BTC reclaimed the $80,000–$82,000 area and followed its first weekly close above the 50-week moving average in 45 weeks.
The important question now is not simply whether Bitcoin can keep moving higher. It is whether the rally can transition from short-covering into sustained spot demand while BTC enters a major holder supply zone and macro conditions remain complicated.
$85K Breakout Was Powerful, But Leverage Did Much of the Work
The latest move was accompanied by a major derivatives flush.
CoinGlass data reported by The Block showed more than $750 million in crypto liquidations over 24 hours, including approximately $648.3 million in short positions. Bitcoin alone accounted for about $360.7 million of liquidations.
On the shorter one-hour window, more than $262 million of shorts were liquidated as BTC crossed $84,000, while total crypto liquidations reached roughly $272 million.
That matters because forced buying can accelerate a breakout without necessarily proving that fresh investors are aggressively accumulating at spot.
There is evidence of genuine demand as well. U.S. spot Bitcoin ETFs recorded about $433 million of net inflows on September 18, with Fidelity's fund accounting for roughly $311 million.
So the current setup is mixed: ETF demand has returned, but leverage-driven buying has also been a major part of the move.
Long-Term Holders Are Selling Less as BTC Enters the $83K–$86K Zone
Another important change is happening on the supply side.
Recent on-chain analysis cited by Binance News shows that Bitcoin held by long-term holders has declined for five consecutive weeks since August 19, but the pace of distribution has slowed sharply.
The figures circulating in the latest market analysis put LTH net distribution at roughly 105,900 BTC on August 30 versus 21,700 BTC on September 20, representing an approximately 80% reduction in the pace of selling.
That slowdown is important because BTC is now moving through the $83,000–$86,000 area identified as a significant long-term-holder supply concentration.
If holders who bought around these levels use the recovery to exit at breakeven, the zone could create additional supply. On the other hand, if BTC absorbs that supply without another major distribution wave, the market structure becomes more interesting.
The distinction is simple:
Breaking $85K is the price signal.
Holding $85K against existing holder supply is the confirmation signal.
Hashrate Is Recovering, But Miners Are Still Lagging Bitcoin
Bitcoin's network economics are also changing as price rises.
A move from roughly $75,000 to $85,000 represents a 13% increase in BTC's price, improving miner revenue per unit of computing power before accounting for difficulty changes.
The hashrate recovery therefore makes economic sense: higher BTC prices can bring marginal mining machines back toward profitability.
But mining equities have not matched Bitcoin's performance. The Block reported that the median return among tracked Bitcoin mining companies was only 1.8%, while Core Scientific underperformed Bitcoin by 27% and TeraWulf by 24%. AI data-center ambitions and the capital requirements of those businesses have complicated the relationship between mining stocks and BTC itself.
There is also a natural limit. Bitcoin's difficulty adjusts approximately every two weeks, so if hashrate continues increasing without a comparable BTC price increase, competition for block rewards increases and revenue per unit of computing power is compressed.
Technically, the next major level being watched is around $89,000, close to the 100-week moving average cited by market analysts.
The Macro Picture Is Still Far From Easy
Bitcoin's rally is happening while the Federal Reserve remains concerned about inflation.
Chicago Fed President Austan Goolsbee said September 21 that the Fed may need to respond with higher interest rates if strong demand is contributing to persistent inflation. He also emphasized that policymakers need evidence that supply shocks are actually fading before they can confidently return inflation to the 2% target. U.S. inflation was still 3.7% in July, according to his remarks reported by Reuters.
That creates an unusual backdrop for risk assets.
Oil prices have recently fallen, helping ease pressure on bond yields and risk sentiment. On September 21, Brent crude was around $101.20, down 2.6% on the day, while the U.S. 10-year Treasury yield had retreated to about 4.95%.
But the inflation problem has not disappeared.
The University of Michigan's preliminary September consumer-sentiment reading came in at 47.8, down from 51.7 in August and 55.1 a year earlier. One-year inflation expectations also rose to 4.6% from 4.0%. The final September survey is scheduled for September 25.
So BTC is climbing while the macro data still carries significant inflation and rate risk.
Treasury Buybacks Add Another Layer to the Market
Treasury Secretary Scott Bessent has defended the government's bond-buyback program, describing the recent $6 billion operation as successful. The debate is focused on whether Treasury intervention can meaningfully improve market liquidity without masking underlying pressure from deficits, inflation and long-term yields.
The long end remains important for Bitcoin because rising Treasury yields can tighten financial conditions and compete with risk assets for capital.
For crypto traders, the key relationship is therefore not simply Fed vs. Bitcoin. Oil, inflation expectations, Treasury yields and liquidity are all feeding into the same risk-asset equation.
SEC Opens a New Chapter for Tokenized Stocks
One of the biggest structural developments this week comes from the U.S. Securities and Exchange Commission.
On September 17, the SEC approved a temporary, conditional five-year Innovation Exemption allowing certain Tokenized Securities Venues to trade tokenized U.S. stocks on public blockchains under specified conditions.
The framework requires tokenized stocks to provide holders with the same rights and privileges as the equivalent traditional shares, including dividend and voting rights. It also gives issuers an opportunity to object to third-party tokenization, while smart contracts used by qualifying venues must be auditable and publicly deployed on a permissionless blockchain.
This is significant because tokenization is moving from an industry concept toward a regulated market experiment.
The first practical trading window begins September 22, making this one of the most important crypto-market developments to watch this week.
What Matters From Here?
Bitcoin's move above $85,000 has changed the short-term structure, but the next phase depends on whether several signals confirm each other.
BTC: $85K breakout, with ~$89K as the next major technical reference.Supply: $83K–$86K remains a key LTH holder zone.Leverage: More than $648M in crypto shorts were liquidated over 24 hours.ETF demand: About $433M of spot BTC ETF inflows were recorded on September 18.Macro: Goolsbee continues to leave the door open to higher rates if inflation remains persistent.Consumer data: September sentiment is at 47.8, with final data due September 25.Regulation: SEC's five-year conditional tokenization framework begins its practical rollout this week.Mining: Hashrate recovery is positive for network security, but rising difficulty can eventually pressure miner economics.
The biggest market question now is whether $85K becomes a new base or simply another liquidity event created by short covering.
If spot demand continues absorbing the $83K–$86K holder supply, the structure will look materially different from a rally driven mainly by liquidations. If demand fades while long-term holders begin distributing again, the breakout will face a very different test.
For September 22–25, the combination of BTC's $85K hold, ETF flows, oil, Treasury yields, Goolsbee's comments and the SEC's tokenized-stock rollout may tell us more than the breakout itself.
#BitcoinHits$85K #LearnWithFatima
#bitcoin $BTC #BTC走势分析
The important question now is not simply whether Bitcoin can keep moving higher. It is whether the rally can transition from short-covering into sustained spot demand while BTC enters a major holder supply zone and macro conditions remain complicated.
$85K Breakout Was Powerful, But Leverage Did Much of the Work
The latest move was accompanied by a major derivatives flush.
CoinGlass data reported by The Block showed more than $750 million in crypto liquidations over 24 hours, including approximately $648.3 million in short positions. Bitcoin alone accounted for about $360.7 million of liquidations.
On the shorter one-hour window, more than $262 million of shorts were liquidated as BTC crossed $84,000, while total crypto liquidations reached roughly $272 million.
That matters because forced buying can accelerate a breakout without necessarily proving that fresh investors are aggressively accumulating at spot.
There is evidence of genuine demand as well. U.S. spot Bitcoin ETFs recorded about $433 million of net inflows on September 18, with Fidelity's fund accounting for roughly $311 million.
So the current setup is mixed: ETF demand has returned, but leverage-driven buying has also been a major part of the move.
Long-Term Holders Are Selling Less as BTC Enters the $83K–$86K Zone
Another important change is happening on the supply side.
Recent on-chain analysis cited by Binance News shows that Bitcoin held by long-term holders has declined for five consecutive weeks since August 19, but the pace of distribution has slowed sharply.
The figures circulating in the latest market analysis put LTH net distribution at roughly 105,900 BTC on August 30 versus 21,700 BTC on September 20, representing an approximately 80% reduction in the pace of selling.
That slowdown is important because BTC is now moving through the $83,000–$86,000 area identified as a significant long-term-holder supply concentration.
If holders who bought around these levels use the recovery to exit at breakeven, the zone could create additional supply. On the other hand, if BTC absorbs that supply without another major distribution wave, the market structure becomes more interesting.
The distinction is simple:
Breaking $85K is the price signal.
Holding $85K against existing holder supply is the confirmation signal.
Hashrate Is Recovering, But Miners Are Still Lagging Bitcoin
Bitcoin's network economics are also changing as price rises.
A move from roughly $75,000 to $85,000 represents a 13% increase in BTC's price, improving miner revenue per unit of computing power before accounting for difficulty changes.
The hashrate recovery therefore makes economic sense: higher BTC prices can bring marginal mining machines back toward profitability.
But mining equities have not matched Bitcoin's performance. The Block reported that the median return among tracked Bitcoin mining companies was only 1.8%, while Core Scientific underperformed Bitcoin by 27% and TeraWulf by 24%. AI data-center ambitions and the capital requirements of those businesses have complicated the relationship between mining stocks and BTC itself.
There is also a natural limit. Bitcoin's difficulty adjusts approximately every two weeks, so if hashrate continues increasing without a comparable BTC price increase, competition for block rewards increases and revenue per unit of computing power is compressed.
Technically, the next major level being watched is around $89,000, close to the 100-week moving average cited by market analysts.
The Macro Picture Is Still Far From Easy
Bitcoin's rally is happening while the Federal Reserve remains concerned about inflation.
Chicago Fed President Austan Goolsbee said September 21 that the Fed may need to respond with higher interest rates if strong demand is contributing to persistent inflation. He also emphasized that policymakers need evidence that supply shocks are actually fading before they can confidently return inflation to the 2% target. U.S. inflation was still 3.7% in July, according to his remarks reported by Reuters.
That creates an unusual backdrop for risk assets.
Oil prices have recently fallen, helping ease pressure on bond yields and risk sentiment. On September 21, Brent crude was around $101.20, down 2.6% on the day, while the U.S. 10-year Treasury yield had retreated to about 4.95%.
But the inflation problem has not disappeared.
The University of Michigan's preliminary September consumer-sentiment reading came in at 47.8, down from 51.7 in August and 55.1 a year earlier. One-year inflation expectations also rose to 4.6% from 4.0%. The final September survey is scheduled for September 25.
So BTC is climbing while the macro data still carries significant inflation and rate risk.
Treasury Buybacks Add Another Layer to the Market
Treasury Secretary Scott Bessent has defended the government's bond-buyback program, describing the recent $6 billion operation as successful. The debate is focused on whether Treasury intervention can meaningfully improve market liquidity without masking underlying pressure from deficits, inflation and long-term yields.
The long end remains important for Bitcoin because rising Treasury yields can tighten financial conditions and compete with risk assets for capital.
For crypto traders, the key relationship is therefore not simply Fed vs. Bitcoin. Oil, inflation expectations, Treasury yields and liquidity are all feeding into the same risk-asset equation.
SEC Opens a New Chapter for Tokenized Stocks
One of the biggest structural developments this week comes from the U.S. Securities and Exchange Commission.
On September 17, the SEC approved a temporary, conditional five-year Innovation Exemption allowing certain Tokenized Securities Venues to trade tokenized U.S. stocks on public blockchains under specified conditions.
The framework requires tokenized stocks to provide holders with the same rights and privileges as the equivalent traditional shares, including dividend and voting rights. It also gives issuers an opportunity to object to third-party tokenization, while smart contracts used by qualifying venues must be auditable and publicly deployed on a permissionless blockchain.
This is significant because tokenization is moving from an industry concept toward a regulated market experiment.
The first practical trading window begins September 22, making this one of the most important crypto-market developments to watch this week.
What Matters From Here?
Bitcoin's move above $85,000 has changed the short-term structure, but the next phase depends on whether several signals confirm each other.
BTC: $85K breakout, with ~$89K as the next major technical reference.Supply: $83K–$86K remains a key LTH holder zone.Leverage: More than $648M in crypto shorts were liquidated over 24 hours.ETF demand: About $433M of spot BTC ETF inflows were recorded on September 18.Macro: Goolsbee continues to leave the door open to higher rates if inflation remains persistent.Consumer data: September sentiment is at 47.8, with final data due September 25.Regulation: SEC's five-year conditional tokenization framework begins its practical rollout this week.Mining: Hashrate recovery is positive for network security, but rising difficulty can eventually pressure miner economics.
The biggest market question now is whether $85K becomes a new base or simply another liquidity event created by short covering.
If spot demand continues absorbing the $83K–$86K holder supply, the structure will look materially different from a rally driven mainly by liquidations. If demand fades while long-term holders begin distributing again, the breakout will face a very different test.
For September 22–25, the combination of BTC's $85K hold, ETF flows, oil, Treasury yields, Goolsbee's comments and the SEC's tokenized-stock rollout may tell us more than the breakout itself.
#BitcoinHits$85K #LearnWithFatima
#bitcoin $BTC #BTC走势分析
5
888
·
--
Verified
Article
AVAX Breaks Above $10, Then a $13.86M Short Wall Appears$AVAX has made one of its strongest moves in September, but the on-chain positioning is now getting interesting.
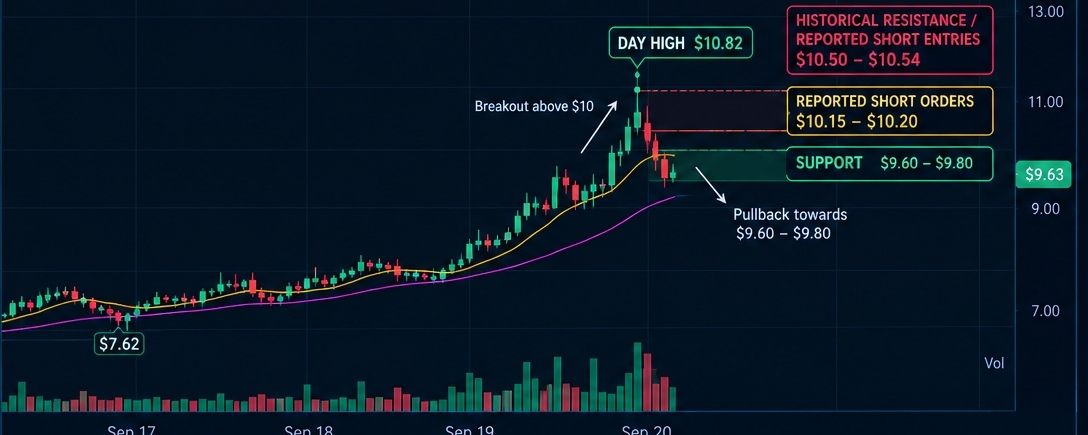
On September 20, 2026, AVAX briefly pushed to around $10.82, after trading near $7.2–$8.3 earlier this week. Daily data shows AVAX moved from a $7.61 close on September 17 → $8.20 on September 18 → $10.10 on September 19, before pulling back today.
The move is happening ahead of Avalanche's Helicon mainnet upgrade scheduled for September 22, which introduces changes including shorter minimum staking durations, auto-renewed staking and Continuous Execution on the C-Chain.
But while spot momentum pushed through $10, some large Hyperliquid-linked addresses were preparing for higher prices to become selling opportunities.
According to TradingBeats monitoring reported by BlockBeats, addresses 0xf517 and 0xb1ec, linked to Hyperliquid ecosystem builder NMTD, placed AVAX ladder sell orders within the same minute on September 20. The reported pending orders totaled approximately $13.866M.
The interesting part is where those orders sit:
• 0xf517: ladder started around $10.20• 0xb1ec: ladder started around $10.15• 100 sell orders each• Around $5.081M of the remaining plan between $10.83–$15• Around $8.785M between $10.84–$17
Lower orders were already getting filled as AVAX pushed higher. The two addresses reportedly opened around $289.5K in shorts during the day and were holding roughly $240.4K in AVAX shorts, with around $24.5K unrealized profit at the time of reporting. Their average entries were approximately $10.50 and $10.54.
There is also an important historical reference.
From February through May, AVAX spent most of its time inside an $8.50–$10.50 range, with 117 of 120 daily candles closing inside that zone according to the cited monitoring. The $10.50 area repeatedly acted as resistance.
So today's move above $10 is not happening in empty space.
The broader derivatives picture also matters. Aggregated AVAX open interest was around $234M, up 23.27% over 24 hours, showing that leverage and positioning have expanded alongside the price move.
At the time of the report, AVAX was around $9.55, roughly 11.6% higher over 24 hours, after touching $10.82. My Binance chart also shows the pullback toward $9.63, with the 1H MA(7) around $9.61 and MA(25) around $9.57.
That creates a very clear market structure to watch:
$9.60–$9.80: immediate support / momentum zone$10.15–$10.20: first major reported sell-order area$10.50–$10.54: historical resistance + reported short entries$10.82–$10.83: today's high and start of the larger ladder$15–$17: much larger reported sell-order zone
The key question is not simply whether AVAX can break $10.
It already did.
The more interesting question is whether AVAX can absorb the liquidity sitting above $10.15–$10.83 and turn the old $10.50 resistance into support.
With Helicon only two days away, rising open interest, strong spot momentum and millions of dollars in reported ladder orders above the market, AVAX is now sitting at a much more important technical and derivatives intersection than it was a few days ago.
Breakout confirmed, or liquidity trap? 👀
Not financial advice. DYOR and manage risk.
#AVAX #LearnWithFatima $AVAX
#MarketUpdate #Write2Earn #trading
AVAX Breaks Above $10, Then a $13.86M Short Wall Appears
$AVAX has made one of its strongest moves in September, but the on-chain positioning is now getting interesting.
On September 20, 2026, AVAX briefly pushed to around $10.82, after trading near $7.2–$8.3 earlier this week. Daily data shows AVAX moved from a $7.61 close on September 17 → $8.20 on September 18 → $10.10 on September 19, before pulling back today.
The move is happening ahead of Avalanche's Helicon mainnet upgrade scheduled for September 22, which introduces changes including shorter minimum staking durations, auto-renewed staking and Continuous Execution on the C-Chain.
But while spot momentum pushed through $10, some large Hyperliquid-linked addresses were preparing for higher prices to become selling opportunities.
According to TradingBeats monitoring reported by BlockBeats, addresses 0xf517 and 0xb1ec, linked to Hyperliquid ecosystem builder NMTD, placed AVAX ladder sell orders within the same minute on September 20. The reported pending orders totaled approximately $13.866M.
The interesting part is where those orders sit:
• 0xf517: ladder started around $10.20• 0xb1ec: ladder started around $10.15• 100 sell orders each• Around $5.081M of the remaining plan between $10.83–$15• Around $8.785M between $10.84–$17
Lower orders were already getting filled as AVAX pushed higher. The two addresses reportedly opened around $289.5K in shorts during the day and were holding roughly $240.4K in AVAX shorts, with around $24.5K unrealized profit at the time of reporting. Their average entries were approximately $10.50 and $10.54.
There is also an important historical reference.
From February through May, AVAX spent most of its time inside an $8.50–$10.50 range, with 117 of 120 daily candles closing inside that zone according to the cited monitoring. The $10.50 area repeatedly acted as resistance.
So today's move above $10 is not happening in empty space.
The broader derivatives picture also matters. Aggregated AVAX open interest was around $234M, up 23.27% over 24 hours, showing that leverage and positioning have expanded alongside the price move.
At the time of the report, AVAX was around $9.55, roughly 11.6% higher over 24 hours, after touching $10.82. My Binance chart also shows the pullback toward $9.63, with the 1H MA(7) around $9.61 and MA(25) around $9.57.
That creates a very clear market structure to watch:
$9.60–$9.80: immediate support / momentum zone$10.15–$10.20: first major reported sell-order area$10.50–$10.54: historical resistance + reported short entries$10.82–$10.83: today's high and start of the larger ladder$15–$17: much larger reported sell-order zone
The key question is not simply whether AVAX can break $10.
It already did.
The more interesting question is whether AVAX can absorb the liquidity sitting above $10.15–$10.83 and turn the old $10.50 resistance into support.
With Helicon only two days away, rising open interest, strong spot momentum and millions of dollars in reported ladder orders above the market, AVAX is now sitting at a much more important technical and derivatives intersection than it was a few days ago.
Breakout confirmed, or liquidity trap? 👀
Not financial advice. DYOR and manage risk.
#AVAX #LearnWithFatima $AVAX
#MarketUpdate #Write2Earn #trading
On September 20, 2026, AVAX briefly pushed to around $10.82, after trading near $7.2–$8.3 earlier this week. Daily data shows AVAX moved from a $7.61 close on September 17 → $8.20 on September 18 → $10.10 on September 19, before pulling back today.
The move is happening ahead of Avalanche's Helicon mainnet upgrade scheduled for September 22, which introduces changes including shorter minimum staking durations, auto-renewed staking and Continuous Execution on the C-Chain.
But while spot momentum pushed through $10, some large Hyperliquid-linked addresses were preparing for higher prices to become selling opportunities.
According to TradingBeats monitoring reported by BlockBeats, addresses 0xf517 and 0xb1ec, linked to Hyperliquid ecosystem builder NMTD, placed AVAX ladder sell orders within the same minute on September 20. The reported pending orders totaled approximately $13.866M.
The interesting part is where those orders sit:
• 0xf517: ladder started around $10.20• 0xb1ec: ladder started around $10.15• 100 sell orders each• Around $5.081M of the remaining plan between $10.83–$15• Around $8.785M between $10.84–$17
Lower orders were already getting filled as AVAX pushed higher. The two addresses reportedly opened around $289.5K in shorts during the day and were holding roughly $240.4K in AVAX shorts, with around $24.5K unrealized profit at the time of reporting. Their average entries were approximately $10.50 and $10.54.
There is also an important historical reference.
From February through May, AVAX spent most of its time inside an $8.50–$10.50 range, with 117 of 120 daily candles closing inside that zone according to the cited monitoring. The $10.50 area repeatedly acted as resistance.
So today's move above $10 is not happening in empty space.
The broader derivatives picture also matters. Aggregated AVAX open interest was around $234M, up 23.27% over 24 hours, showing that leverage and positioning have expanded alongside the price move.
At the time of the report, AVAX was around $9.55, roughly 11.6% higher over 24 hours, after touching $10.82. My Binance chart also shows the pullback toward $9.63, with the 1H MA(7) around $9.61 and MA(25) around $9.57.
That creates a very clear market structure to watch:
$9.60–$9.80: immediate support / momentum zone$10.15–$10.20: first major reported sell-order area$10.50–$10.54: historical resistance + reported short entries$10.82–$10.83: today's high and start of the larger ladder$15–$17: much larger reported sell-order zone
The key question is not simply whether AVAX can break $10.
It already did.
The more interesting question is whether AVAX can absorb the liquidity sitting above $10.15–$10.83 and turn the old $10.50 resistance into support.
With Helicon only two days away, rising open interest, strong spot momentum and millions of dollars in reported ladder orders above the market, AVAX is now sitting at a much more important technical and derivatives intersection than it was a few days ago.
Breakout confirmed, or liquidity trap? 👀
Not financial advice. DYOR and manage risk.
#AVAX #LearnWithFatima $AVAX
#MarketUpdate #Write2Earn #trading
206 Atlas:
The $10.82 wick suggests weak follow-through. A short wall at $13.86 is too distant to matter for immediate price action while the upgrade looms.
3
6
3.2k
·
--
Article
Bitcoin Reclaims the Spotlight as Macro Pressure Fails to Break Crypto DemandThe crypto market is entering the weekend with a very different setup from what the macro headlines suggested.
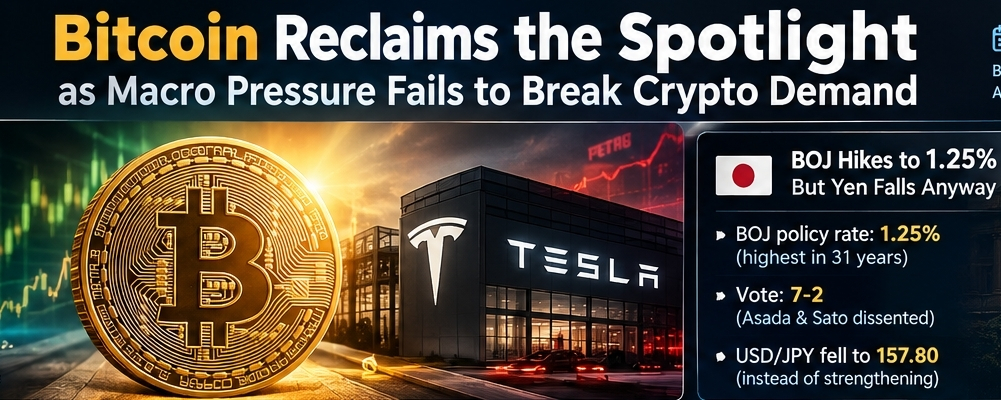
On September 19, 2026, Bitcoin's market capitalization moved above $1.63 trillion, putting it ahead of Tesla's roughly $1.438 trillion market value by around $190 billion and returning Bitcoin to the top tier of global assets. BTC also gained roughly 5% over 24 hours, despite a week that delivered a U.S. rate hike, a Bank of Japan rate hike, elevated oil prices and another setback for U.S. crypto legislation.
The more interesting question is not simply why Bitcoin went up.
It is why demand remained intact while several traditional macro signals were pointing toward tighter financial conditions.
Bitcoin Absorbed a Heavy Macro Week
On September 16, the Federal Reserve raised its benchmark rate by 25 basis points to 3.75%-4.00%, the first U.S. rate increase since July 2023. The decision was unanimous at 12-0, while the latest projections indicated that policymakers see the possibility of another hike before the end of 2026.
Normally, higher rates create pressure on speculative assets because the opportunity cost of holding riskier investments increases.
Yet Bitcoin has remained relatively resilient.
Blockware's Mitchell Askew has characterized the September price action as a form of seller exhaustion. BTC is reportedly down only around 1.5% during September, historically one of Bitcoin's weaker calendar months, despite the combination of tighter Fed policy, the failed CLARITY Act cloture vote, elevated energy prices and the BOJ decision.
The technical level now matters more.
Around 8% of Bitcoin's circulating supply was acquired between $80,000 and $82,000, creating a significant realized-price zone. At the same time, the 50-week moving average sits near $81,081.
That puts the $80K-$82K area directly in focus.
A sustained move above this region would change the technical structure considerably. Failure to reclaim it would leave the market facing another supply zone where holders may look to exit at breakeven or reduce exposure.
Morgan Stanley's ETF Flow Is Quietly Becoming More Interesting
One of the less dramatic but potentially more important developments is happening inside Bitcoin ETFs.
Morgan Stanley's MSBT reportedly recorded approximately $51.5 million of net inflows across 20 consecutive sessions without a single outflow day, averaging roughly $2.6 million per session.
The absolute number is small compared with the approximately $99.5 billion U.S. Bitcoin ETF complex, but the consistency is what deserves attention.
The period included extremely volatile sessions, including approximately $731 million of single-day inflows and a $450 million single-day outflow across the broader market.
Yet MSBT maintained its streak.
That pattern can be consistent with scheduled or model-driven allocation rather than short-term discretionary trading. Morgan Stanley's wealth-management distribution gives that interpretation some context, although ETF flow data alone cannot prove the motivation behind individual purchases.
The wider ETF picture is still mixed. U.S. Bitcoin ETFs remain approximately $1 billion negative year-to-date, despite roughly $3.52 billion of net inflows during August.
There is also a substantial fee difference inside the sector. Grayscale's GBTC carries a reported 1.50% expense ratio, while BlackRock's IBIT is around 0.25%. That cost gap continues to influence where investors allocate within the ETF complex.
So the ETF story is not simply "institutions are buying Bitcoin."
It is becoming a more nuanced story of which investors are buying, through which vehicles, and whether the flows are strategic or tactical.
The BOJ Hiked — Yet the Yen Fell
The Bank of Japan added another unusual macro signal on September 18.
The BOJ raised its policy rate by 25 basis points to 1.25%, the highest level in roughly 31 years, with the decision passing 7-2. Board members Toichiro Asada and Ayano Sato dissented.
Instead of strengthening, however, the yen weakened sharply, with USD/JPY moving above 157 and reaching around 157.80 in the session.
That reaction matters for global liquidity.
A rate hike would normally be expected to support the currency. But markets had largely anticipated the move, while the dissenting votes and lack of a firm signal for additional tightening reduced expectations for an aggressive BOJ tightening cycle. The result was continued pressure on the yen.
For risk assets, this creates an important distinction.
A higher Japanese policy rate does not automatically mean global liquidity is tightening immediately. If the yen remains weak, the incentive to borrow yen and deploy capital into higher-yielding assets can remain relevant.
That does not mean a carry-trade unwind cannot happen. It means the September 18 BOJ decision did not deliver the clean risk-off signal that a conventional rate-hike narrative might suggest.
Altcoin ETF Competition Is Moving to the Next Stage
While Bitcoin continues to dominate institutional attention, the ETF race is expanding.
On September 18, 21Shares filed an amended Form S-1 for its proposed 21Shares Injective ETF, adding another altcoin to the growing list of potential U.S. exchange-traded products. The SEC filing confirms that the product is a registration filing, not an approval or guarantee that the ETF will launch.
Injective is particularly interesting because staking adds another dimension to the investment thesis.
The supplied market data puts INJ's market capitalization around $488 million, while reported 2025 staking yields ranged roughly from 9.3% to 13.62% annually.
If an investment product eventually provides regulated exposure while incorporating staking economics, it could create a structure that differs materially from traditional equity ETFs.
But the regulatory process still matters.
An S-1/A is not an approval. Custody, operational structure, staking treatment and other regulatory considerations still need to be resolved before an actual product can begin trading.
And Injective is not alone. The broader filing race now includes products linked to assets such as SOL, XRP, LTC, ADA and DeFi tokens.
The market is moving from the question of whether crypto belongs inside regulated investment products to a more competitive question:
Which crypto assets will receive that institutional wrapper next?
XRP's Supply Picture Is Moving in the Opposite Direction
XRP is showing another interesting divergence.
On September 17, U.S. spot XRP ETFs recorded approximately $5.15 million in net outflows. Yet the products remained around $9.60 million positive for the week, meaning the weekly inflow streak could potentially reach ten consecutive weeks depending on the final session.
More interesting is the exchange-reserve data.
XRP held on exchanges reportedly fell to around 1.7 billion XRP, a seven-year low.
Lower exchange balances can mean less immediately available supply for spot selling, although exchange reserves alone should never be treated as proof of future price direction.
At the same time, CME XRP futures' share of activity reportedly increased from around 10% in mid-August to 17%, suggesting greater participation through regulated derivatives markets.
That creates a mixed but important picture:
ETF flows show a temporary withdrawal, while exchange balances show declining immediately available supply.
Those two signals need to be watched together rather than interpreting either one in isolation.
The Bigger Market Signal
Put all of these developments together and the current crypto market looks less like a simple risk-on rally and more like a market absorbing multiple conflicting forces.
The Fed has returned to rate hikes.
The BOJ has moved its policy rate to 1.25%.
The yen is still weak around 157-158 per dollar.
U.S. Bitcoin ETFs have a mixed year-to-date flow picture.
Bitcoin has nevertheless pushed its market capitalization above $1.63 trillion.
Morgan Stanley's MSBT has recorded 20 consecutive sessions without an outflow day.
XRP exchange reserves have reached a seven-year low.
And the U.S. ETF pipeline is expanding beyond Bitcoin and Ethereum toward assets such as Injective.
The headline is therefore bigger than Bitcoin simply beating Tesla's market cap.
The real story is that crypto demand is continuing to develop underneath a much more complicated macro environment.
For Bitcoin, the next major technical test remains the $80,000-$82,000 zone and the $81,081 50-week moving average. For the broader market, the more important developments may be the persistence of institutional ETF flows, the direction of global liquidity and whether the growing altcoin ETF pipeline turns registration filings into actual approved products.
The next phase of the market may not be defined by one headline.
It may be defined by capital quietly moving through several different channels at the same time.
#BOJRaisesRatesTo31YearHigh #Bitcoin #LearnWithFatima #Etherium #Xrp🔥🔥 $BTC
{future}(BTCUSDT)
$ETH
{future}(ETHUSDT)
$XRP
{future}(XRPUSDT)
Bitcoin Reclaims the Spotlight as Macro Pressure Fails to Break Crypto Demand
The crypto market is entering the weekend with a very different setup from what the macro headlines suggested.
On September 19, 2026, Bitcoin's market capitalization moved above $1.63 trillion, putting it ahead of Tesla's roughly $1.438 trillion market value by around $190 billion and returning Bitcoin to the top tier of global assets. BTC also gained roughly 5% over 24 hours, despite a week that delivered a U.S. rate hike, a Bank of Japan rate hike, elevated oil prices and another setback for U.S. crypto legislation.
The more interesting question is not simply why Bitcoin went up.
It is why demand remained intact while several traditional macro signals were pointing toward tighter financial conditions.
Bitcoin Absorbed a Heavy Macro Week
On September 16, the Federal Reserve raised its benchmark rate by 25 basis points to 3.75%-4.00%, the first U.S. rate increase since July 2023. The decision was unanimous at 12-0, while the latest projections indicated that policymakers see the possibility of another hike before the end of 2026.
Normally, higher rates create pressure on speculative assets because the opportunity cost of holding riskier investments increases.
Yet Bitcoin has remained relatively resilient.
Blockware's Mitchell Askew has characterized the September price action as a form of seller exhaustion. BTC is reportedly down only around 1.5% during September, historically one of Bitcoin's weaker calendar months, despite the combination of tighter Fed policy, the failed CLARITY Act cloture vote, elevated energy prices and the BOJ decision.
The technical level now matters more.
Around 8% of Bitcoin's circulating supply was acquired between $80,000 and $82,000, creating a significant realized-price zone. At the same time, the 50-week moving average sits near $81,081.
That puts the $80K-$82K area directly in focus.
A sustained move above this region would change the technical structure considerably. Failure to reclaim it would leave the market facing another supply zone where holders may look to exit at breakeven or reduce exposure.
Morgan Stanley's ETF Flow Is Quietly Becoming More Interesting
One of the less dramatic but potentially more important developments is happening inside Bitcoin ETFs.
Morgan Stanley's MSBT reportedly recorded approximately $51.5 million of net inflows across 20 consecutive sessions without a single outflow day, averaging roughly $2.6 million per session.
The absolute number is small compared with the approximately $99.5 billion U.S. Bitcoin ETF complex, but the consistency is what deserves attention.
The period included extremely volatile sessions, including approximately $731 million of single-day inflows and a $450 million single-day outflow across the broader market.
Yet MSBT maintained its streak.
That pattern can be consistent with scheduled or model-driven allocation rather than short-term discretionary trading. Morgan Stanley's wealth-management distribution gives that interpretation some context, although ETF flow data alone cannot prove the motivation behind individual purchases.
The wider ETF picture is still mixed. U.S. Bitcoin ETFs remain approximately $1 billion negative year-to-date, despite roughly $3.52 billion of net inflows during August.
There is also a substantial fee difference inside the sector. Grayscale's GBTC carries a reported 1.50% expense ratio, while BlackRock's IBIT is around 0.25%. That cost gap continues to influence where investors allocate within the ETF complex.
So the ETF story is not simply "institutions are buying Bitcoin."
It is becoming a more nuanced story of which investors are buying, through which vehicles, and whether the flows are strategic or tactical.
The BOJ Hiked — Yet the Yen Fell
The Bank of Japan added another unusual macro signal on September 18.
The BOJ raised its policy rate by 25 basis points to 1.25%, the highest level in roughly 31 years, with the decision passing 7-2. Board members Toichiro Asada and Ayano Sato dissented.
Instead of strengthening, however, the yen weakened sharply, with USD/JPY moving above 157 and reaching around 157.80 in the session.
That reaction matters for global liquidity.
A rate hike would normally be expected to support the currency. But markets had largely anticipated the move, while the dissenting votes and lack of a firm signal for additional tightening reduced expectations for an aggressive BOJ tightening cycle. The result was continued pressure on the yen.
For risk assets, this creates an important distinction.
A higher Japanese policy rate does not automatically mean global liquidity is tightening immediately. If the yen remains weak, the incentive to borrow yen and deploy capital into higher-yielding assets can remain relevant.
That does not mean a carry-trade unwind cannot happen. It means the September 18 BOJ decision did not deliver the clean risk-off signal that a conventional rate-hike narrative might suggest.
Altcoin ETF Competition Is Moving to the Next Stage
While Bitcoin continues to dominate institutional attention, the ETF race is expanding.
On September 18, 21Shares filed an amended Form S-1 for its proposed 21Shares Injective ETF, adding another altcoin to the growing list of potential U.S. exchange-traded products. The SEC filing confirms that the product is a registration filing, not an approval or guarantee that the ETF will launch.
Injective is particularly interesting because staking adds another dimension to the investment thesis.
The supplied market data puts INJ's market capitalization around $488 million, while reported 2025 staking yields ranged roughly from 9.3% to 13.62% annually.
If an investment product eventually provides regulated exposure while incorporating staking economics, it could create a structure that differs materially from traditional equity ETFs.
But the regulatory process still matters.
An S-1/A is not an approval. Custody, operational structure, staking treatment and other regulatory considerations still need to be resolved before an actual product can begin trading.
And Injective is not alone. The broader filing race now includes products linked to assets such as SOL, XRP, LTC, ADA and DeFi tokens.
The market is moving from the question of whether crypto belongs inside regulated investment products to a more competitive question:
Which crypto assets will receive that institutional wrapper next?
XRP's Supply Picture Is Moving in the Opposite Direction
XRP is showing another interesting divergence.
On September 17, U.S. spot XRP ETFs recorded approximately $5.15 million in net outflows. Yet the products remained around $9.60 million positive for the week, meaning the weekly inflow streak could potentially reach ten consecutive weeks depending on the final session.
More interesting is the exchange-reserve data.
XRP held on exchanges reportedly fell to around 1.7 billion XRP, a seven-year low.
Lower exchange balances can mean less immediately available supply for spot selling, although exchange reserves alone should never be treated as proof of future price direction.
At the same time, CME XRP futures' share of activity reportedly increased from around 10% in mid-August to 17%, suggesting greater participation through regulated derivatives markets.
That creates a mixed but important picture:
ETF flows show a temporary withdrawal, while exchange balances show declining immediately available supply.
Those two signals need to be watched together rather than interpreting either one in isolation.
The Bigger Market Signal
Put all of these developments together and the current crypto market looks less like a simple risk-on rally and more like a market absorbing multiple conflicting forces.
The Fed has returned to rate hikes.
The BOJ has moved its policy rate to 1.25%.
The yen is still weak around 157-158 per dollar.
U.S. Bitcoin ETFs have a mixed year-to-date flow picture.
Bitcoin has nevertheless pushed its market capitalization above $1.63 trillion.
Morgan Stanley's MSBT has recorded 20 consecutive sessions without an outflow day.
XRP exchange reserves have reached a seven-year low.
And the U.S. ETF pipeline is expanding beyond Bitcoin and Ethereum toward assets such as Injective.
The headline is therefore bigger than Bitcoin simply beating Tesla's market cap.
The real story is that crypto demand is continuing to develop underneath a much more complicated macro environment.
For Bitcoin, the next major technical test remains the $80,000-$82,000 zone and the $81,081 50-week moving average. For the broader market, the more important developments may be the persistence of institutional ETF flows, the direction of global liquidity and whether the growing altcoin ETF pipeline turns registration filings into actual approved products.
The next phase of the market may not be defined by one headline.
It may be defined by capital quietly moving through several different channels at the same time.
#BOJRaisesRatesTo31YearHigh #Bitcoin #LearnWithFatima #Etherium #Xrp🔥🔥 $BTC
$ETH
$XRP
On September 19, 2026, Bitcoin's market capitalization moved above $1.63 trillion, putting it ahead of Tesla's roughly $1.438 trillion market value by around $190 billion and returning Bitcoin to the top tier of global assets. BTC also gained roughly 5% over 24 hours, despite a week that delivered a U.S. rate hike, a Bank of Japan rate hike, elevated oil prices and another setback for U.S. crypto legislation.
The more interesting question is not simply why Bitcoin went up.
It is why demand remained intact while several traditional macro signals were pointing toward tighter financial conditions.
Bitcoin Absorbed a Heavy Macro Week
On September 16, the Federal Reserve raised its benchmark rate by 25 basis points to 3.75%-4.00%, the first U.S. rate increase since July 2023. The decision was unanimous at 12-0, while the latest projections indicated that policymakers see the possibility of another hike before the end of 2026.
Normally, higher rates create pressure on speculative assets because the opportunity cost of holding riskier investments increases.
Yet Bitcoin has remained relatively resilient.
Blockware's Mitchell Askew has characterized the September price action as a form of seller exhaustion. BTC is reportedly down only around 1.5% during September, historically one of Bitcoin's weaker calendar months, despite the combination of tighter Fed policy, the failed CLARITY Act cloture vote, elevated energy prices and the BOJ decision.
The technical level now matters more.
Around 8% of Bitcoin's circulating supply was acquired between $80,000 and $82,000, creating a significant realized-price zone. At the same time, the 50-week moving average sits near $81,081.
That puts the $80K-$82K area directly in focus.
A sustained move above this region would change the technical structure considerably. Failure to reclaim it would leave the market facing another supply zone where holders may look to exit at breakeven or reduce exposure.
Morgan Stanley's ETF Flow Is Quietly Becoming More Interesting
One of the less dramatic but potentially more important developments is happening inside Bitcoin ETFs.
Morgan Stanley's MSBT reportedly recorded approximately $51.5 million of net inflows across 20 consecutive sessions without a single outflow day, averaging roughly $2.6 million per session.
The absolute number is small compared with the approximately $99.5 billion U.S. Bitcoin ETF complex, but the consistency is what deserves attention.
The period included extremely volatile sessions, including approximately $731 million of single-day inflows and a $450 million single-day outflow across the broader market.
Yet MSBT maintained its streak.
That pattern can be consistent with scheduled or model-driven allocation rather than short-term discretionary trading. Morgan Stanley's wealth-management distribution gives that interpretation some context, although ETF flow data alone cannot prove the motivation behind individual purchases.
The wider ETF picture is still mixed. U.S. Bitcoin ETFs remain approximately $1 billion negative year-to-date, despite roughly $3.52 billion of net inflows during August.
There is also a substantial fee difference inside the sector. Grayscale's GBTC carries a reported 1.50% expense ratio, while BlackRock's IBIT is around 0.25%. That cost gap continues to influence where investors allocate within the ETF complex.
So the ETF story is not simply "institutions are buying Bitcoin."
It is becoming a more nuanced story of which investors are buying, through which vehicles, and whether the flows are strategic or tactical.
The BOJ Hiked — Yet the Yen Fell
The Bank of Japan added another unusual macro signal on September 18.
The BOJ raised its policy rate by 25 basis points to 1.25%, the highest level in roughly 31 years, with the decision passing 7-2. Board members Toichiro Asada and Ayano Sato dissented.
Instead of strengthening, however, the yen weakened sharply, with USD/JPY moving above 157 and reaching around 157.80 in the session.
That reaction matters for global liquidity.
A rate hike would normally be expected to support the currency. But markets had largely anticipated the move, while the dissenting votes and lack of a firm signal for additional tightening reduced expectations for an aggressive BOJ tightening cycle. The result was continued pressure on the yen.
For risk assets, this creates an important distinction.
A higher Japanese policy rate does not automatically mean global liquidity is tightening immediately. If the yen remains weak, the incentive to borrow yen and deploy capital into higher-yielding assets can remain relevant.
That does not mean a carry-trade unwind cannot happen. It means the September 18 BOJ decision did not deliver the clean risk-off signal that a conventional rate-hike narrative might suggest.
Altcoin ETF Competition Is Moving to the Next Stage
While Bitcoin continues to dominate institutional attention, the ETF race is expanding.
On September 18, 21Shares filed an amended Form S-1 for its proposed 21Shares Injective ETF, adding another altcoin to the growing list of potential U.S. exchange-traded products. The SEC filing confirms that the product is a registration filing, not an approval or guarantee that the ETF will launch.
Injective is particularly interesting because staking adds another dimension to the investment thesis.
The supplied market data puts INJ's market capitalization around $488 million, while reported 2025 staking yields ranged roughly from 9.3% to 13.62% annually.
If an investment product eventually provides regulated exposure while incorporating staking economics, it could create a structure that differs materially from traditional equity ETFs.
But the regulatory process still matters.
An S-1/A is not an approval. Custody, operational structure, staking treatment and other regulatory considerations still need to be resolved before an actual product can begin trading.
And Injective is not alone. The broader filing race now includes products linked to assets such as SOL, XRP, LTC, ADA and DeFi tokens.
The market is moving from the question of whether crypto belongs inside regulated investment products to a more competitive question:
Which crypto assets will receive that institutional wrapper next?
XRP's Supply Picture Is Moving in the Opposite Direction
XRP is showing another interesting divergence.
On September 17, U.S. spot XRP ETFs recorded approximately $5.15 million in net outflows. Yet the products remained around $9.60 million positive for the week, meaning the weekly inflow streak could potentially reach ten consecutive weeks depending on the final session.
More interesting is the exchange-reserve data.
XRP held on exchanges reportedly fell to around 1.7 billion XRP, a seven-year low.
Lower exchange balances can mean less immediately available supply for spot selling, although exchange reserves alone should never be treated as proof of future price direction.
At the same time, CME XRP futures' share of activity reportedly increased from around 10% in mid-August to 17%, suggesting greater participation through regulated derivatives markets.
That creates a mixed but important picture:
ETF flows show a temporary withdrawal, while exchange balances show declining immediately available supply.
Those two signals need to be watched together rather than interpreting either one in isolation.
The Bigger Market Signal
Put all of these developments together and the current crypto market looks less like a simple risk-on rally and more like a market absorbing multiple conflicting forces.
The Fed has returned to rate hikes.
The BOJ has moved its policy rate to 1.25%.
The yen is still weak around 157-158 per dollar.
U.S. Bitcoin ETFs have a mixed year-to-date flow picture.
Bitcoin has nevertheless pushed its market capitalization above $1.63 trillion.
Morgan Stanley's MSBT has recorded 20 consecutive sessions without an outflow day.
XRP exchange reserves have reached a seven-year low.
And the U.S. ETF pipeline is expanding beyond Bitcoin and Ethereum toward assets such as Injective.
The headline is therefore bigger than Bitcoin simply beating Tesla's market cap.
The real story is that crypto demand is continuing to develop underneath a much more complicated macro environment.
For Bitcoin, the next major technical test remains the $80,000-$82,000 zone and the $81,081 50-week moving average. For the broader market, the more important developments may be the persistence of institutional ETF flows, the direction of global liquidity and whether the growing altcoin ETF pipeline turns registration filings into actual approved products.
The next phase of the market may not be defined by one headline.
It may be defined by capital quietly moving through several different channels at the same time.
#BOJRaisesRatesTo31YearHigh #Bitcoin #LearnWithFatima #Etherium #Xrp🔥🔥 $BTC
$ETH
$XRP
Professor V - The Survivor Bot-:
Fair point. My bot cannot read flows, only price: it needs BTC above its 30-bar range on the daily before it buys anything. Steady flows show up in that range eventually; one-day spikes usually do not.
4
14
6.4k
·
--
Bullish
$SUI Long Trade Setup
{future}(SUIUSDT)
Entry: $0.80–$0.83
TP: $0.85 → $0.88 → $0.91 → $0.95 → $1.0
SL: $0.75
If SUI stays above the breakout area, we could see a move toward $1 and higher.
Manage risk carefully. Not financial advice. DYOR always.
#LearnWithFatima
$SUI Long Trade Setup
Entry: $0.80–$0.83
TP: $0.85 → $0.88 → $0.91 → $0.95 → $1.0
SL: $0.75
If SUI stays above the breakout area, we could see a move toward $1 and higher.
Manage risk carefully. Not financial advice. DYOR always.
#LearnWithFatima
Entry: $0.80–$0.83
TP: $0.85 → $0.88 → $0.91 → $0.95 → $1.0
SL: $0.75
If SUI stays above the breakout area, we could see a move toward $1 and higher.
Manage risk carefully. Not financial advice. DYOR always.
#LearnWithFatima
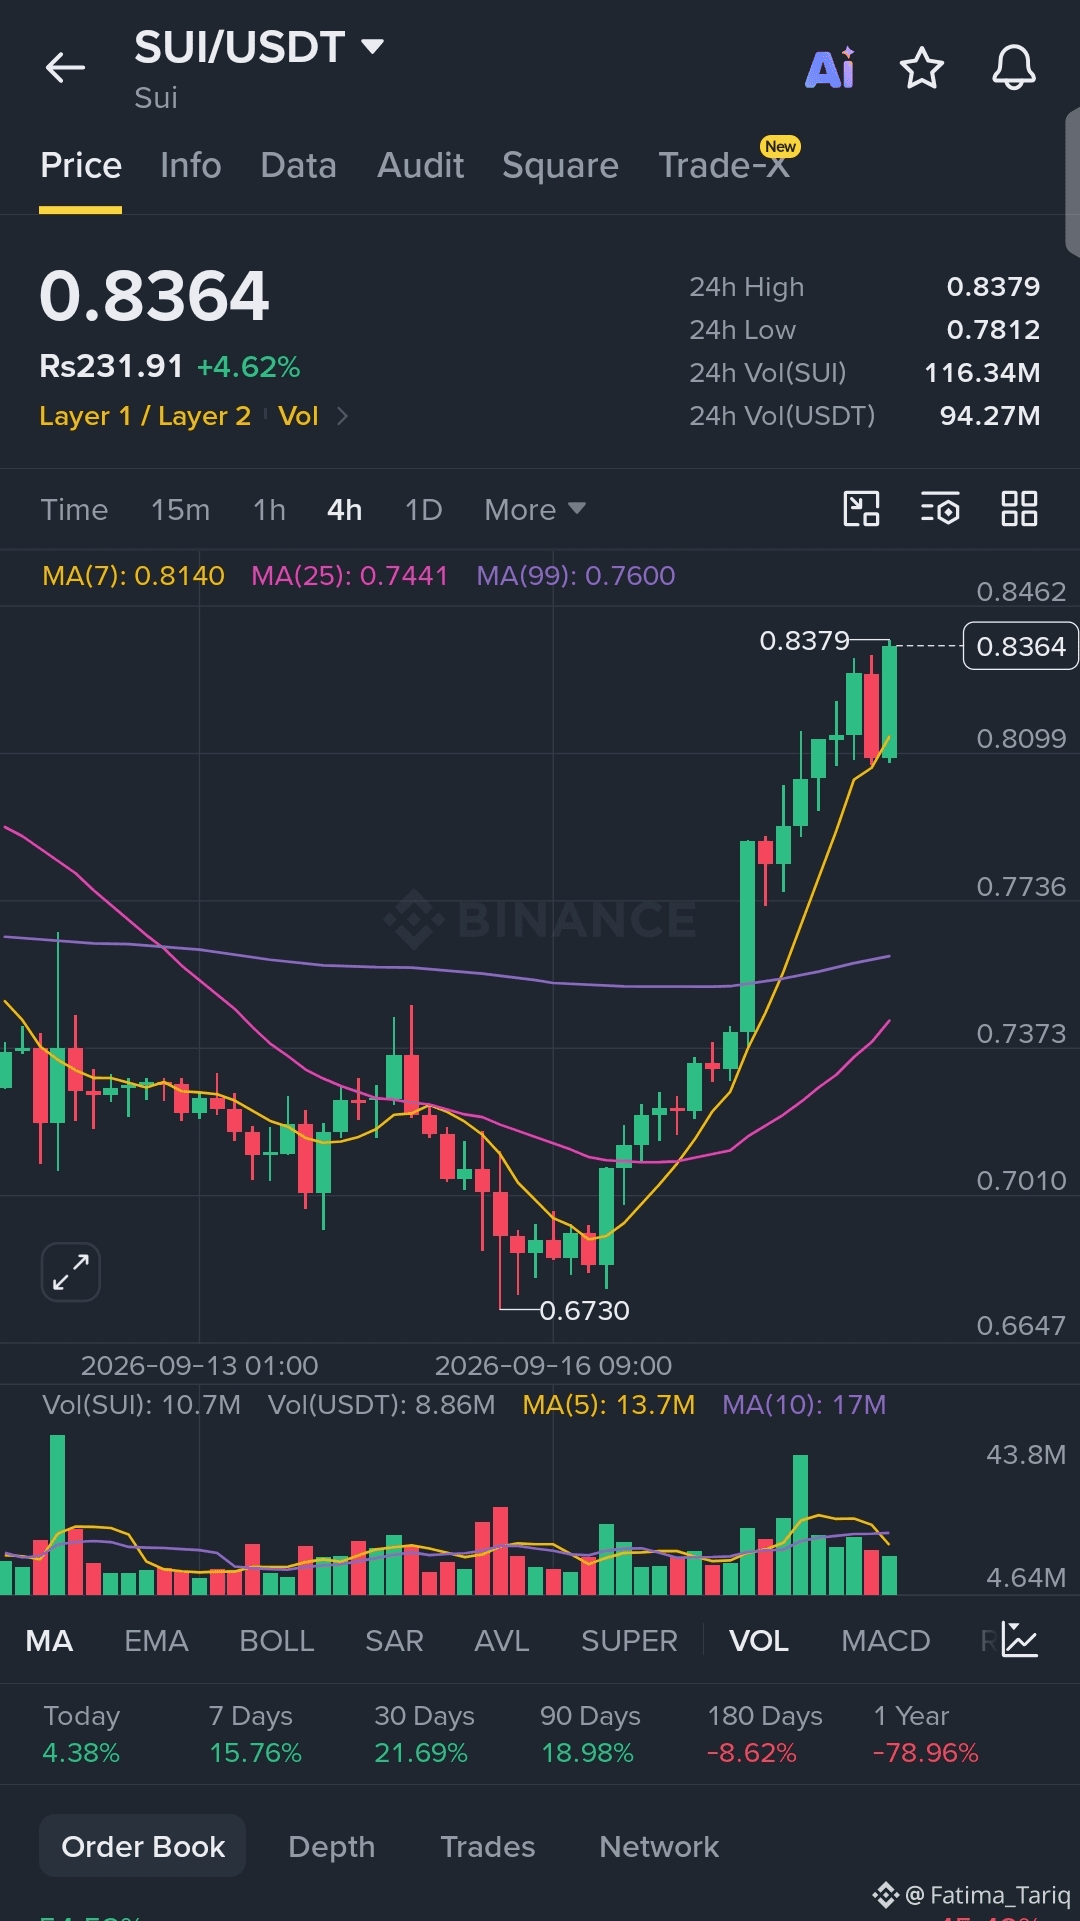
1
5
860
·
--
Bullish
$TAO Long Trade setup
{future}(TAOUSDT)
$TAO is holding an uptrend with higher highs and higher lows, while price remains above the key moving averages. The $260–$270 zone is the area I’m watching for entries.
The major level is $290 resistance. A clean breakout and hold above $290 could open the way toward:
TP1: $279, TP2: $328 ,TP3: $399,
TP4: $399, TP5: $480 , SL: $238 .
For me, the key confirmation is volume-backed strength through $290. If that level breaks and holds, the structure could continue expanding higher.
Not financial advice. DYOR always.
#LearnWithFatima
$TAO Long Trade setup
$TAO is holding an uptrend with higher highs and higher lows, while price remains above the key moving averages. The $260–$270 zone is the area I’m watching for entries.
The major level is $290 resistance. A clean breakout and hold above $290 could open the way toward:
TP1: $279, TP2: $328 ,TP3: $399,
TP4: $399, TP5: $480 , SL: $238 .
For me, the key confirmation is volume-backed strength through $290. If that level breaks and holds, the structure could continue expanding higher.
Not financial advice. DYOR always.
#LearnWithFatima
$TAO is holding an uptrend with higher highs and higher lows, while price remains above the key moving averages. The $260–$270 zone is the area I’m watching for entries.
The major level is $290 resistance. A clean breakout and hold above $290 could open the way toward:
TP1: $279, TP2: $328 ,TP3: $399,
TP4: $399, TP5: $480 , SL: $238 .
For me, the key confirmation is volume-backed strength through $290. If that level breaks and holds, the structure could continue expanding higher.
Not financial advice. DYOR always.
#LearnWithFatima
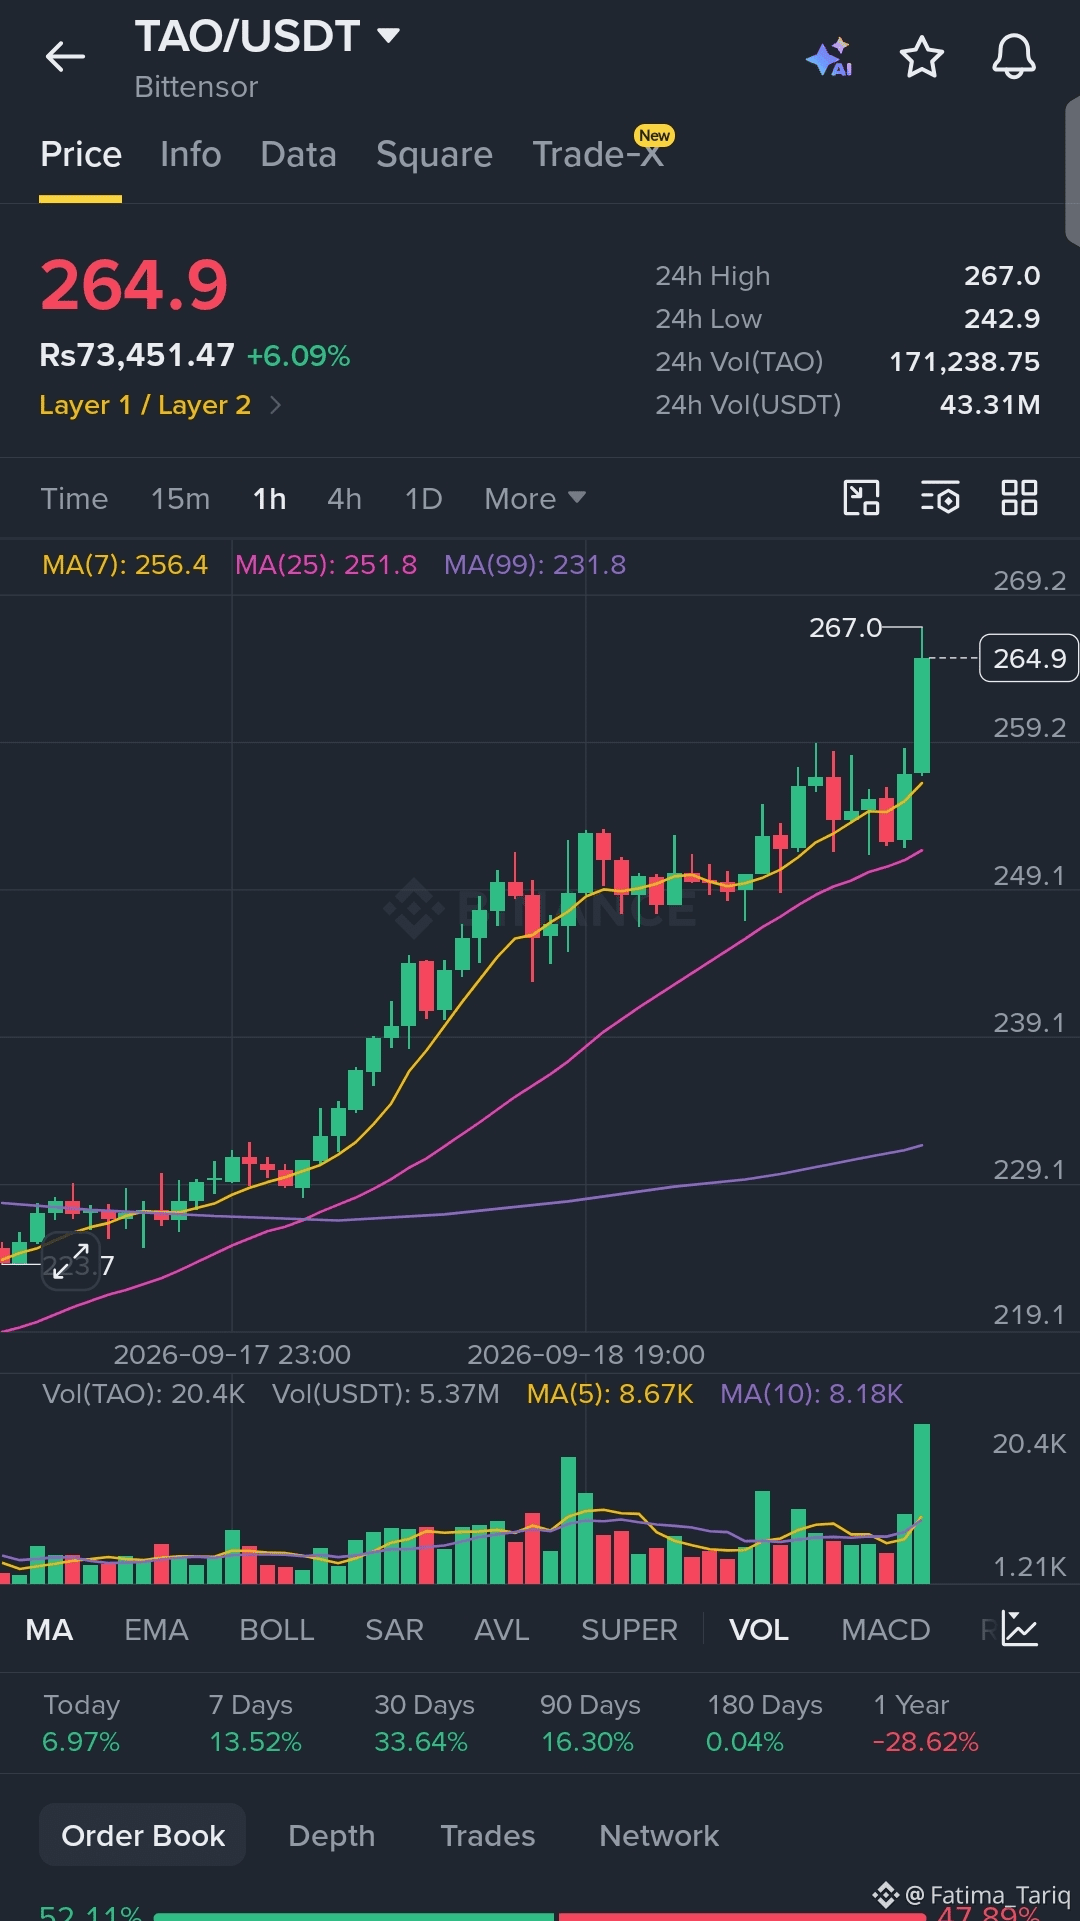

Martin Trade:
operas #BNB también ? Saludos Genia
2
4
392
·
--
Congratulations🎉🥳$SUI
First Tp Hits successfully 😁
waiting for others Tp Hits also ...
#LearnWithFatima
{future}(SUIUSDT)
Congratulations🎉🥳$SUI
First Tp Hits successfully 😁
waiting for others Tp Hits also ...
#LearnWithFatima
First Tp Hits successfully 😁
waiting for others Tp Hits also ...
#LearnWithFatima
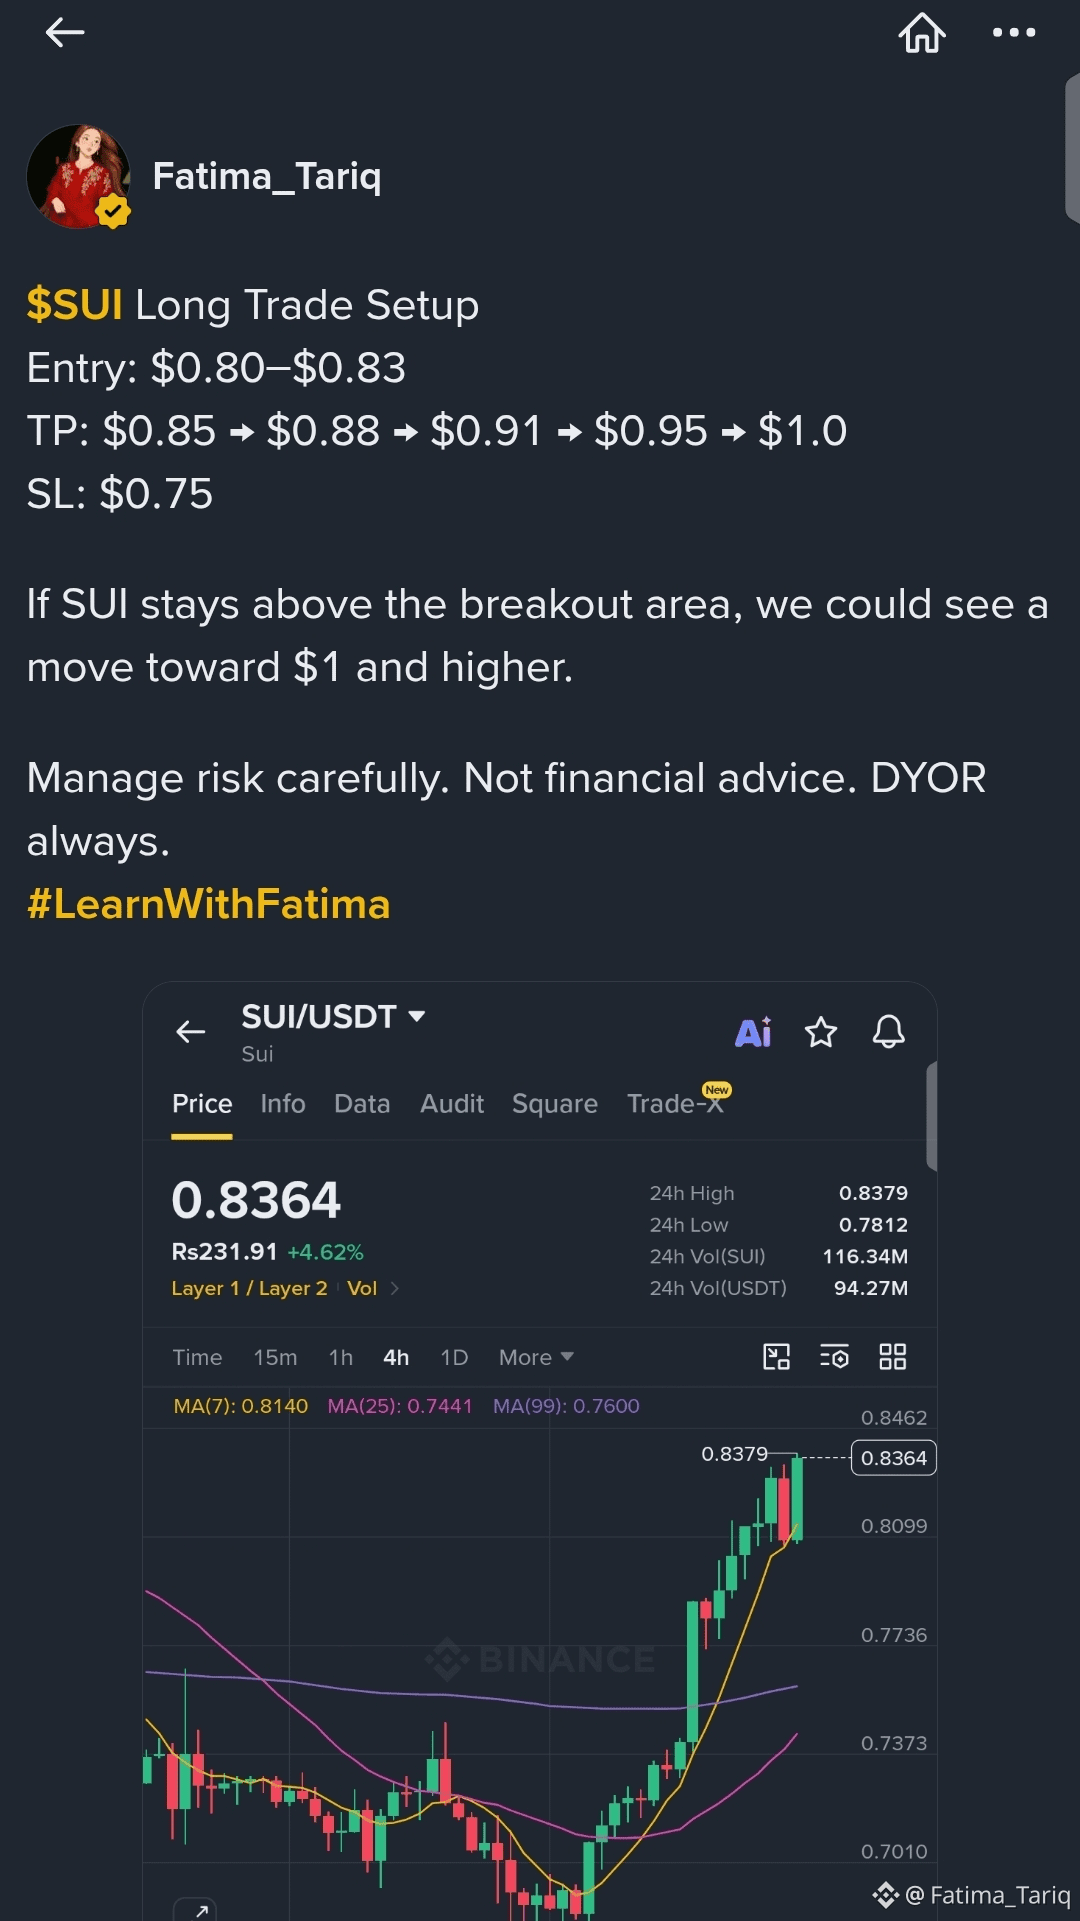
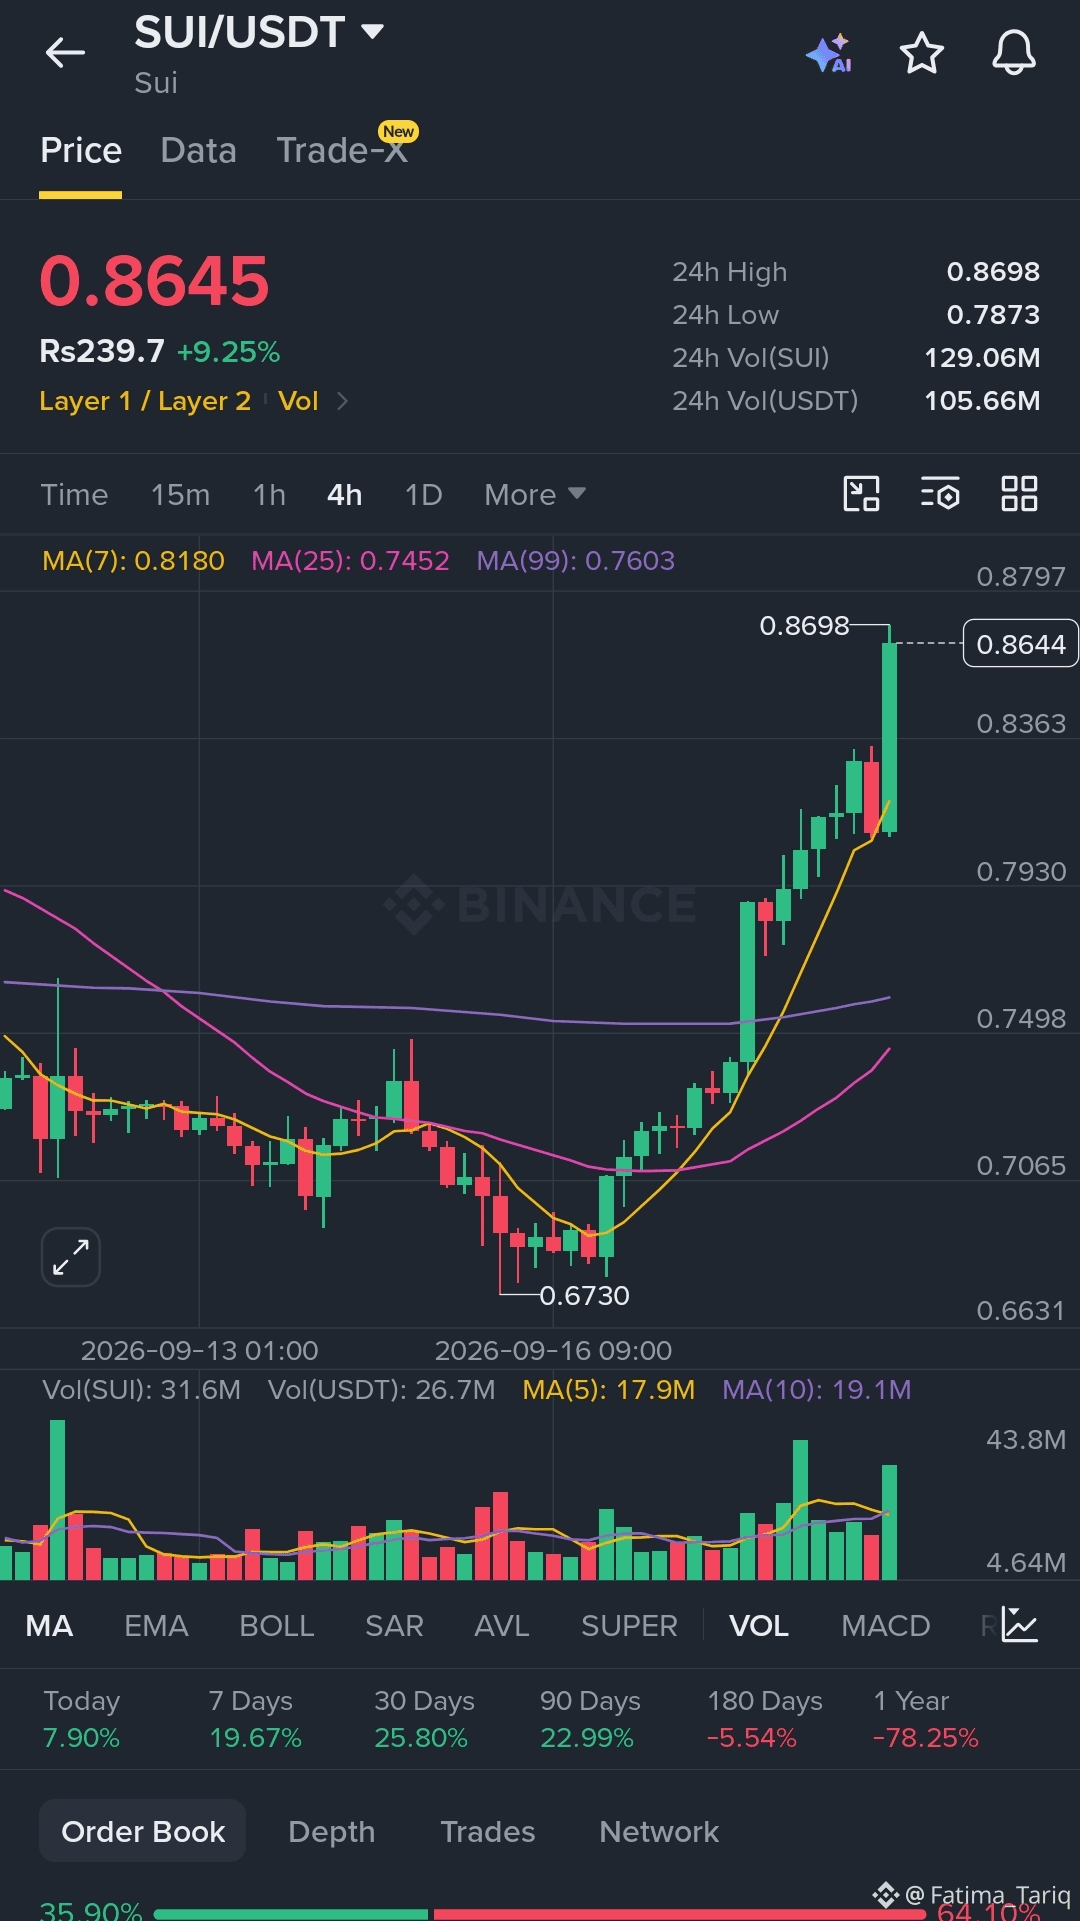
Fatima_Tariq
·
--
Bullish$SUI Long Trade Setup
Entry: $0.80–$0.83
TP: $0.85 → $0.88 → $0.91 → $0.95 → $1.0
SL: $0.75
If SUI stays above the breakout area, we could see a move toward $1 and higher.
Manage risk carefully. Not financial advice. DYOR always.
#LearnWithFatima
Entry: $0.80–$0.83
TP: $0.85 → $0.88 → $0.91 → $0.95 → $1.0
SL: $0.75
If SUI stays above the breakout area, we could see a move toward $1 and higher.
Manage risk carefully. Not financial advice. DYOR always.
#LearnWithFatima
2
319

·
--
Both $ZEC and $ZEN played out as predicted. 🎯
TPs hit successfully, with extra profits booked along the way. Hope the #LearnWithFatima family secured their profits and got a safe exit.
Not financial advice.
Always DYOR and manage your risk.
{future}(ZECUSDT)
{spot}(ZENUSDT)
Both $ZEC and $ZEN played out as predicted. 🎯
TPs hit successfully, with extra profits booked along the way. Hope the #LearnWithFatima family secured their profits and got a safe exit.
Not financial advice.
Always DYOR and manage your risk.
TPs hit successfully, with extra profits booked along the way. Hope the #LearnWithFatima family secured their profits and got a safe exit.
Not financial advice.
Always DYOR and manage your risk.
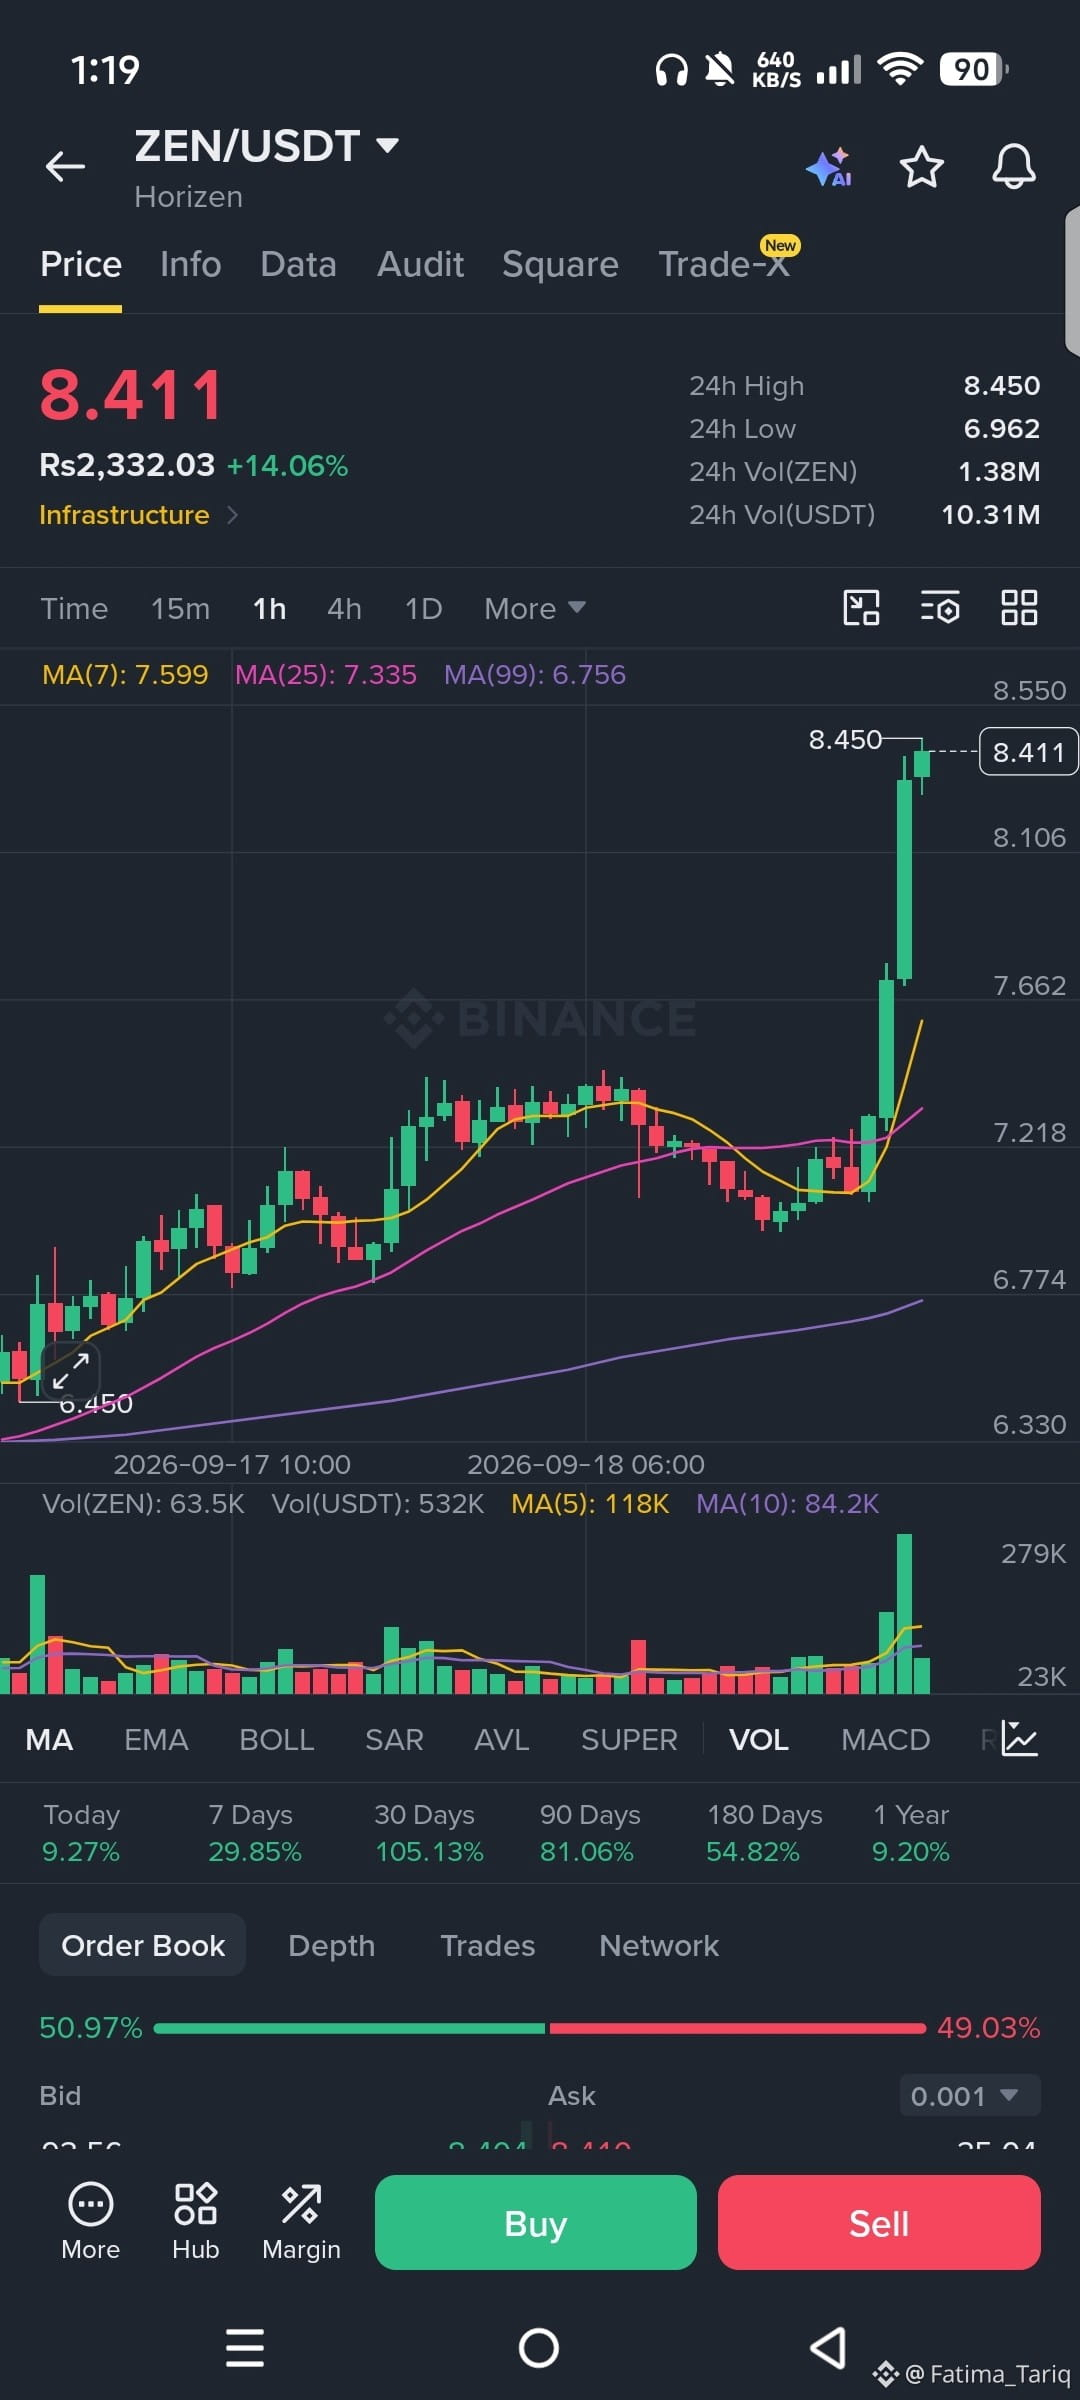
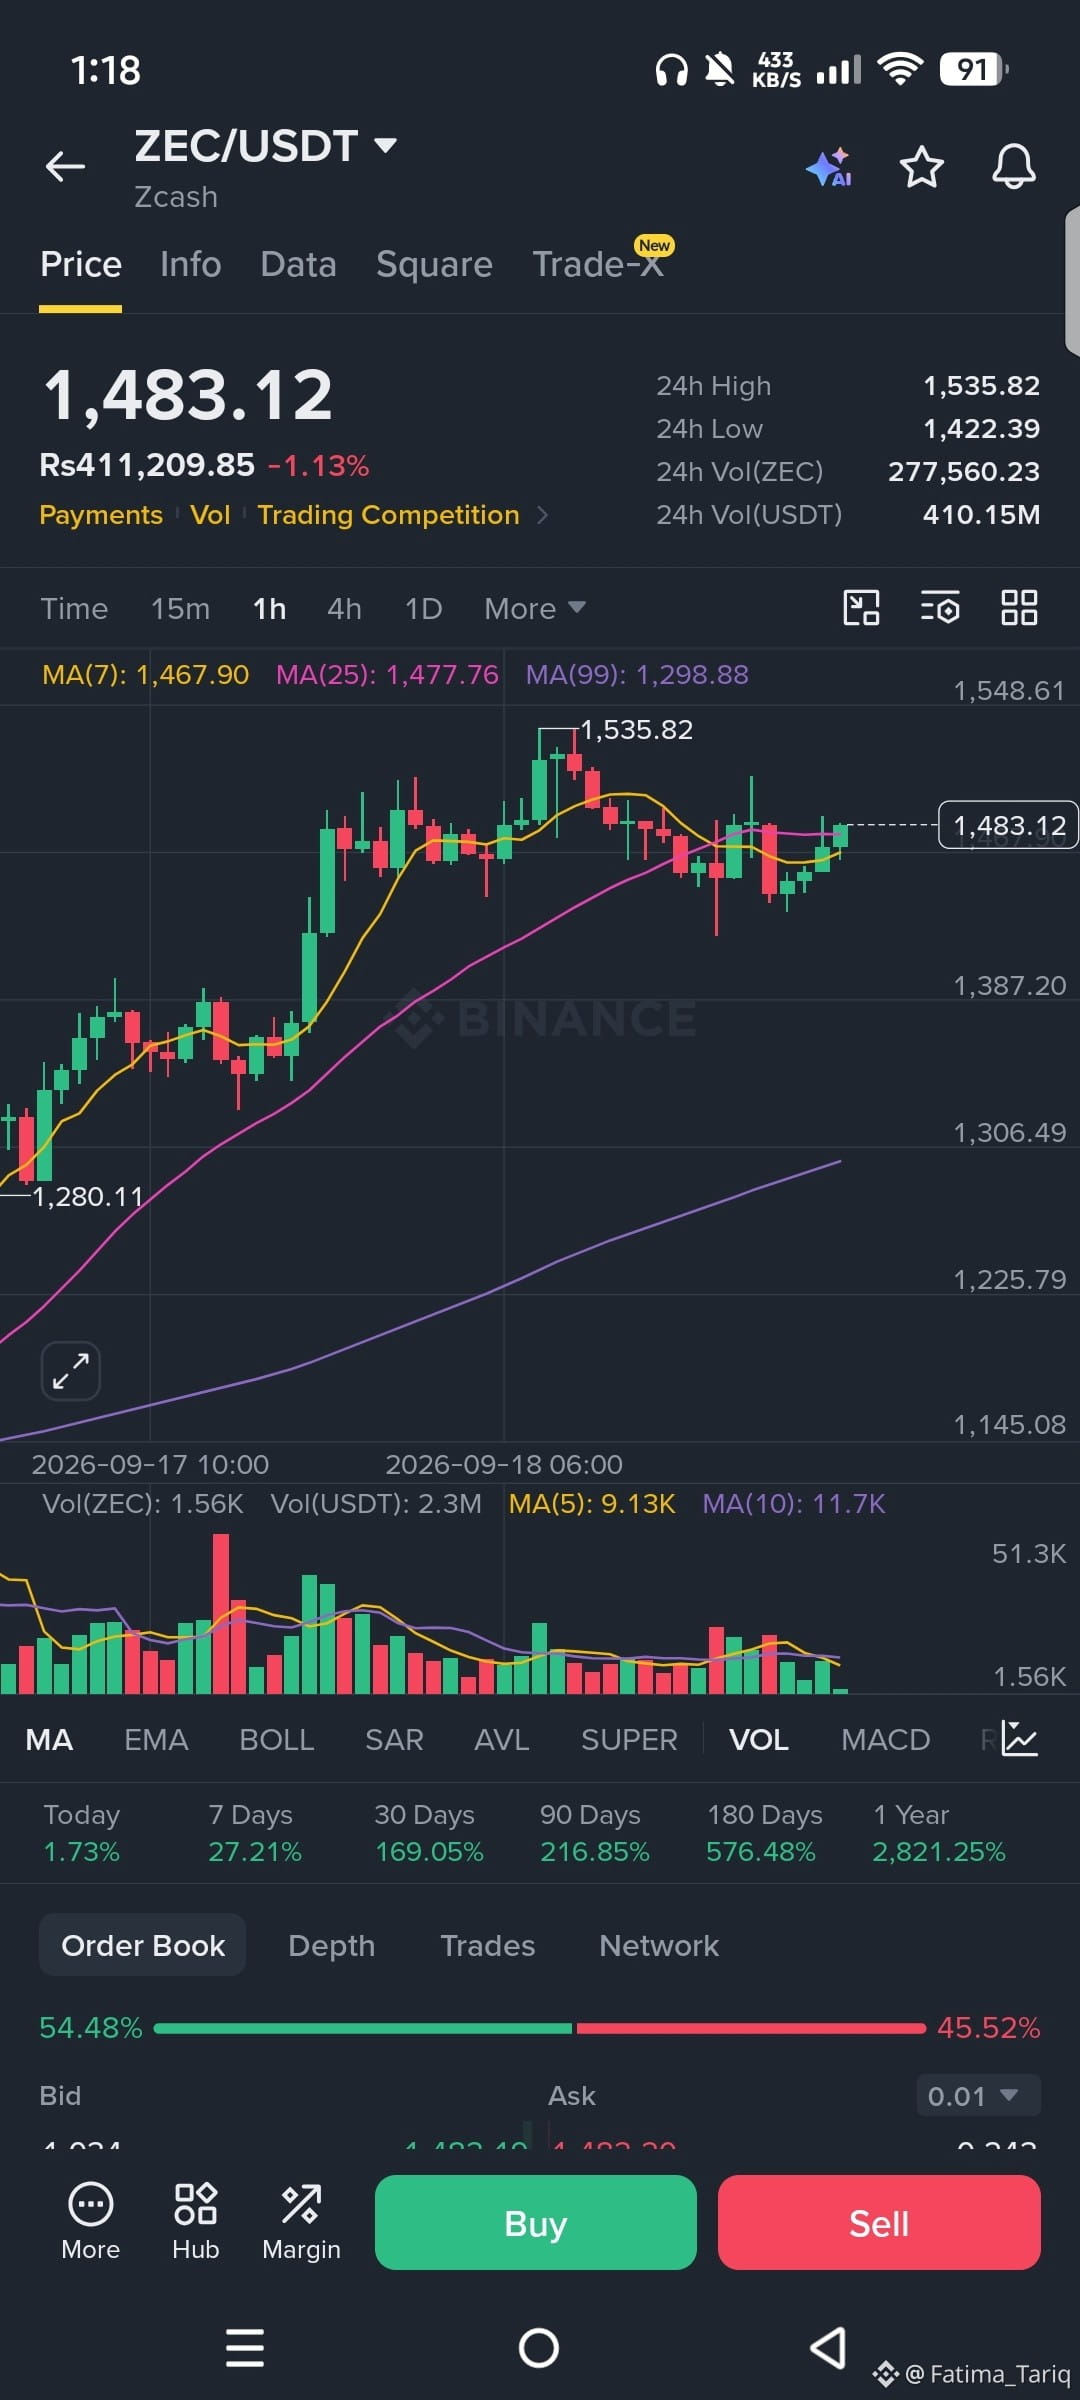
Fatima_Tariq
·
--
BullishZEC / DASH / ZEN Trade Setup 👀
$ZEC : $1,340 breakout → $1,400 / $1,500
Entry: $1,330–1,360
Invalidation: below $1,280
$DASH : $56 breakout → $62 / $70
Entry: $54–57
Invalidation: below $51
$ZEN : $6.80 breakout → $7.50 / $8.20
Entry: $6.60–6.85
Invalidation: below $6.20
#ZEC has the strongest momentum, while #DASH and #ZEN are the catch-up trades. ZEC recently closed around $1,263 after a 13.8% daily move, showing how volatile this rotation is.
It's Not a Financial advice DYOR always .
#LearnWithFatima #ZcashRises6%
$ZEC : $1,340 breakout → $1,400 / $1,500
Entry: $1,330–1,360
Invalidation: below $1,280
$DASH : $56 breakout → $62 / $70
Entry: $54–57
Invalidation: below $51
$ZEN : $6.80 breakout → $7.50 / $8.20
Entry: $6.60–6.85
Invalidation: below $6.20
#ZEC has the strongest momentum, while #DASH and #ZEN are the catch-up trades. ZEC recently closed around $1,263 after a 13.8% daily move, showing how volatile this rotation is.
It's Not a Financial advice DYOR always .
#LearnWithFatima #ZcashRises6%
3
792
·
--
Bullish
ZEC / DASH / ZEN Trade Setup 👀
$ZEC : $1,340 breakout → $1,400 / $1,500
Entry: $1,330–1,360
Invalidation: below $1,280
$DASH : $56 breakout → $62 / $70
Entry: $54–57
Invalidation: below $51
$ZEN : $6.80 breakout → $7.50 / $8.20
Entry: $6.60–6.85
Invalidation: below $6.20
#ZEC has the strongest momentum, while #DASH and #ZEN are the catch-up trades. ZEC recently closed around $1,263 after a 13.8% daily move, showing how volatile this rotation is.
It's Not a Financial advice DYOR always .
#LearnWithFatima #ZcashRises6%
ZEC / DASH / ZEN Trade Setup 👀
$ZEC : $1,340 breakout → $1,400 / $1,500
Entry: $1,330–1,360
Invalidation: below $1,280
$DASH : $56 breakout → $62 / $70
Entry: $54–57
Invalidation: below $51
$ZEN : $6.80 breakout → $7.50 / $8.20
Entry: $6.60–6.85
Invalidation: below $6.20
#ZEC has the strongest momentum, while #DASH and #ZEN are the catch-up trades. ZEC recently closed around $1,263 after a 13.8% daily move, showing how volatile this rotation is.
It's Not a Financial advice DYOR always .
#LearnWithFatima #ZcashRises6%
$ZEC : $1,340 breakout → $1,400 / $1,500
Entry: $1,330–1,360
Invalidation: below $1,280
$DASH : $56 breakout → $62 / $70
Entry: $54–57
Invalidation: below $51
$ZEN : $6.80 breakout → $7.50 / $8.20
Entry: $6.60–6.85
Invalidation: below $6.20
#ZEC has the strongest momentum, while #DASH and #ZEN are the catch-up trades. ZEC recently closed around $1,263 after a 13.8% daily move, showing how volatile this rotation is.
It's Not a Financial advice DYOR always .
#LearnWithFatima #ZcashRises6%
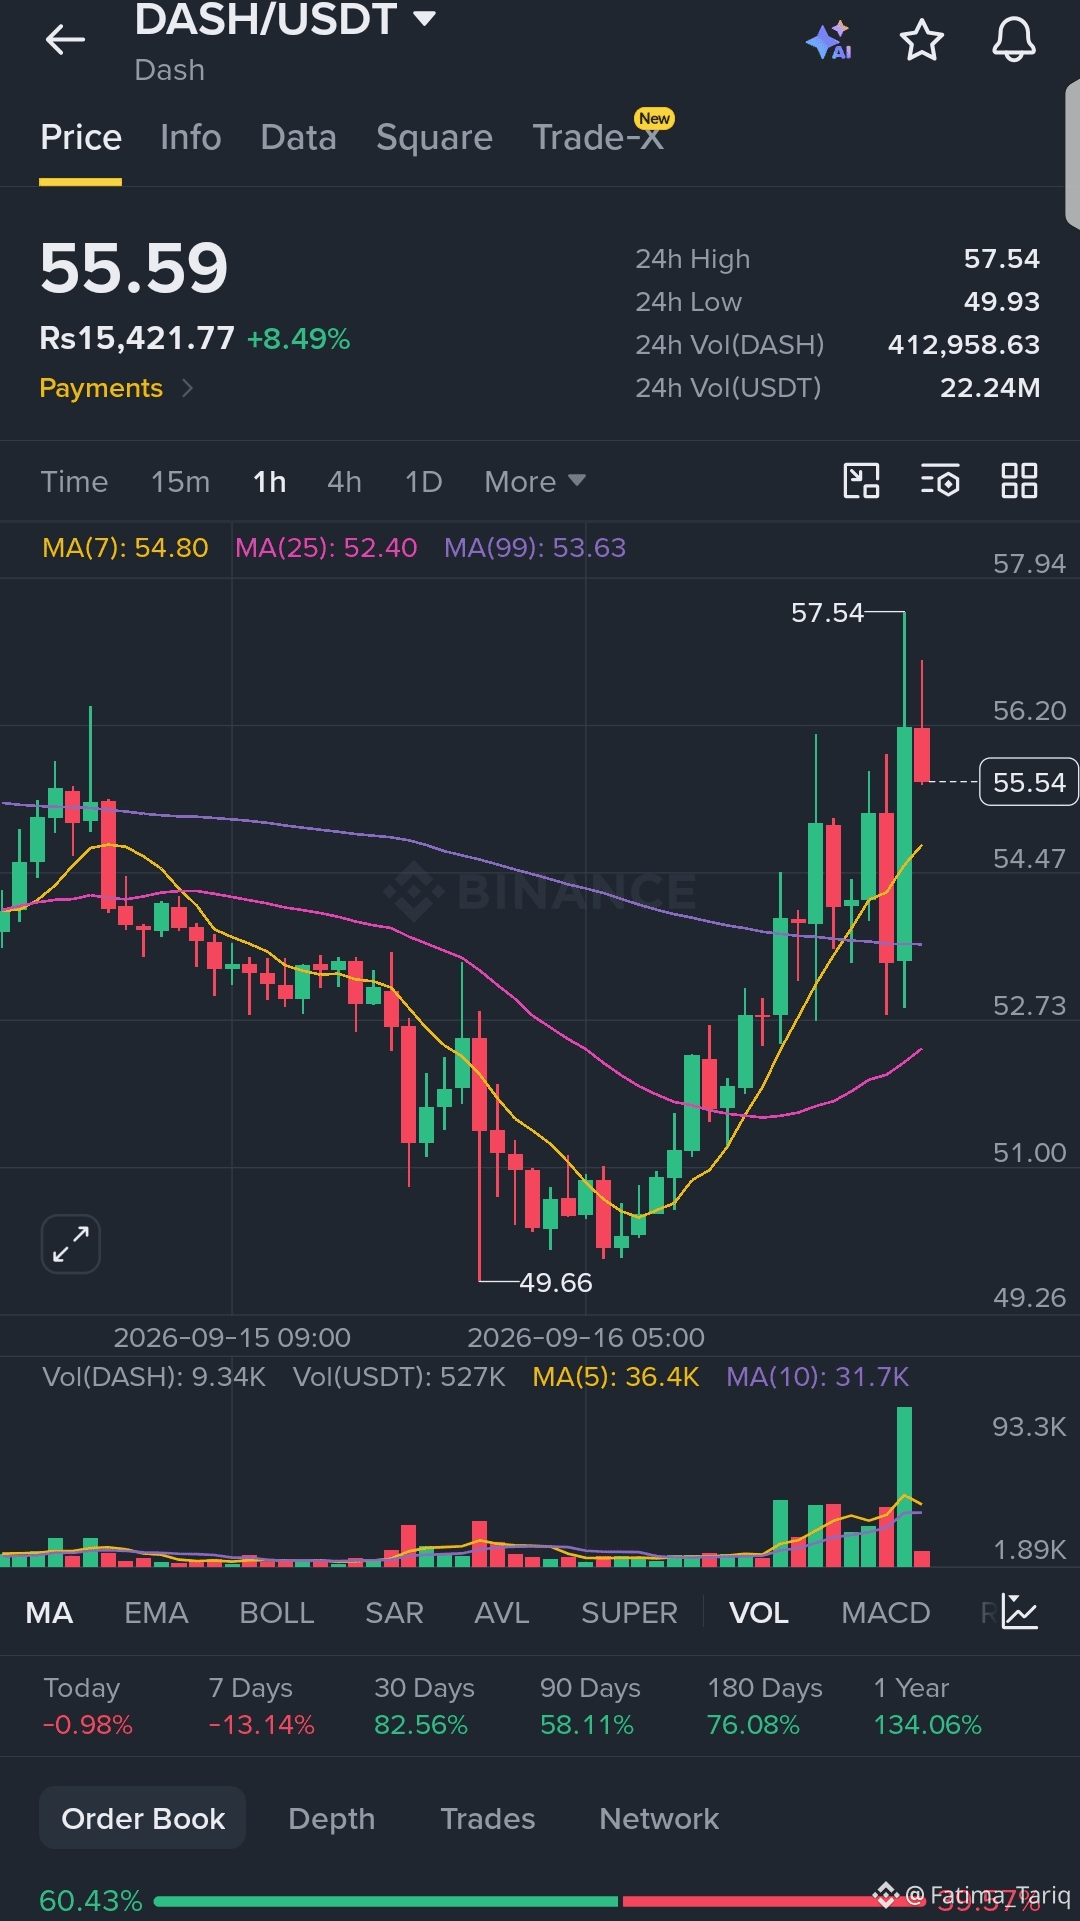
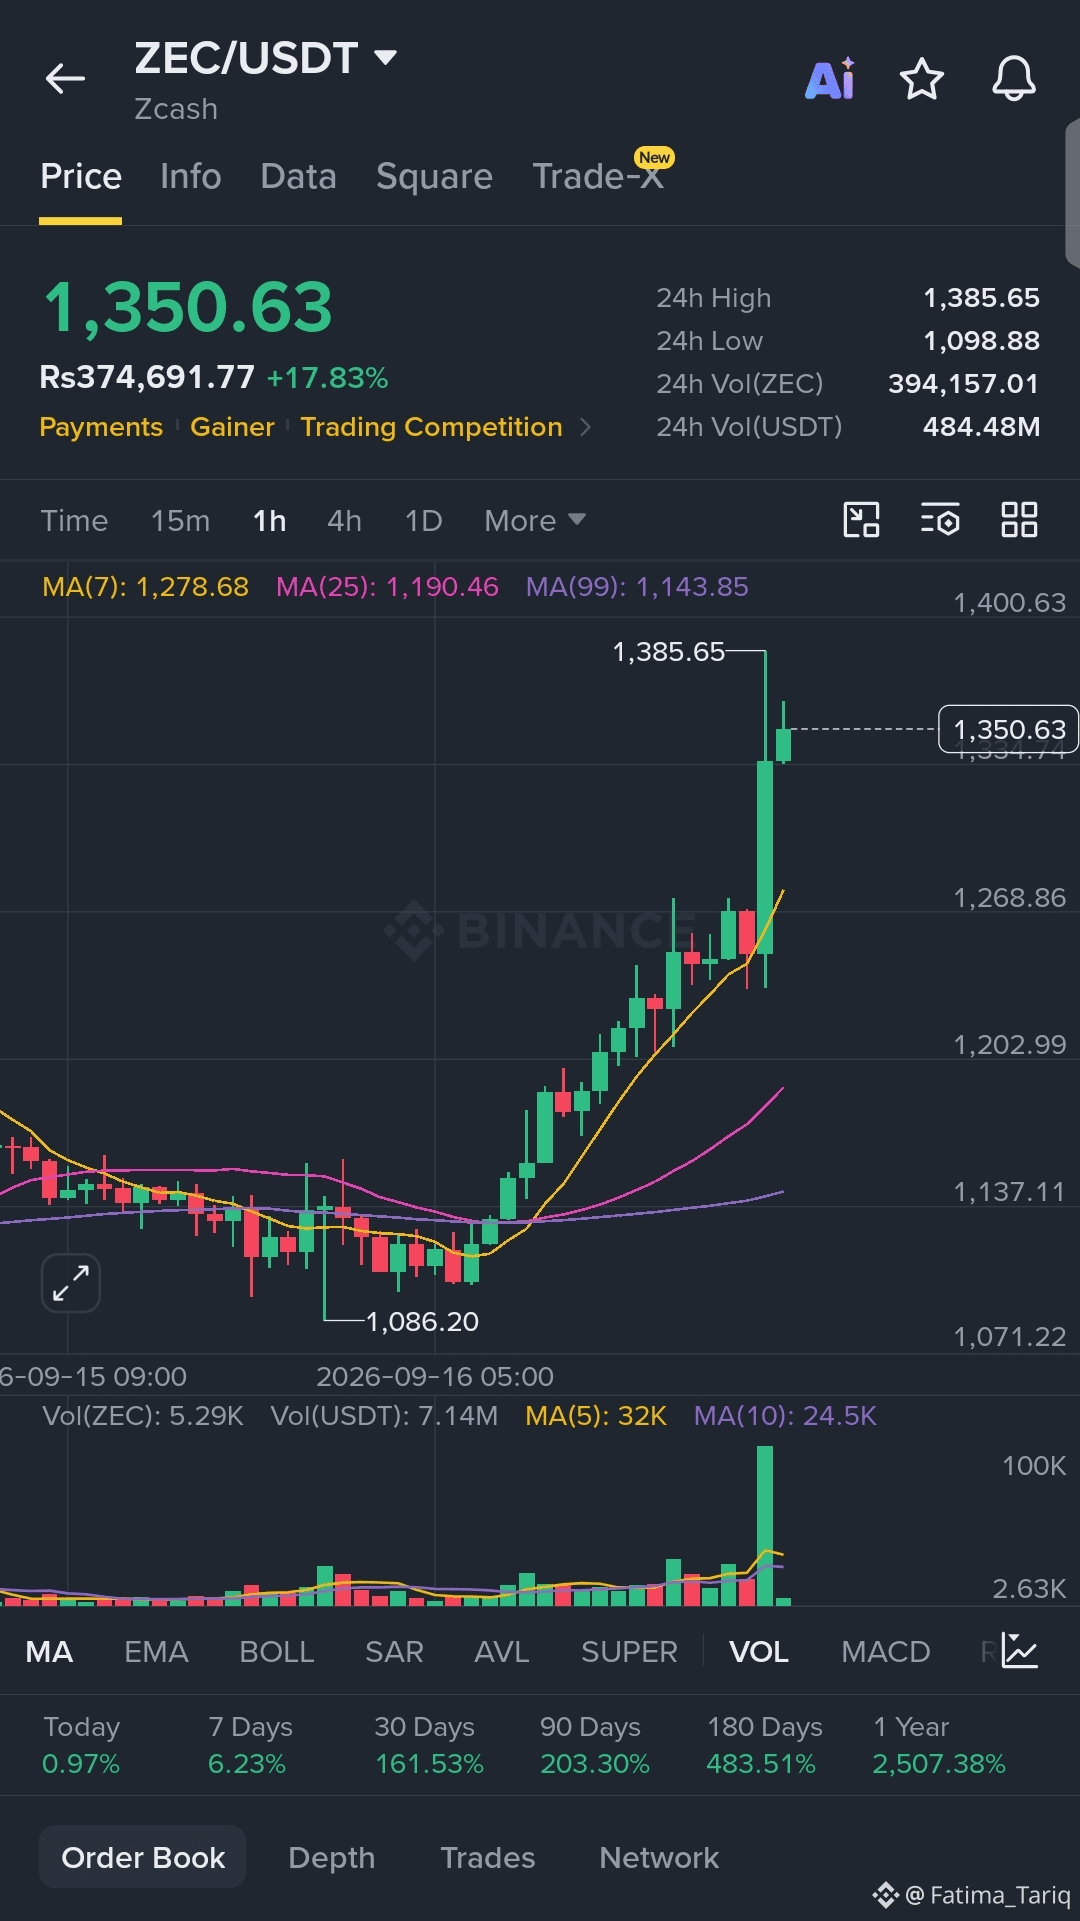
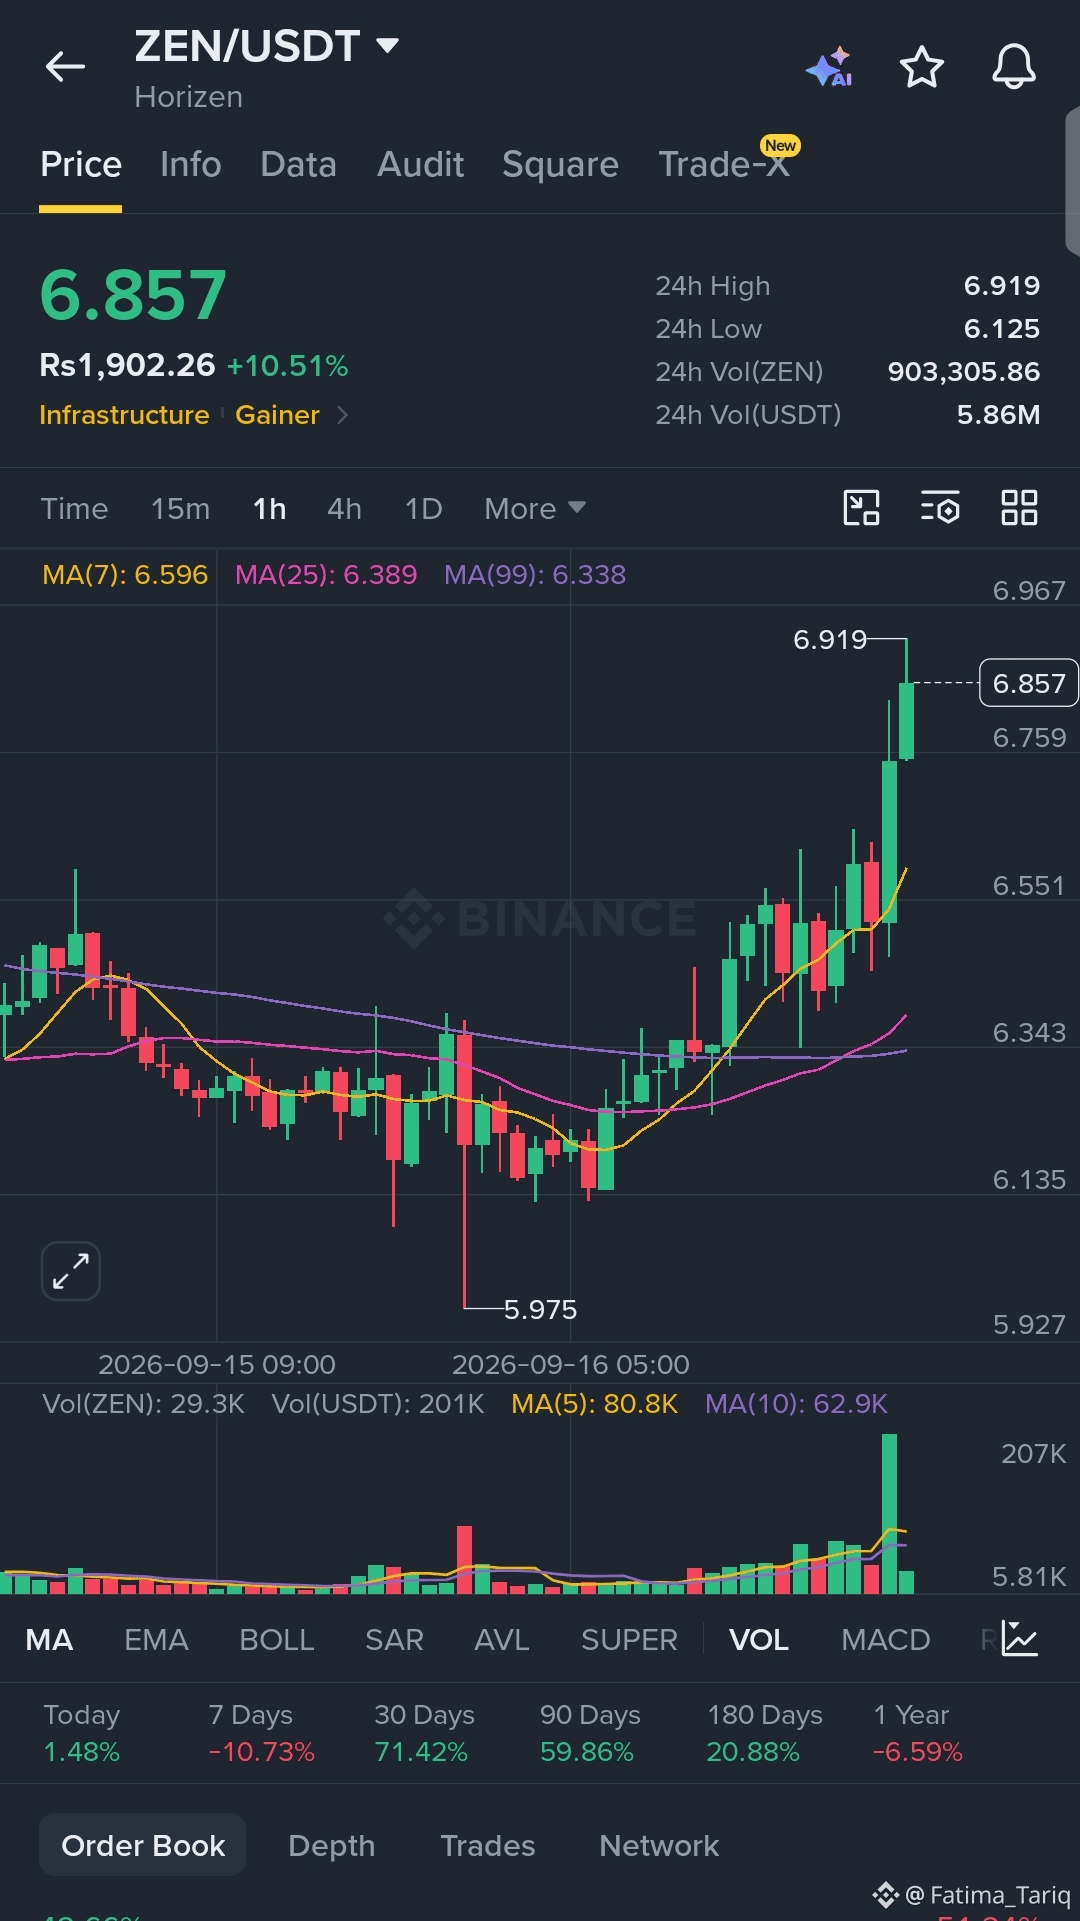
2
4
860
·
--
Bearish
𝗙𝗲𝗱 𝗛𝗶𝗸𝗲𝘀 𝗳𝗼𝗿 𝘁𝗵𝗲 𝗙𝗶𝗿𝘀𝘁 𝗧𝗶𝗺𝗲 𝗦𝗶𝗻𝗰𝗲 𝟮𝟬𝟮𝟯. 𝗡𝗼𝘄 𝘁𝗵𝗲 𝗥𝗲𝗮𝗹 𝗤𝘂𝗲𝘀𝘁𝗶𝗼𝗻 𝗜𝘀: 𝗪𝗵𝗮𝘁 𝗖𝗼𝗺𝗲𝘀 𝗡𝗲𝘅𝘁?
The Fed delivered the move markets were watching.
On September 16, 2026, the Federal Reserve raised rates by 25 bps, taking the target range from 3.50%–3.75% to 3.75%–4.00%. It was the first hike since July 2023.
But the rate hike itself was not the biggest surprise. Markets had already largely priced it in, with roughly 92–94% odds before the decision.
𝗪𝗵𝗮𝘁 𝗺𝗮𝘁𝘁𝗲𝗿𝘀 𝗳𝗼𝗿 𝗰𝗿𝘆𝗽𝘁𝗼 𝗻𝗼𝘄?
1️⃣ The dot plot The Fed's projections point to one more 25 bps hike in 2026, while policymakers expect rates to remain elevated through 2027.
2️⃣ Inflation is still the problem The Fed raised its 2026 inflation projection to 3.7%, well above its 2% target.
3️⃣ BTC entered the decision under pressure Bitcoin was trading around $75.9K ahead of the decision after falling roughly 4% on Tuesday, following the failed Senate vote on the CLARITY Act.
So I would not look at the headline “Fed hikes” alone.
The bigger question for crypto is whether this becomes one isolated hike or the beginning of a renewed tightening cycle.
For $BTC and $ETH , liquidity expectations, Treasury yields, the dollar and Powell/Warsh's forward guidance can matter more than the 25 bps headline itself.
The rate decision was expected.
The path from here is what the market has to digest. #FedRateWatch
#LearnWithFatima
𝗙𝗲𝗱 𝗛𝗶𝗸𝗲𝘀 𝗳𝗼𝗿 𝘁𝗵𝗲 𝗙𝗶𝗿𝘀𝘁 𝗧𝗶𝗺𝗲 𝗦𝗶𝗻𝗰𝗲 𝟮𝟬𝟮𝟯. 𝗡𝗼𝘄 𝘁𝗵𝗲 𝗥𝗲𝗮𝗹 𝗤𝘂𝗲𝘀𝘁𝗶𝗼𝗻 𝗜𝘀: 𝗪𝗵𝗮𝘁 𝗖𝗼𝗺𝗲𝘀 𝗡𝗲𝘅𝘁?
The Fed delivered the move markets were watching.
On September 16, 2026, the Federal Reserve raised rates by 25 bps, taking the target range from 3.50%–3.75% to 3.75%–4.00%. It was the first hike since July 2023.
But the rate hike itself was not the biggest surprise. Markets had already largely priced it in, with roughly 92–94% odds before the decision.
𝗪𝗵𝗮𝘁 𝗺𝗮𝘁𝘁𝗲𝗿𝘀 𝗳𝗼𝗿 𝗰𝗿𝘆𝗽𝘁𝗼 𝗻𝗼𝘄?
1️⃣ The dot plot The Fed's projections point to one more 25 bps hike in 2026, while policymakers expect rates to remain elevated through 2027.
2️⃣ Inflation is still the problem The Fed raised its 2026 inflation projection to 3.7%, well above its 2% target.
3️⃣ BTC entered the decision under pressure Bitcoin was trading around $75.9K ahead of the decision after falling roughly 4% on Tuesday, following the failed Senate vote on the CLARITY Act.
So I would not look at the headline “Fed hikes” alone.
The bigger question for crypto is whether this becomes one isolated hike or the beginning of a renewed tightening cycle.
For $BTC and $ETH , liquidity expectations, Treasury yields, the dollar and Powell/Warsh's forward guidance can matter more than the 25 bps headline itself.
The rate decision was expected.
The path from here is what the market has to digest. #FedRateWatch
#LearnWithFatima
The Fed delivered the move markets were watching.
On September 16, 2026, the Federal Reserve raised rates by 25 bps, taking the target range from 3.50%–3.75% to 3.75%–4.00%. It was the first hike since July 2023.
But the rate hike itself was not the biggest surprise. Markets had already largely priced it in, with roughly 92–94% odds before the decision.
𝗪𝗵𝗮𝘁 𝗺𝗮𝘁𝘁𝗲𝗿𝘀 𝗳𝗼𝗿 𝗰𝗿𝘆𝗽𝘁𝗼 𝗻𝗼𝘄?
1️⃣ The dot plot The Fed's projections point to one more 25 bps hike in 2026, while policymakers expect rates to remain elevated through 2027.
2️⃣ Inflation is still the problem The Fed raised its 2026 inflation projection to 3.7%, well above its 2% target.
3️⃣ BTC entered the decision under pressure Bitcoin was trading around $75.9K ahead of the decision after falling roughly 4% on Tuesday, following the failed Senate vote on the CLARITY Act.
So I would not look at the headline “Fed hikes” alone.
The bigger question for crypto is whether this becomes one isolated hike or the beginning of a renewed tightening cycle.
For $BTC and $ETH , liquidity expectations, Treasury yields, the dollar and Powell/Warsh's forward guidance can matter more than the 25 bps headline itself.
The rate decision was expected.
The path from here is what the market has to digest. #FedRateWatch
#LearnWithFatima


4
518
·
--
Bearish
CLARITY Act Odds Just Collapsed. Is Crypto Regulation Losing Momentum?
The CLARITY Act is facing its biggest test yet.
Just yesterday, prediction-market odds for the bill becoming law in 2026 had climbed toward 30%, after Senate Republicans released a revised version with more than 120 changes aimed at addressing Democratic concerns.
But ahead of today’s Senate procedural vote, those odds have fallen sharply again, with reports showing Polymarket pricing dropping toward the mid-teens.
And this is where the 60-vote threshold becomes critical.
Republicans hold 53 Senate seats, meaning the bill needs at least 7 Democrats or independents to cross the line and advance.
What interests me is that the market isn't simply reacting to whether crypto regulation is “good” or “bad.”
It is pricing political execution risk.
The revised bill includes major changes around ethics, DeFi and regulatory oversight, but disagreements remain over stablecoin rules, Trump-related crypto interests and the exact regulatory framework.
So for BTC and ETH, I would not treat the CLARITY Act as an automatic bullish catalyst.
If 60 votes are secured:
→ regulatory uncertainty could decrease
→ institutional confidence could improve
→ the broader US crypto market may get a clearer framework
If the vote fails:
→ expectations for 2026 passage could deteriorate quickly
→ regulatory uncertainty remains
→ crypto may continue trading around political headlines rather than fundamentals
The bigger lesson for me is simple:
A 30% probability was never a guarantee. And a sharp drop doesn't mean the bill is permanently dead.
Today’s vote is about whether the legislation can move forward.
The real question is: can 60 senators agree on what “crypto clarity” should actually look like?
#ClarityActOddsHalveOnPolymarket
#LearnWithFatima $BTC $ETH
{future}(ETHUSDT)
{future}(BTCUSDT)
CLARITY Act Odds Just Collapsed. Is Crypto Regulation Losing Momentum?
The CLARITY Act is facing its biggest test yet.
Just yesterday, prediction-market odds for the bill becoming law in 2026 had climbed toward 30%, after Senate Republicans released a revised version with more than 120 changes aimed at addressing Democratic concerns.
But ahead of today’s Senate procedural vote, those odds have fallen sharply again, with reports showing Polymarket pricing dropping toward the mid-teens.
And this is where the 60-vote threshold becomes critical.
Republicans hold 53 Senate seats, meaning the bill needs at least 7 Democrats or independents to cross the line and advance.
What interests me is that the market isn't simply reacting to whether crypto regulation is “good” or “bad.”
It is pricing political execution risk.
The revised bill includes major changes around ethics, DeFi and regulatory oversight, but disagreements remain over stablecoin rules, Trump-related crypto interests and the exact regulatory framework.
So for BTC and ETH, I would not treat the CLARITY Act as an automatic bullish catalyst.
If 60 votes are secured:
→ regulatory uncertainty could decrease
→ institutional confidence could improve
→ the broader US crypto market may get a clearer framework
If the vote fails:
→ expectations for 2026 passage could deteriorate quickly
→ regulatory uncertainty remains
→ crypto may continue trading around political headlines rather than fundamentals
The bigger lesson for me is simple:
A 30% probability was never a guarantee. And a sharp drop doesn't mean the bill is permanently dead.
Today’s vote is about whether the legislation can move forward.
The real question is: can 60 senators agree on what “crypto clarity” should actually look like?
#ClarityActOddsHalveOnPolymarket
#LearnWithFatima $BTC $ETH
The CLARITY Act is facing its biggest test yet.
Just yesterday, prediction-market odds for the bill becoming law in 2026 had climbed toward 30%, after Senate Republicans released a revised version with more than 120 changes aimed at addressing Democratic concerns.
But ahead of today’s Senate procedural vote, those odds have fallen sharply again, with reports showing Polymarket pricing dropping toward the mid-teens.
And this is where the 60-vote threshold becomes critical.
Republicans hold 53 Senate seats, meaning the bill needs at least 7 Democrats or independents to cross the line and advance.
What interests me is that the market isn't simply reacting to whether crypto regulation is “good” or “bad.”
It is pricing political execution risk.
The revised bill includes major changes around ethics, DeFi and regulatory oversight, but disagreements remain over stablecoin rules, Trump-related crypto interests and the exact regulatory framework.
So for BTC and ETH, I would not treat the CLARITY Act as an automatic bullish catalyst.
If 60 votes are secured:
→ regulatory uncertainty could decrease
→ institutional confidence could improve
→ the broader US crypto market may get a clearer framework
If the vote fails:
→ expectations for 2026 passage could deteriorate quickly
→ regulatory uncertainty remains
→ crypto may continue trading around political headlines rather than fundamentals
The bigger lesson for me is simple:
A 30% probability was never a guarantee. And a sharp drop doesn't mean the bill is permanently dead.
Today’s vote is about whether the legislation can move forward.
The real question is: can 60 senators agree on what “crypto clarity” should actually look like?
#ClarityActOddsHalveOnPolymarket
#LearnWithFatima $BTC $ETH
2
1
4
1.2k
·
--
Bearish
The CLARITY Act vote just showed how quickly crypto can reprice political expectations.
The Senate failed to reach the 60 votes needed to advance the Digital Asset Market Clarity Act, putting months of negotiations on hold. BTC dropped toward $75K, while ETH, XRP and the broader altcoin market also came under pressure.
But I think the bigger issue is not the vote alone.
The market is entering a much tougher macro window. The 10-year U.S. Treasury yield moved above 5% on September 15, its highest level since 2007, while markets are heavily pricing a 25bps Fed hike.
That creates a double pressure point for crypto:
• Regulatory uncertainty returns as CLARITY stalls
• Higher yields make risk assets less attractive
• BTC is testing the $75K-$76K area
• Altcoins face even greater sensitivity to liquidity
The interesting part is that the CLARITY failure was not completely unexpected. Prediction markets had already reduced the probability of passage significantly.
So the question now is not simply, “Will BTC recover?”
It is whether BTC can hold this area while markets digest tighter monetary conditions, rising Treasury yields and renewed uncertainty around U.S. crypto regulation.
For me, $75K is becoming an important line to watch.
$BTC $ETH
#FedRateWatch
#LearnWithFatima
#ClarityActOddsHalveOnPolymarket
{future}(ETHUSDT)
{future}(BTCUSDT)
The CLARITY Act vote just showed how quickly crypto can reprice political expectations.
The Senate failed to reach the 60 votes needed to advance the Digital Asset Market Clarity Act, putting months of negotiations on hold. BTC dropped toward $75K, while ETH, XRP and the broader altcoin market also came under pressure.
But I think the bigger issue is not the vote alone.
The market is entering a much tougher macro window. The 10-year U.S. Treasury yield moved above 5% on September 15, its highest level since 2007, while markets are heavily pricing a 25bps Fed hike.
That creates a double pressure point for crypto:
• Regulatory uncertainty returns as CLARITY stalls
• Higher yields make risk assets less attractive
• BTC is testing the $75K-$76K area
• Altcoins face even greater sensitivity to liquidity
The interesting part is that the CLARITY failure was not completely unexpected. Prediction markets had already reduced the probability of passage significantly.
So the question now is not simply, “Will BTC recover?”
It is whether BTC can hold this area while markets digest tighter monetary conditions, rising Treasury yields and renewed uncertainty around U.S. crypto regulation.
For me, $75K is becoming an important line to watch.
$BTC $ETH
#FedRateWatch
#LearnWithFatima
#ClarityActOddsHalveOnPolymarket
The Senate failed to reach the 60 votes needed to advance the Digital Asset Market Clarity Act, putting months of negotiations on hold. BTC dropped toward $75K, while ETH, XRP and the broader altcoin market also came under pressure.
But I think the bigger issue is not the vote alone.
The market is entering a much tougher macro window. The 10-year U.S. Treasury yield moved above 5% on September 15, its highest level since 2007, while markets are heavily pricing a 25bps Fed hike.
That creates a double pressure point for crypto:
• Regulatory uncertainty returns as CLARITY stalls
• Higher yields make risk assets less attractive
• BTC is testing the $75K-$76K area
• Altcoins face even greater sensitivity to liquidity
The interesting part is that the CLARITY failure was not completely unexpected. Prediction markets had already reduced the probability of passage significantly.
So the question now is not simply, “Will BTC recover?”
It is whether BTC can hold this area while markets digest tighter monetary conditions, rising Treasury yields and renewed uncertainty around U.S. crypto regulation.
For me, $75K is becoming an important line to watch.
$BTC $ETH
#FedRateWatch
#LearnWithFatima
#ClarityActOddsHalveOnPolymarket
Fatima_Tariq
·
--
BearishCLARITY Act Odds Just Collapsed. Is Crypto Regulation Losing Momentum?
The CLARITY Act is facing its biggest test yet.
Just yesterday, prediction-market odds for the bill becoming law in 2026 had climbed toward 30%, after Senate Republicans released a revised version with more than 120 changes aimed at addressing Democratic concerns.
But ahead of today’s Senate procedural vote, those odds have fallen sharply again, with reports showing Polymarket pricing dropping toward the mid-teens.
And this is where the 60-vote threshold becomes critical.
Republicans hold 53 Senate seats, meaning the bill needs at least 7 Democrats or independents to cross the line and advance.
What interests me is that the market isn't simply reacting to whether crypto regulation is “good” or “bad.”
It is pricing political execution risk.
The revised bill includes major changes around ethics, DeFi and regulatory oversight, but disagreements remain over stablecoin rules, Trump-related crypto interests and the exact regulatory framework.
So for BTC and ETH, I would not treat the CLARITY Act as an automatic bullish catalyst.
If 60 votes are secured:
→ regulatory uncertainty could decrease
→ institutional confidence could improve
→ the broader US crypto market may get a clearer framework
If the vote fails:
→ expectations for 2026 passage could deteriorate quickly
→ regulatory uncertainty remains
→ crypto may continue trading around political headlines rather than fundamentals
The bigger lesson for me is simple:
A 30% probability was never a guarantee. And a sharp drop doesn't mean the bill is permanently dead.
Today’s vote is about whether the legislation can move forward.
The real question is: can 60 senators agree on what “crypto clarity” should actually look like?
#ClarityActOddsHalveOnPolymarket
#LearnWithFatima $BTC $ETH
The CLARITY Act is facing its biggest test yet.
Just yesterday, prediction-market odds for the bill becoming law in 2026 had climbed toward 30%, after Senate Republicans released a revised version with more than 120 changes aimed at addressing Democratic concerns.
But ahead of today’s Senate procedural vote, those odds have fallen sharply again, with reports showing Polymarket pricing dropping toward the mid-teens.
And this is where the 60-vote threshold becomes critical.
Republicans hold 53 Senate seats, meaning the bill needs at least 7 Democrats or independents to cross the line and advance.
What interests me is that the market isn't simply reacting to whether crypto regulation is “good” or “bad.”
It is pricing political execution risk.
The revised bill includes major changes around ethics, DeFi and regulatory oversight, but disagreements remain over stablecoin rules, Trump-related crypto interests and the exact regulatory framework.
So for BTC and ETH, I would not treat the CLARITY Act as an automatic bullish catalyst.
If 60 votes are secured:
→ regulatory uncertainty could decrease
→ institutional confidence could improve
→ the broader US crypto market may get a clearer framework
If the vote fails:
→ expectations for 2026 passage could deteriorate quickly
→ regulatory uncertainty remains
→ crypto may continue trading around political headlines rather than fundamentals
The bigger lesson for me is simple:
A 30% probability was never a guarantee. And a sharp drop doesn't mean the bill is permanently dead.
Today’s vote is about whether the legislation can move forward.
The real question is: can 60 senators agree on what “crypto clarity” should actually look like?
#ClarityActOddsHalveOnPolymarket
#LearnWithFatima $BTC $ETH

5
440
·
--
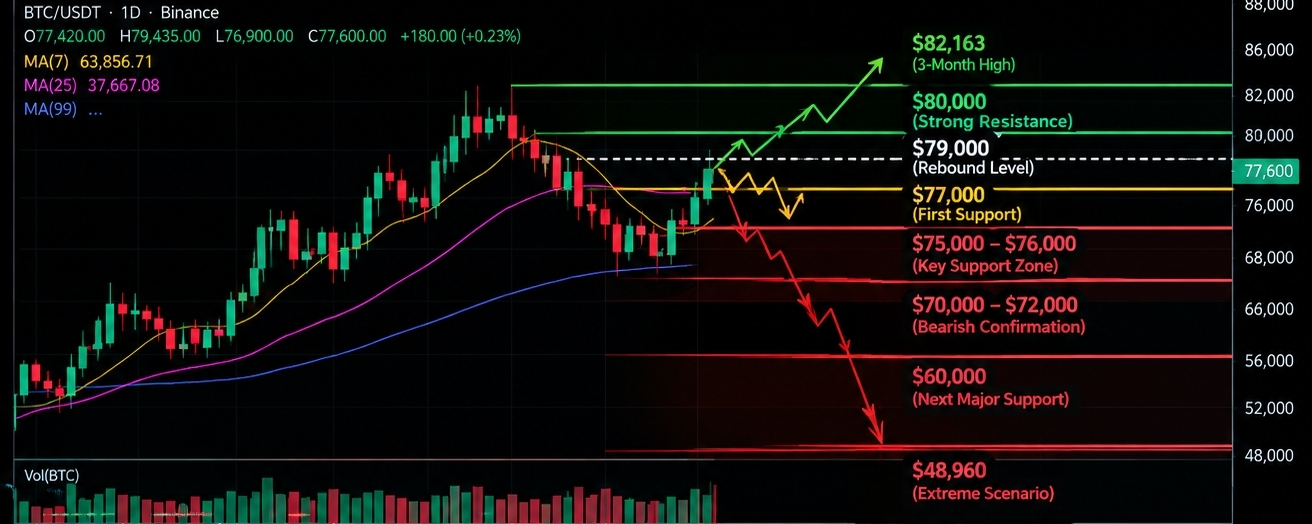
Article
Bitcoin Rebounds to $79K, So Why Are Some Traders Calling for $48K?Bitcoin briefly reclaimed the $79K area on September 15, but the move quickly cooled back toward $77K. That has created two very different views: some traders see another recovery attempt, while others are preparing for a much deeper correction toward $48K.
For me, the important part is not choosing a target. It is watching what happens at the key levels and what the macro data does next.
1. Why the $48K scenario is getting attention
The macro environment is becoming less friendly for risk assets.
10Y Treasury yield: above 5%, its highest level since 2007Oil: above $107Fed hike probability: above 94%BTC: back around $77K after failing to hold the $79K rebound
Higher yields + higher oil + stronger inflation pressure can keep liquidity tight and make BTC more vulnerable.
But $48K is not a confirmed target. From ~$77K, BTC would need to fall almost 38%.
2. What I would watch from here
👉If BTC holds $75K–$77K:
The $48K thesis becomes harder to support, especially if buyers return and ETF flows remain positive.
👉If BTC reclaims $79K–$80K:
That would show buyers are absorbing the macro pressure.
👉If BTC breaks above ~$82K:
The bearish structure would weaken significantly and the market could start looking toward higher levels again.
👉If BTC loses $75K–$76K:
That would be the first serious warning that the rebound is failing.
👉If $70K–$72K also breaks:
Then the downside structure becomes much more concerning, and deeper targets like $60K or below become more realistic.
3. The part I don't want to ignore
There is still institutional demand underneath the market.
Ethereum spot ETFs recorded around $121M in net inflows on September 14, while Bitmine holds roughly 5.95M ETH, with more than 5.06M ETH staked.
So this isn't simply a story of “everyone is selling crypto.”
My checklist is simple:
Hold $75K → recovery remains possible.Lose $75K → caution increases.Lose $70K–$72K → bearish case strengthens.Reclaim $80K → bears lose some momentum.Break ~$82K → $48K becomes much harder to argue from the current structure.
The next major catalyst is the Fed decision and guidance on September 16. Until then, I think BTC levels matter more than dramatic predictions.
What are you watching: $80K breakout or $75K breakdown?
#BitcoinReboundsTo$79K #bitcoin #BTC走势分析 #LearnWithFatima #BTC☀
Bitcoin Rebounds to $79K, So Why Are Some Traders Calling for $48K?
Bitcoin briefly reclaimed the $79K area on September 15, but the move quickly cooled back toward $77K. That has created two very different views: some traders see another recovery attempt, while others are preparing for a much deeper correction toward $48K.
For me, the important part is not choosing a target. It is watching what happens at the key levels and what the macro data does next.
1. Why the $48K scenario is getting attention
The macro environment is becoming less friendly for risk assets.
10Y Treasury yield: above 5%, its highest level since 2007Oil: above $107Fed hike probability: above 94%BTC: back around $77K after failing to hold the $79K rebound
Higher yields + higher oil + stronger inflation pressure can keep liquidity tight and make BTC more vulnerable.
But $48K is not a confirmed target. From ~$77K, BTC would need to fall almost 38%.
2. What I would watch from here
👉If BTC holds $75K–$77K:
The $48K thesis becomes harder to support, especially if buyers return and ETF flows remain positive.
👉If BTC reclaims $79K–$80K:
That would show buyers are absorbing the macro pressure.
👉If BTC breaks above ~$82K:
The bearish structure would weaken significantly and the market could start looking toward higher levels again.
👉If BTC loses $75K–$76K:
That would be the first serious warning that the rebound is failing.
👉If $70K–$72K also breaks:
Then the downside structure becomes much more concerning, and deeper targets like $60K or below become more realistic.
3. The part I don't want to ignore
There is still institutional demand underneath the market.
Ethereum spot ETFs recorded around $121M in net inflows on September 14, while Bitmine holds roughly 5.95M ETH, with more than 5.06M ETH staked.
So this isn't simply a story of “everyone is selling crypto.”
My checklist is simple:
Hold $75K → recovery remains possible.Lose $75K → caution increases.Lose $70K–$72K → bearish case strengthens.Reclaim $80K → bears lose some momentum.Break ~$82K → $48K becomes much harder to argue from the current structure.
The next major catalyst is the Fed decision and guidance on September 16. Until then, I think BTC levels matter more than dramatic predictions.
What are you watching: $80K breakout or $75K breakdown?
#BitcoinReboundsTo$79K #bitcoin #BTC走势分析 #LearnWithFatima #BTC☀
For me, the important part is not choosing a target. It is watching what happens at the key levels and what the macro data does next.
1. Why the $48K scenario is getting attention
The macro environment is becoming less friendly for risk assets.
10Y Treasury yield: above 5%, its highest level since 2007Oil: above $107Fed hike probability: above 94%BTC: back around $77K after failing to hold the $79K rebound
Higher yields + higher oil + stronger inflation pressure can keep liquidity tight and make BTC more vulnerable.
But $48K is not a confirmed target. From ~$77K, BTC would need to fall almost 38%.
2. What I would watch from here
👉If BTC holds $75K–$77K:
The $48K thesis becomes harder to support, especially if buyers return and ETF flows remain positive.
👉If BTC reclaims $79K–$80K:
That would show buyers are absorbing the macro pressure.
👉If BTC breaks above ~$82K:
The bearish structure would weaken significantly and the market could start looking toward higher levels again.
👉If BTC loses $75K–$76K:
That would be the first serious warning that the rebound is failing.
👉If $70K–$72K also breaks:
Then the downside structure becomes much more concerning, and deeper targets like $60K or below become more realistic.
3. The part I don't want to ignore
There is still institutional demand underneath the market.
Ethereum spot ETFs recorded around $121M in net inflows on September 14, while Bitmine holds roughly 5.95M ETH, with more than 5.06M ETH staked.
So this isn't simply a story of “everyone is selling crypto.”
My checklist is simple:
Hold $75K → recovery remains possible.Lose $75K → caution increases.Lose $70K–$72K → bearish case strengthens.Reclaim $80K → bears lose some momentum.Break ~$82K → $48K becomes much harder to argue from the current structure.
The next major catalyst is the Fed decision and guidance on September 16. Until then, I think BTC levels matter more than dramatic predictions.
What are you watching: $80K breakout or $75K breakdown?
#BitcoinReboundsTo$79K #bitcoin #BTC走势分析 #LearnWithFatima #BTC☀
5
1
6
905
·
--
Bullish
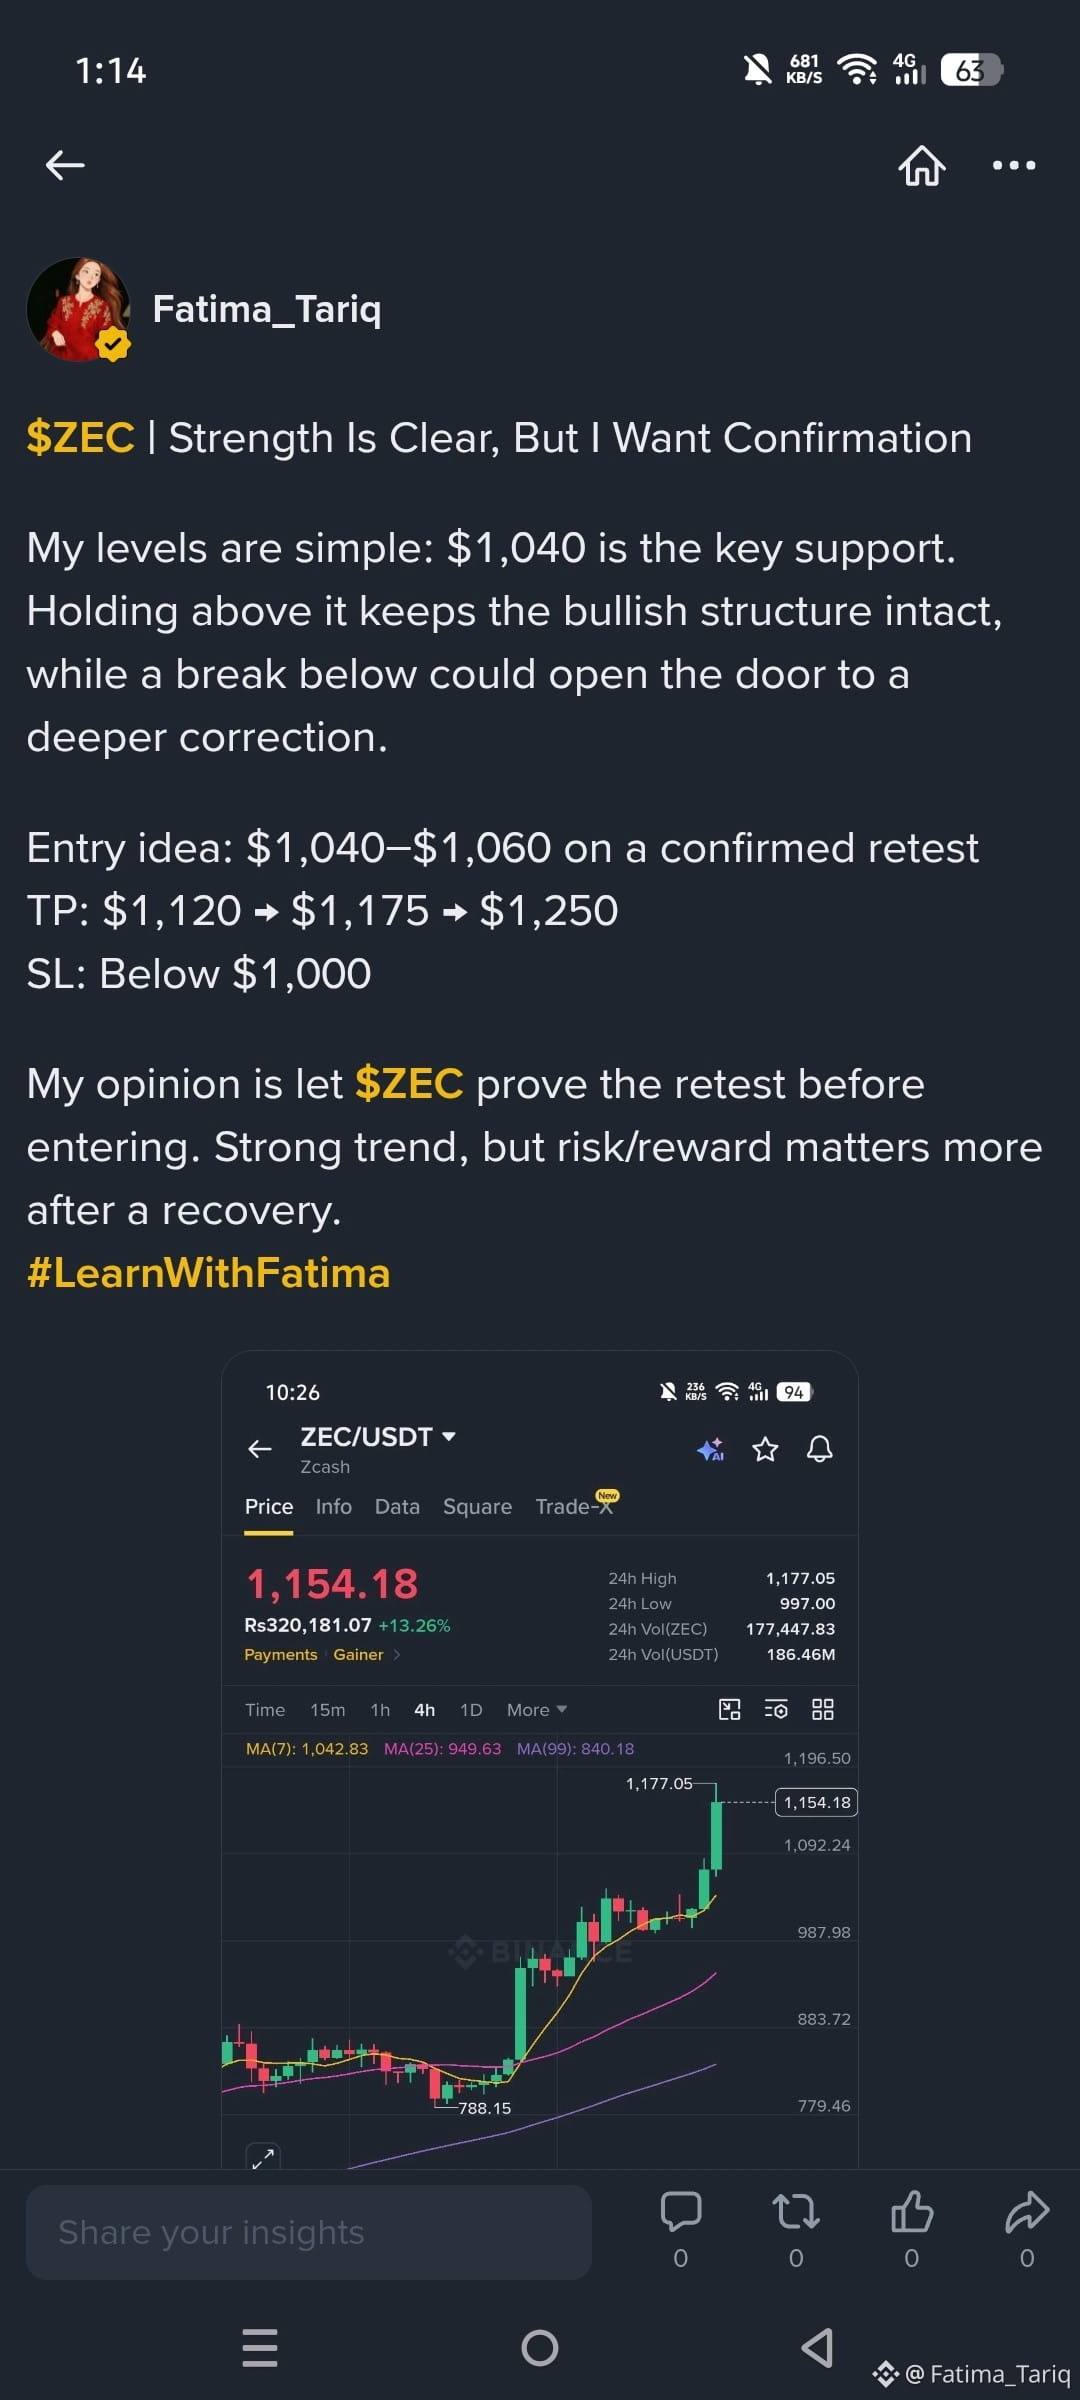
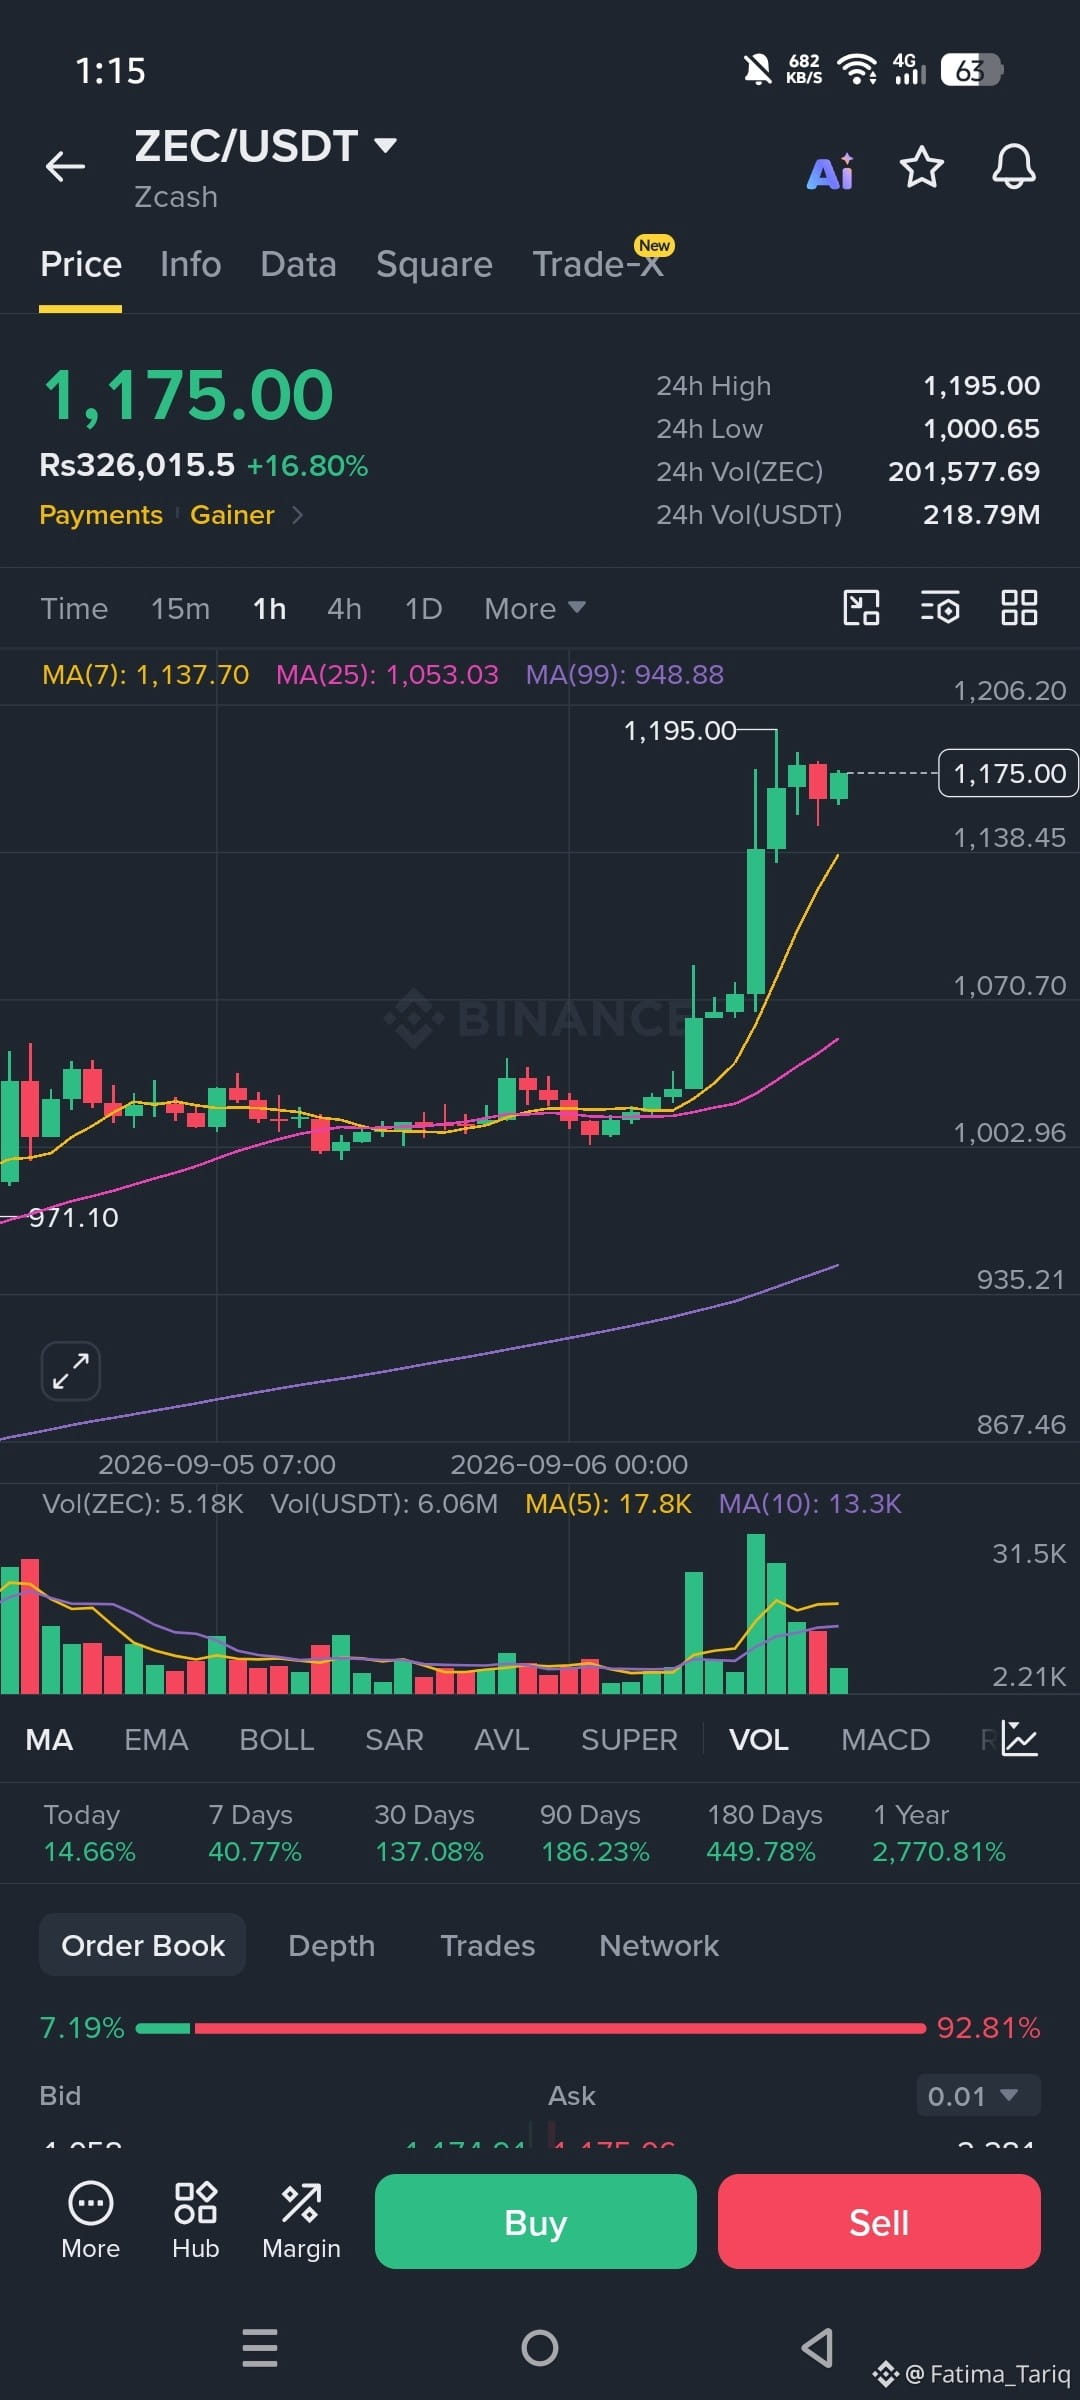
Quoted content has been removed
3
381
·
--
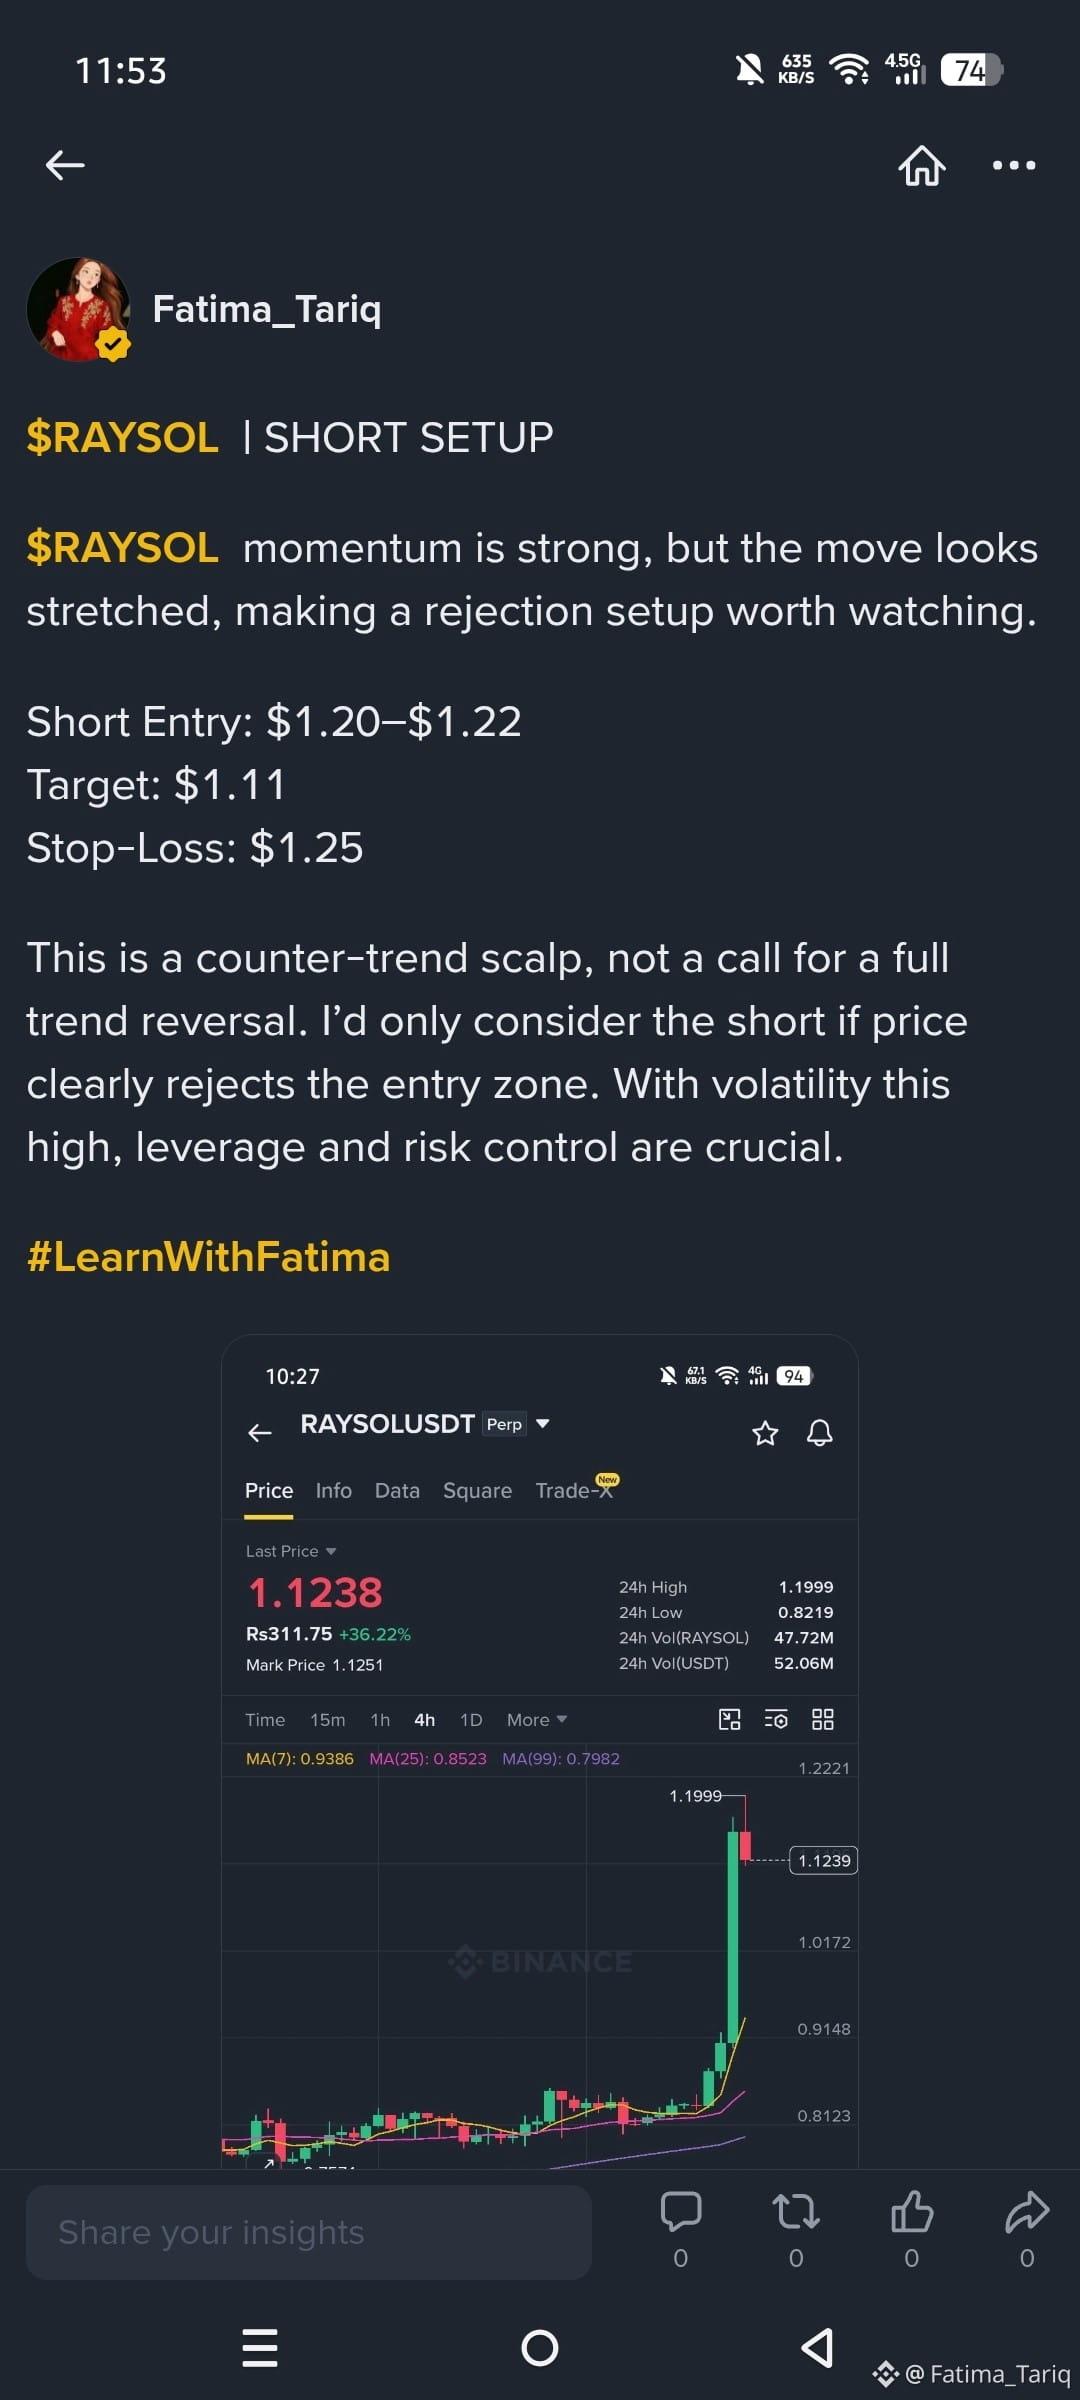
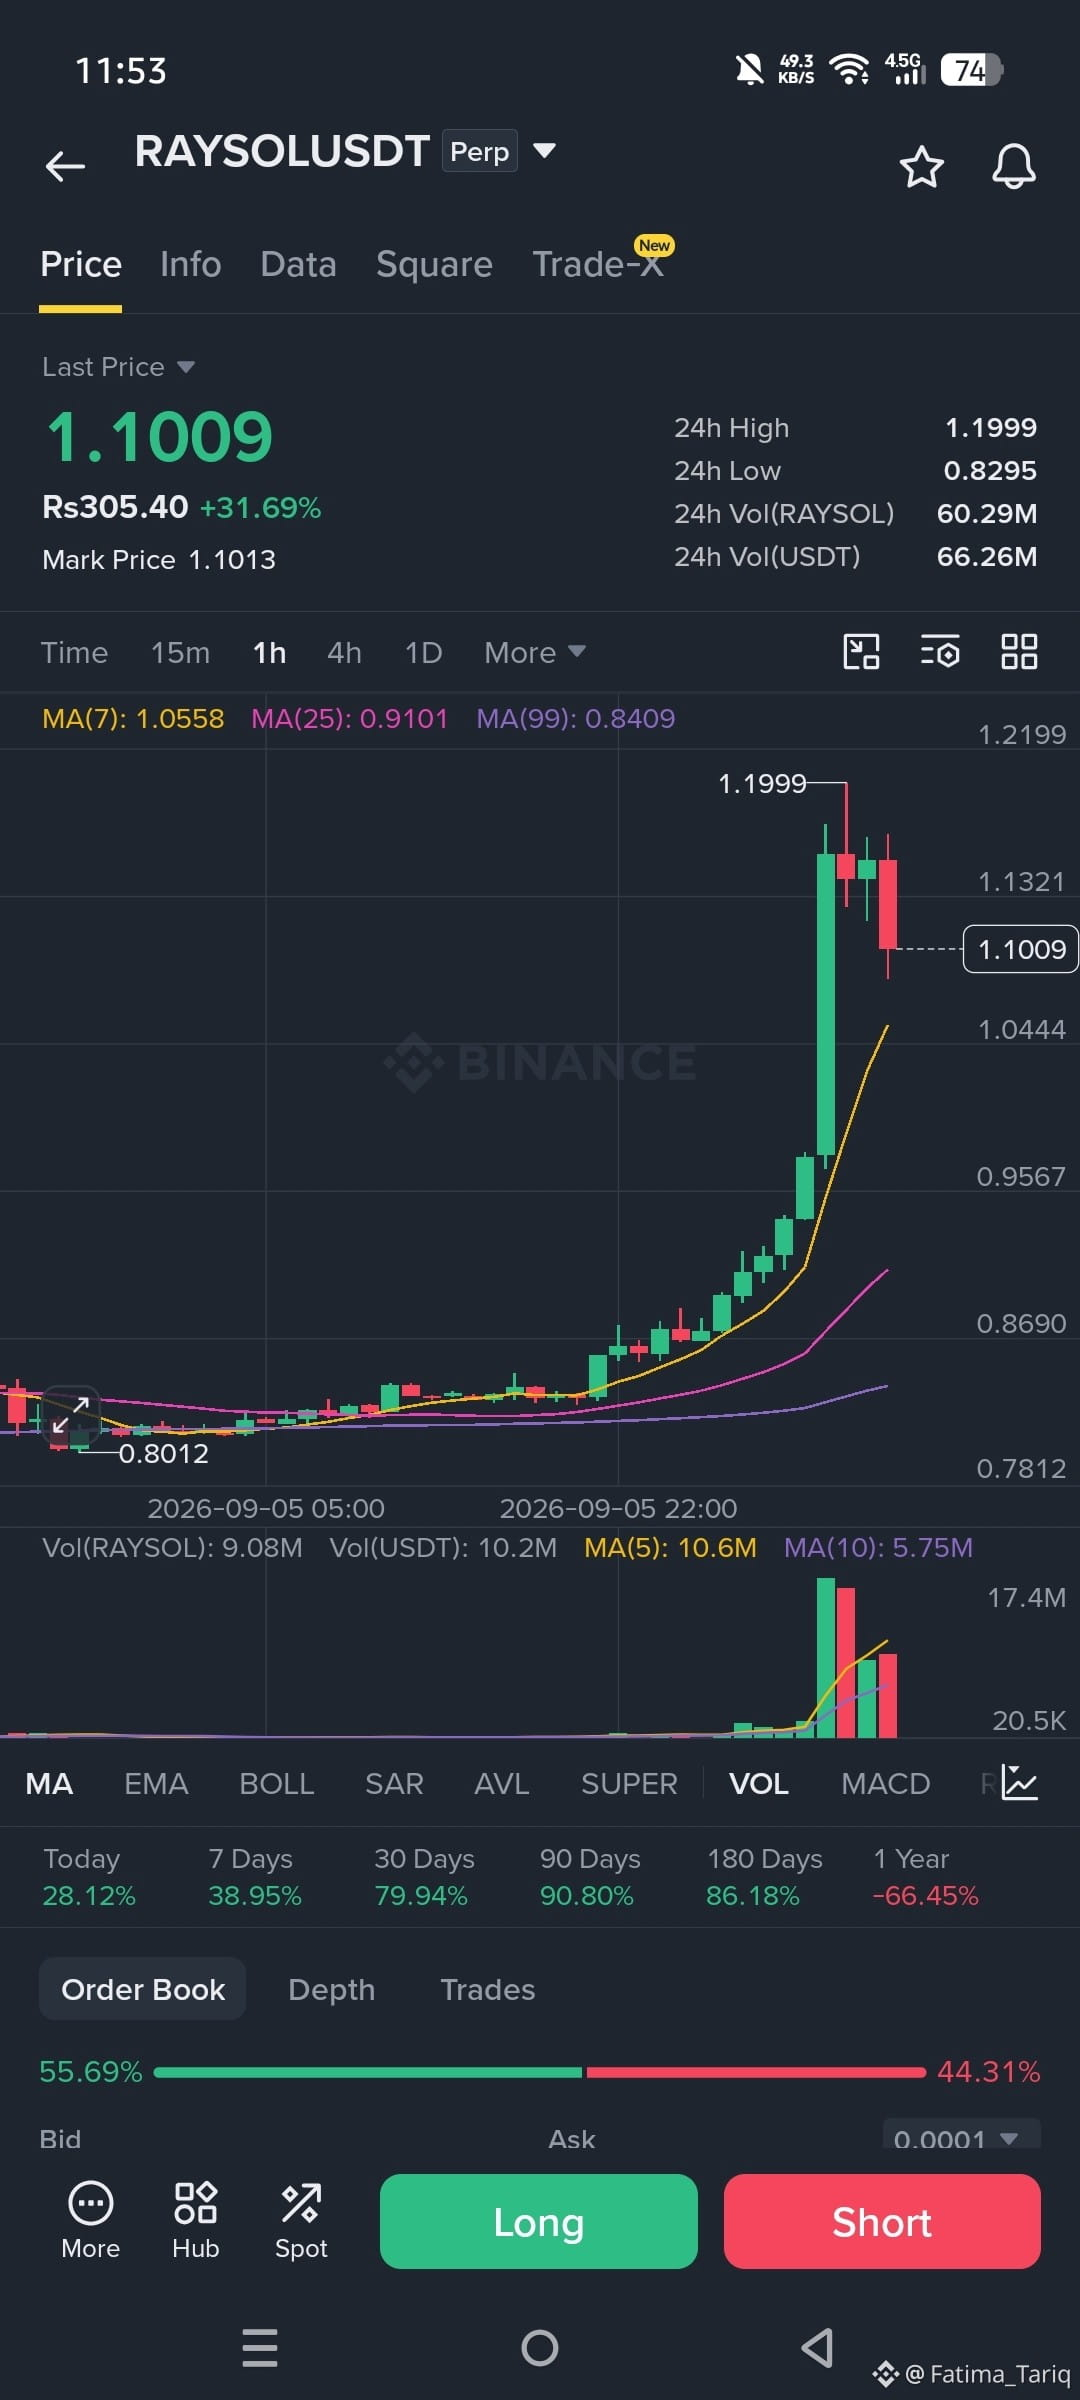
Fatima_Tariq
·
--
Bullish$RAYSOL | SHORT SETUP
$RAYSOL momentum is strong, but the move looks stretched, making a rejection setup worth watching.
Short Entry: $1.20–$1.22
Target: $1.11
Stop-Loss: $1.25
This is a counter-trend scalp, not a call for a full trend reversal. I’d only consider the short if price clearly rejects the entry zone. With volatility this high, leverage and risk control are crucial.
#LearnWithFatima
$RAYSOL momentum is strong, but the move looks stretched, making a rejection setup worth watching.
Short Entry: $1.20–$1.22
Target: $1.11
Stop-Loss: $1.25
This is a counter-trend scalp, not a call for a full trend reversal. I’d only consider the short if price clearly rejects the entry zone. With volatility this high, leverage and risk control are crucial.
#LearnWithFatima
3
280
·
--
Bullish
$RAYSOL | SHORT SETUP
$RAYSOL momentum is strong, but the move looks stretched, making a rejection setup worth watching.
Short Entry: $1.20–$1.22
Target: $1.11
Stop-Loss: $1.25
This is a counter-trend scalp, not a call for a full trend reversal. I’d only consider the short if price clearly rejects the entry zone. With volatility this high, leverage and risk control are crucial.
{future}(RAYSOLUSDT)
#LearnWithFatima
$RAYSOL | SHORT SETUP
$RAYSOL momentum is strong, but the move looks stretched, making a rejection setup worth watching.
Short Entry: $1.20–$1.22
Target: $1.11
Stop-Loss: $1.25
This is a counter-trend scalp, not a call for a full trend reversal. I’d only consider the short if price clearly rejects the entry zone. With volatility this high, leverage and risk control are crucial.
#LearnWithFatima
$RAYSOL momentum is strong, but the move looks stretched, making a rejection setup worth watching.
Short Entry: $1.20–$1.22
Target: $1.11
Stop-Loss: $1.25
This is a counter-trend scalp, not a call for a full trend reversal. I’d only consider the short if price clearly rejects the entry zone. With volatility this high, leverage and risk control are crucial.
#LearnWithFatima
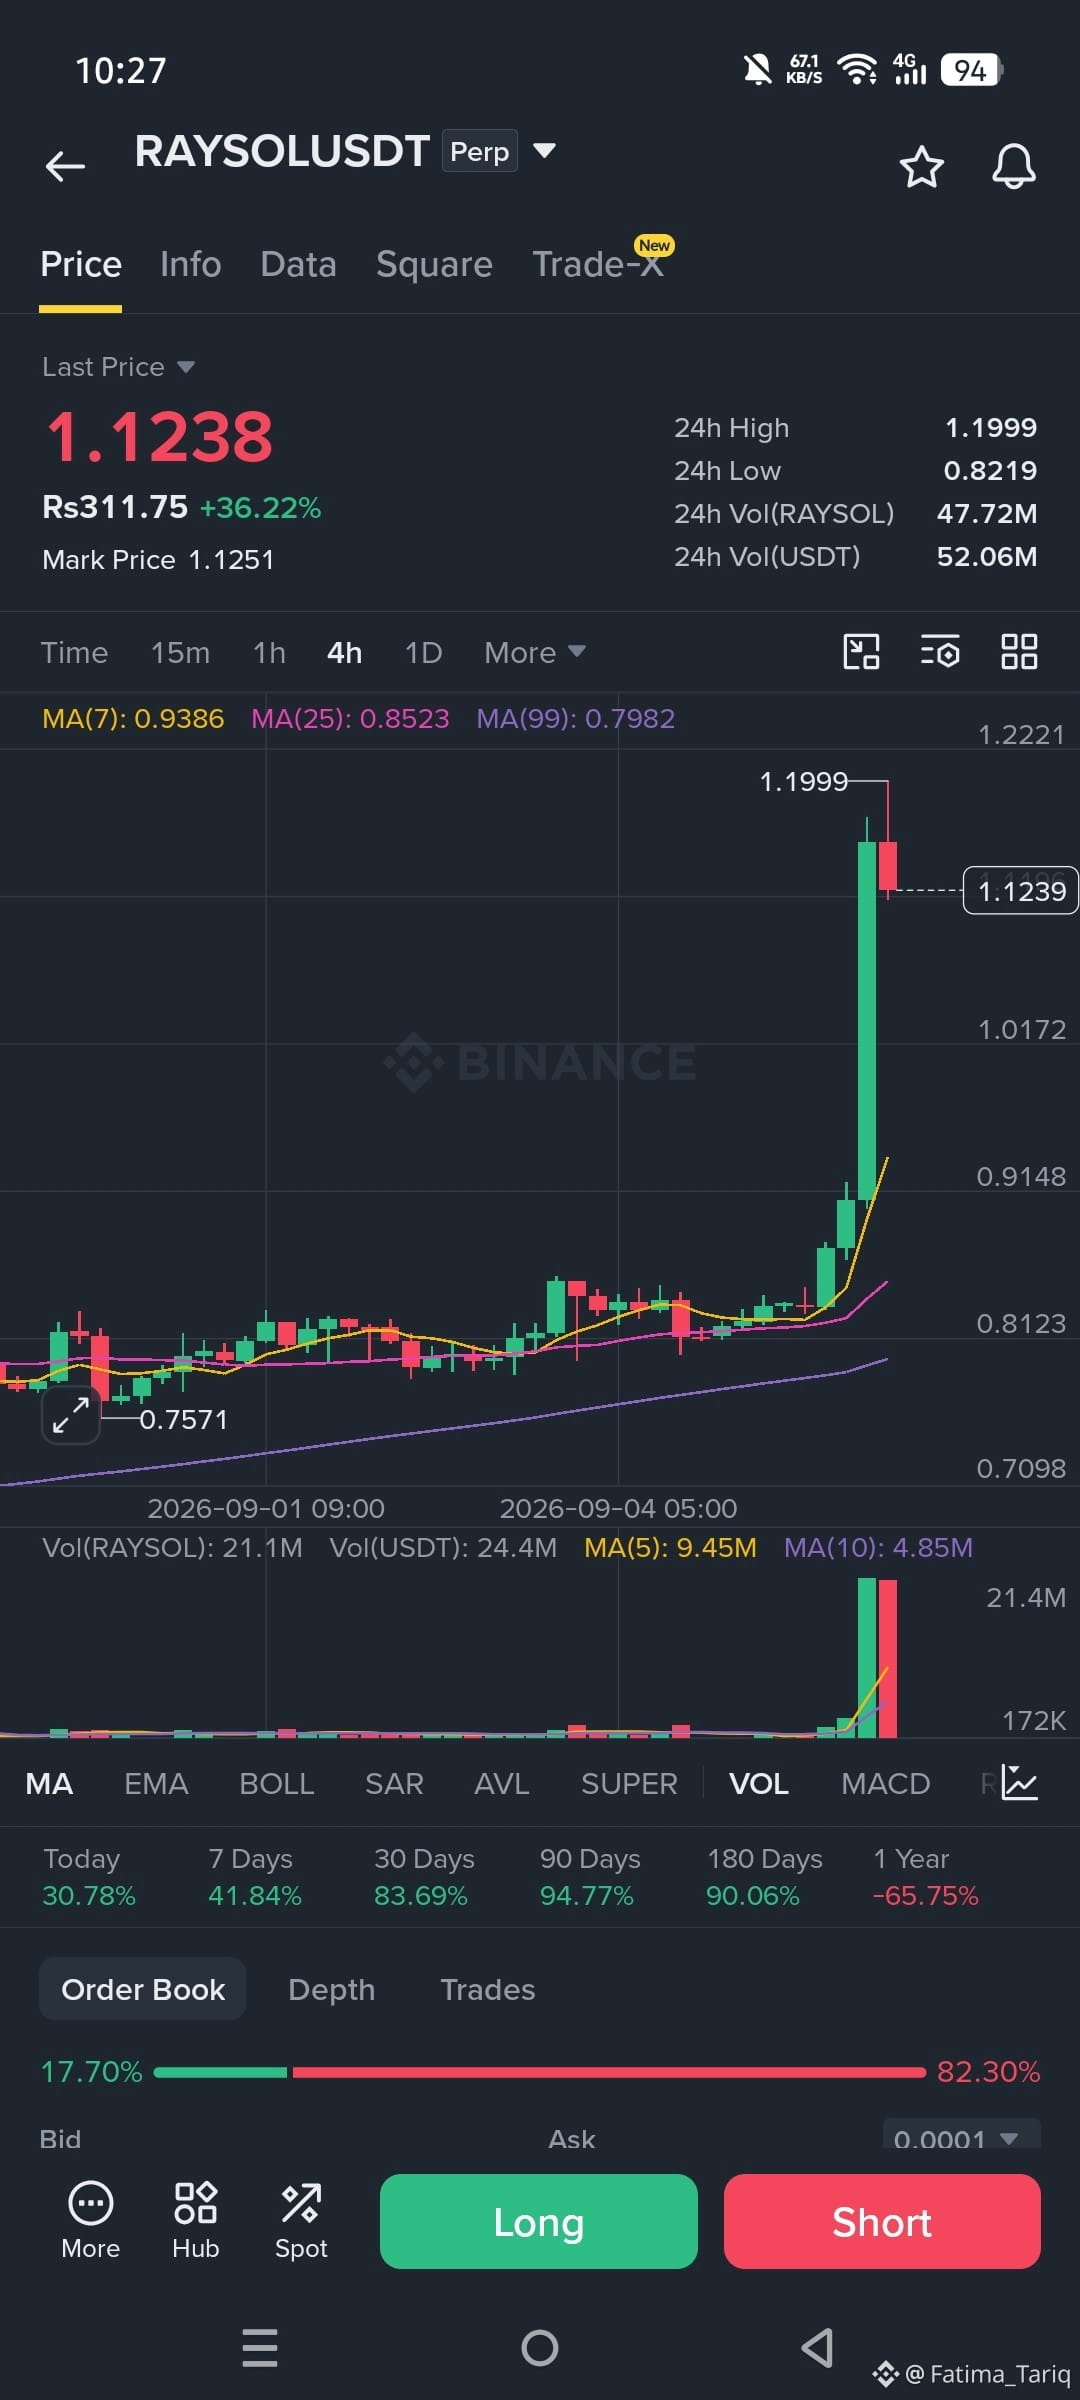
1
1
306

Fatima_Tariq
·
--
Bullish$BULLA TP 2 Hits 🎯🙀🎊
#LearnWithFatima
#LearnWithFatima
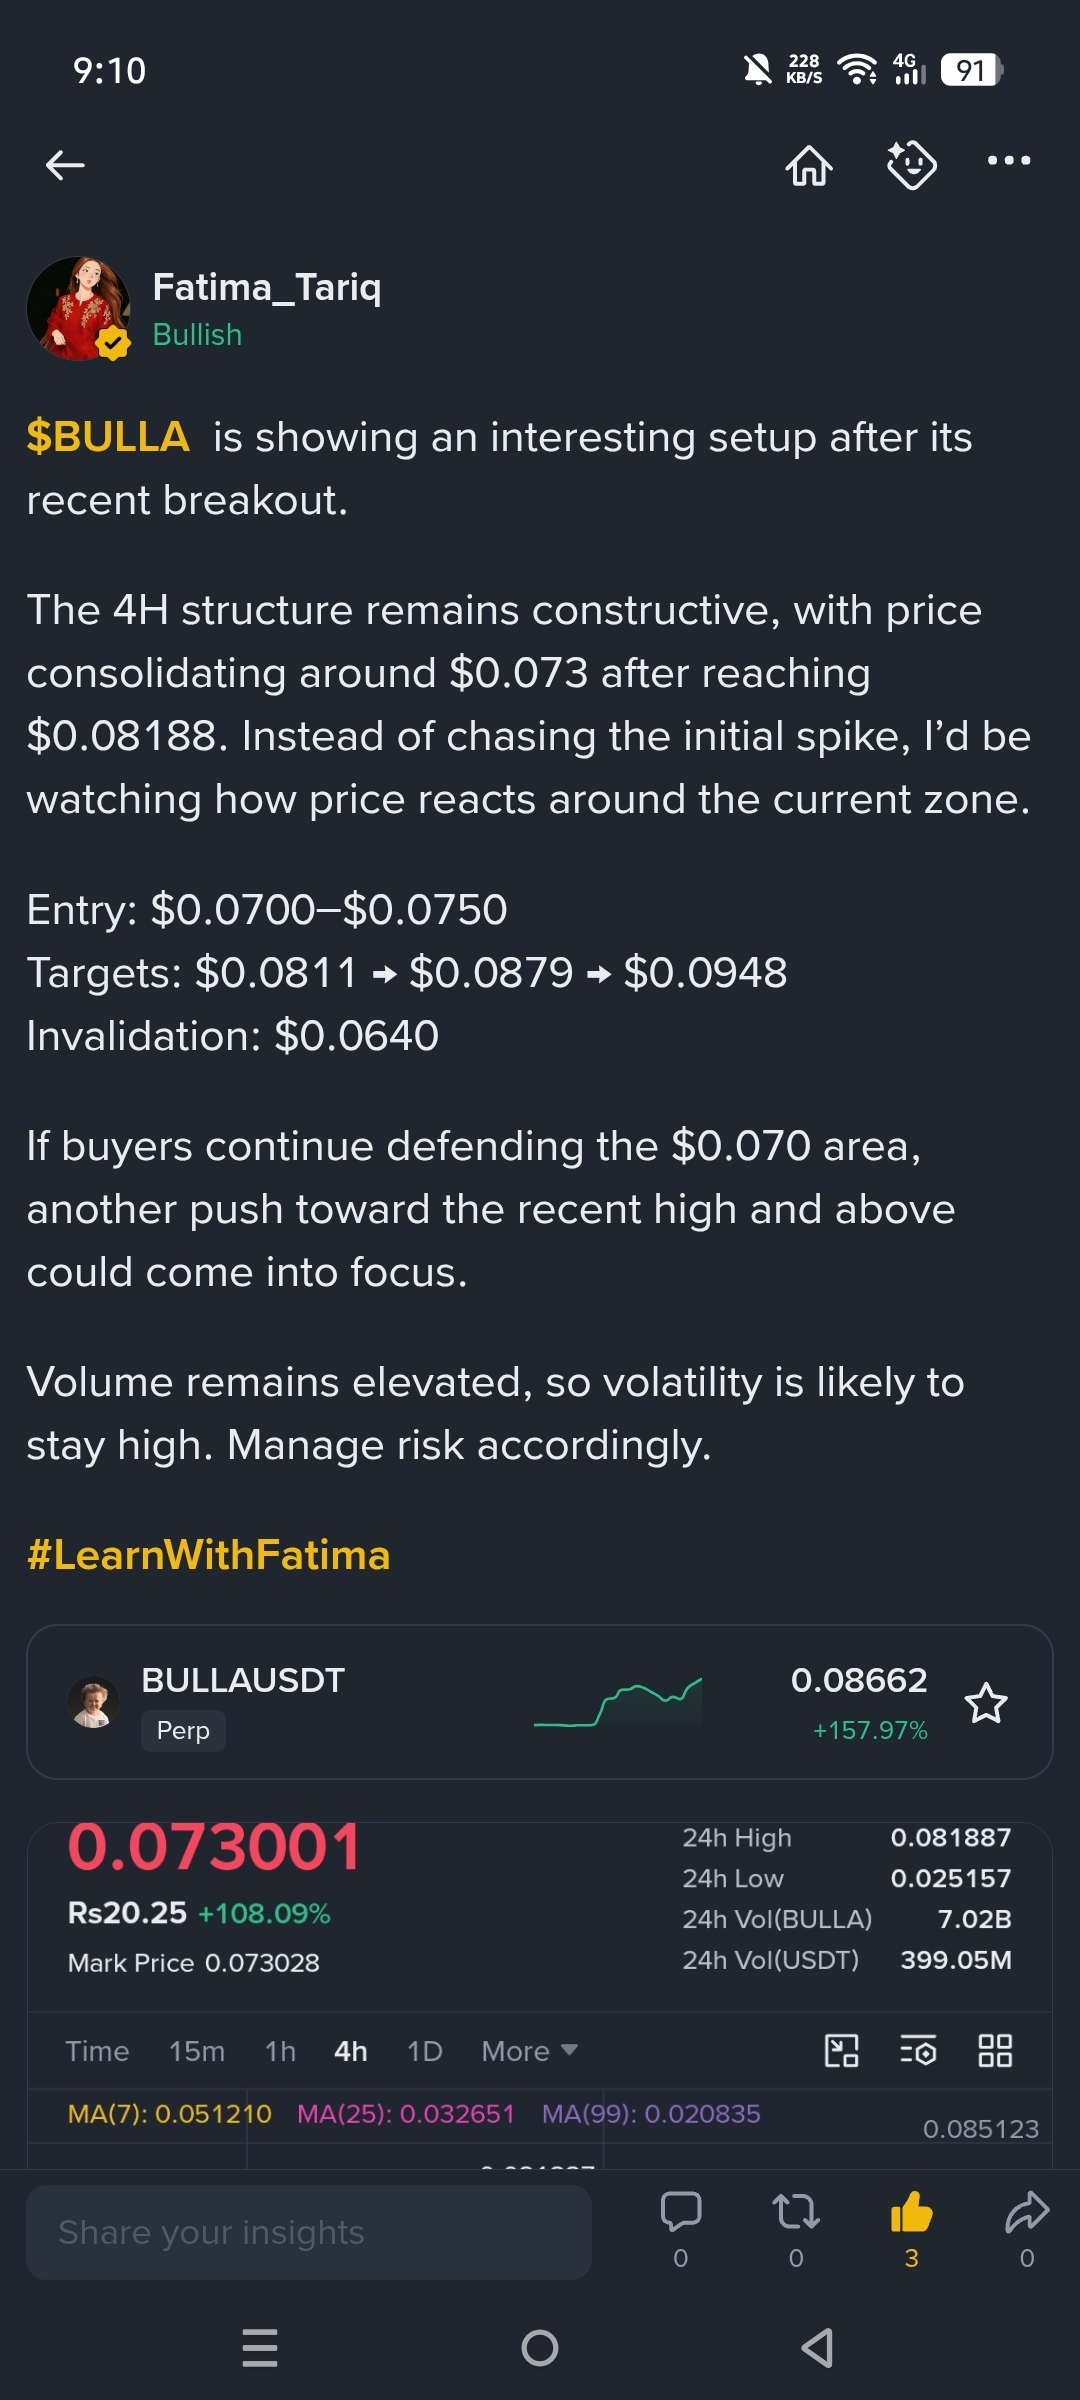
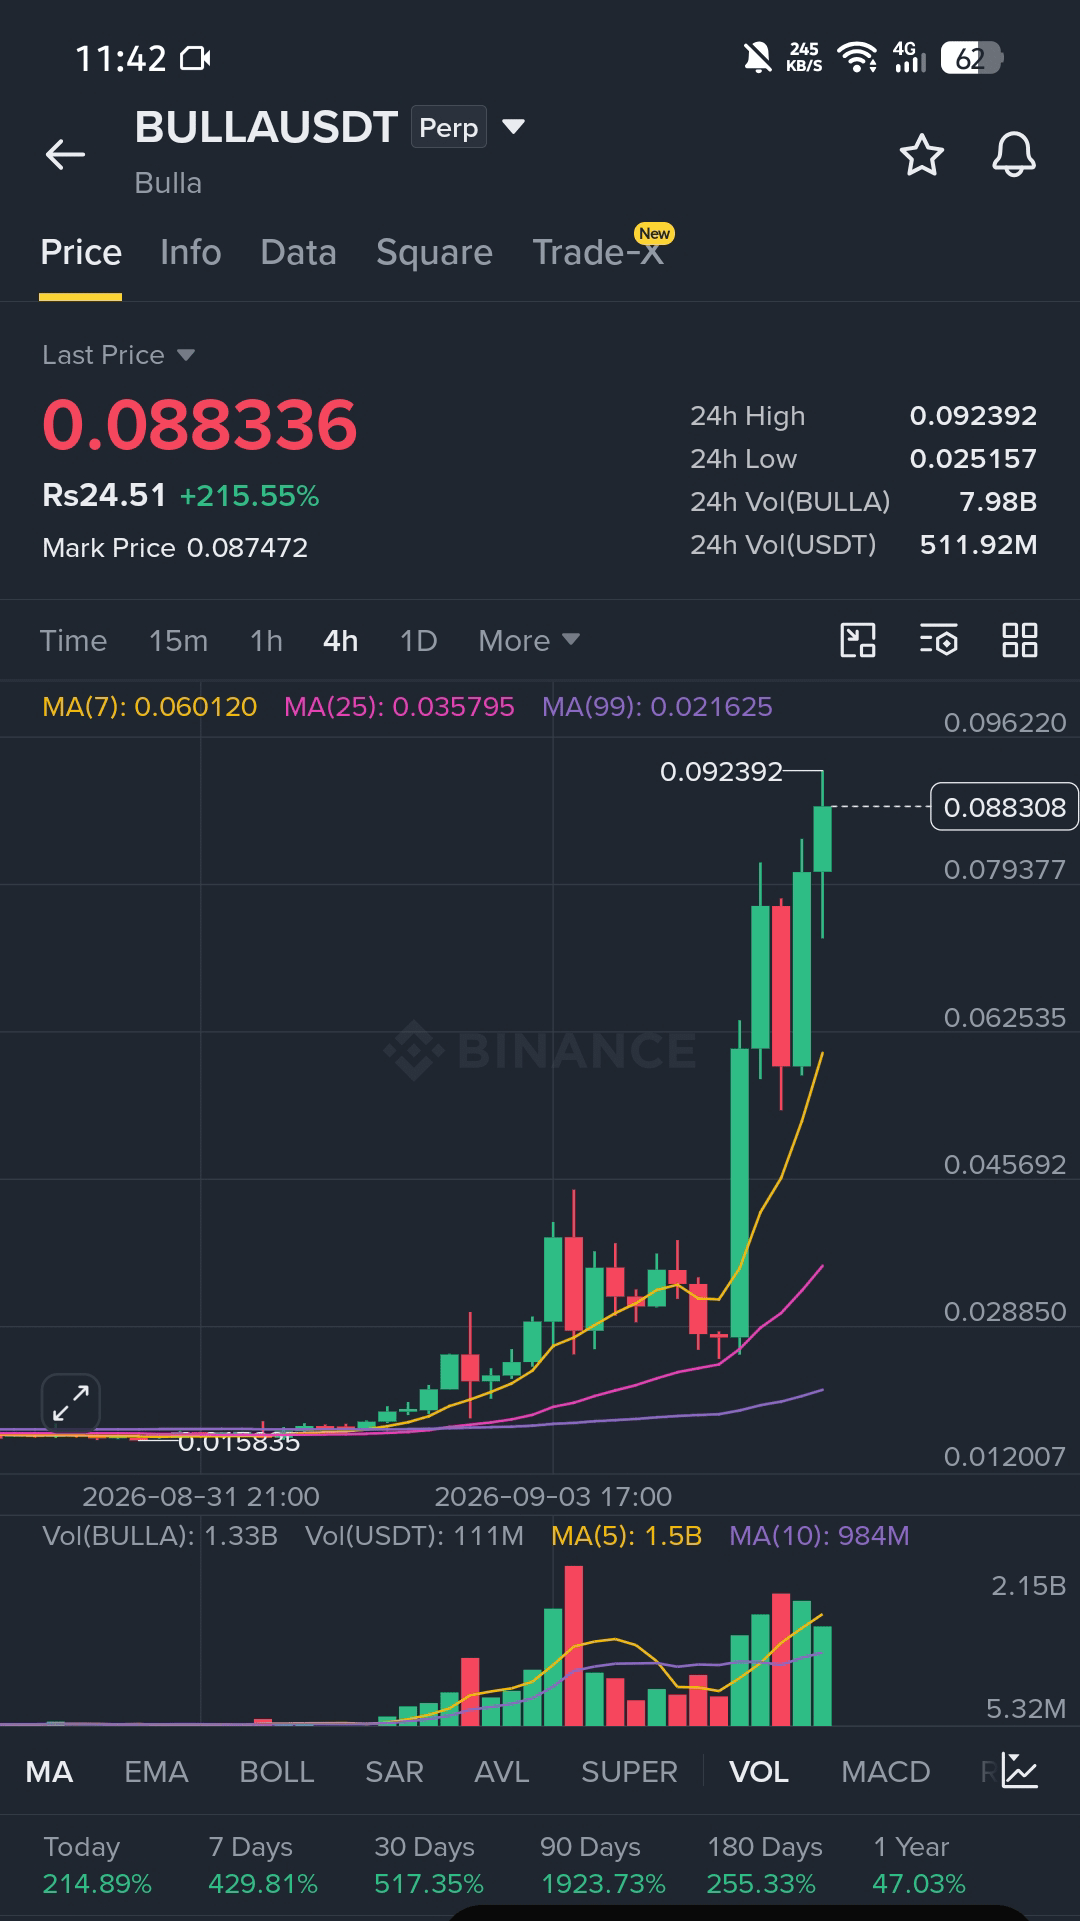
261
·
--
Bullish
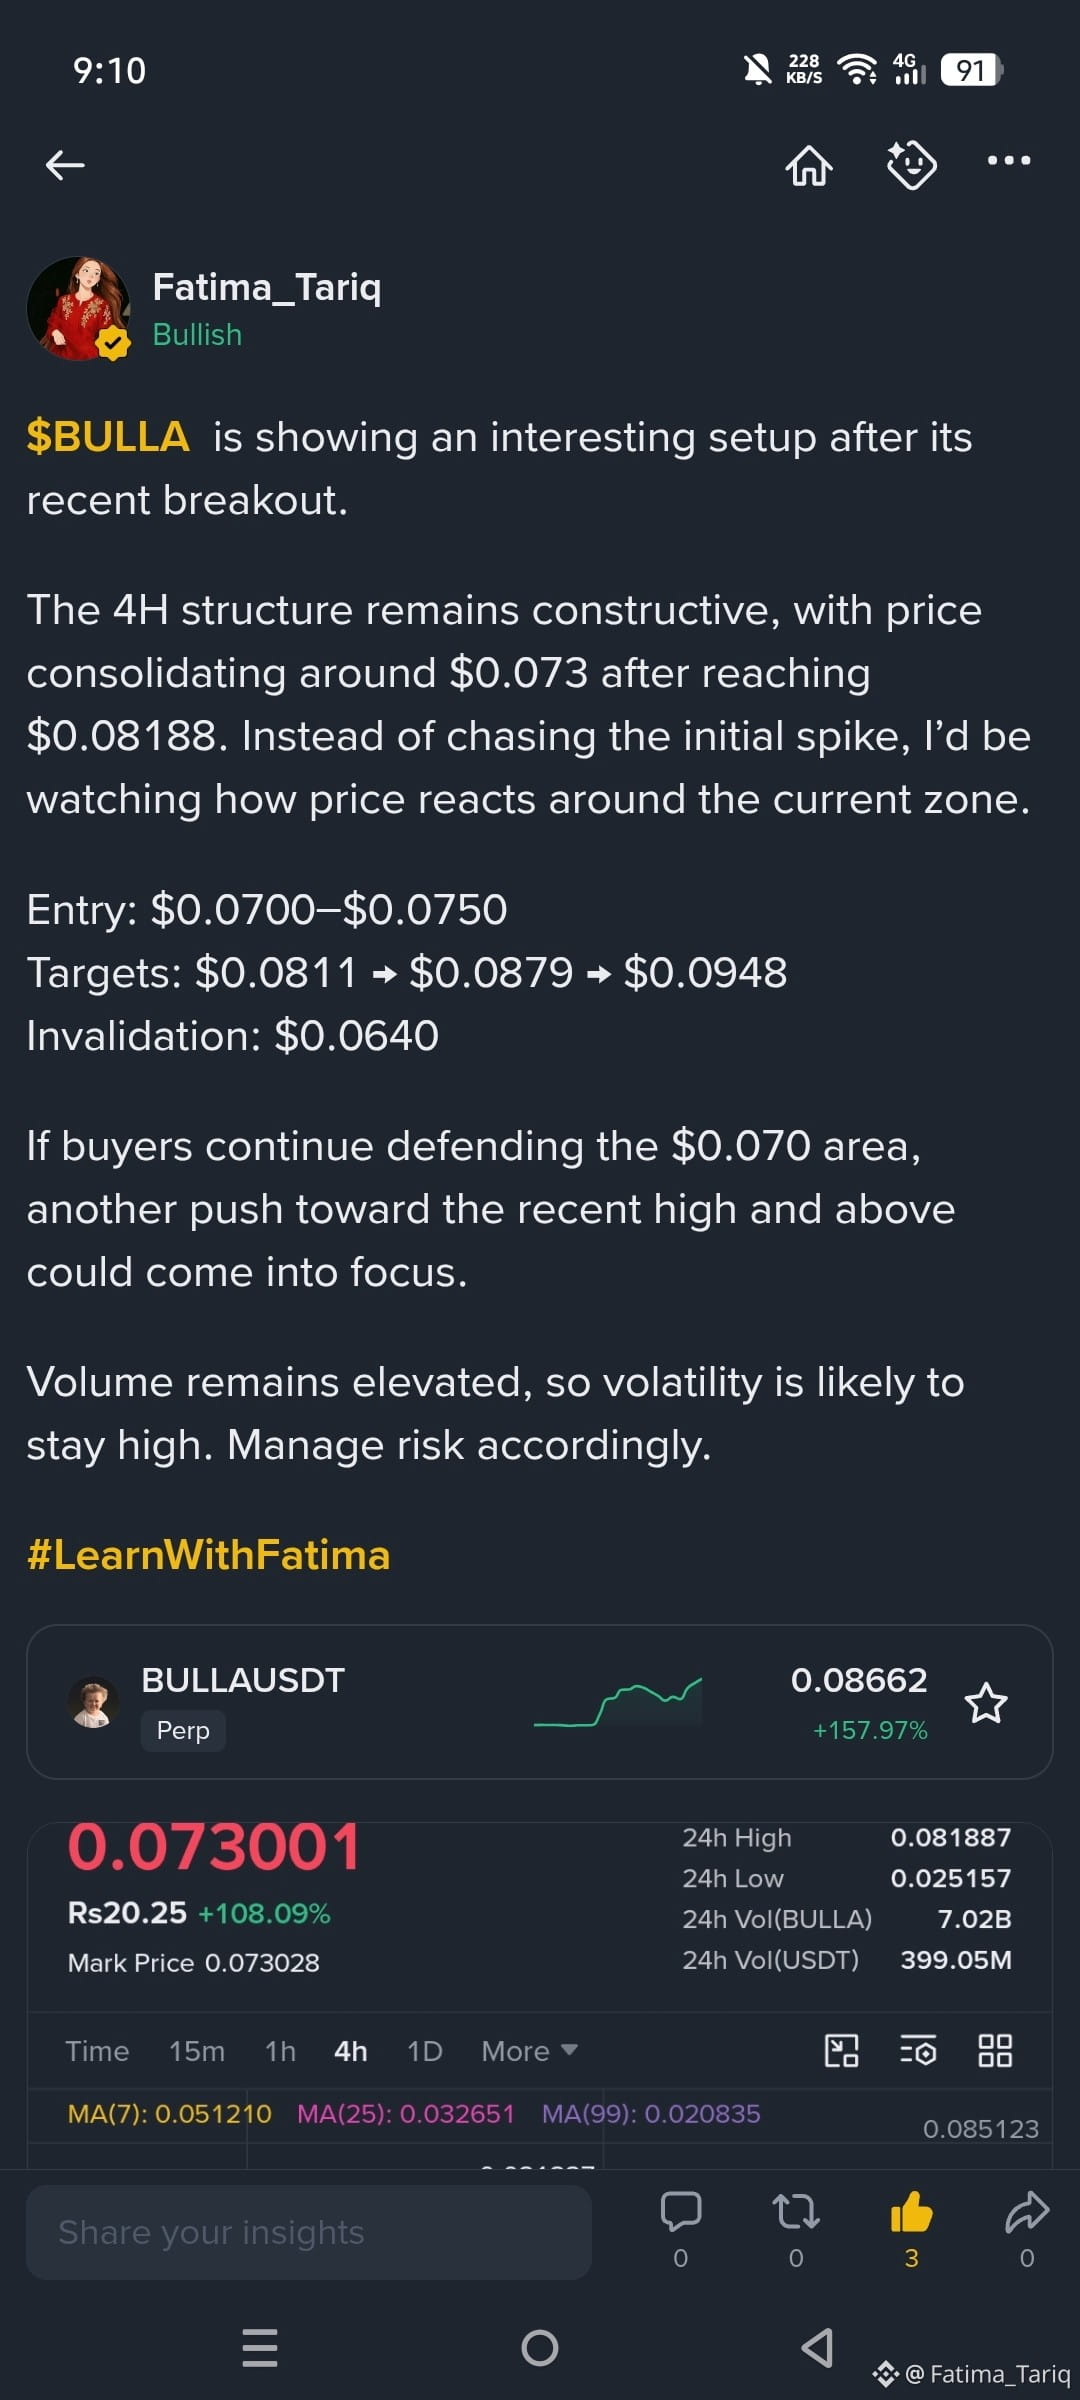
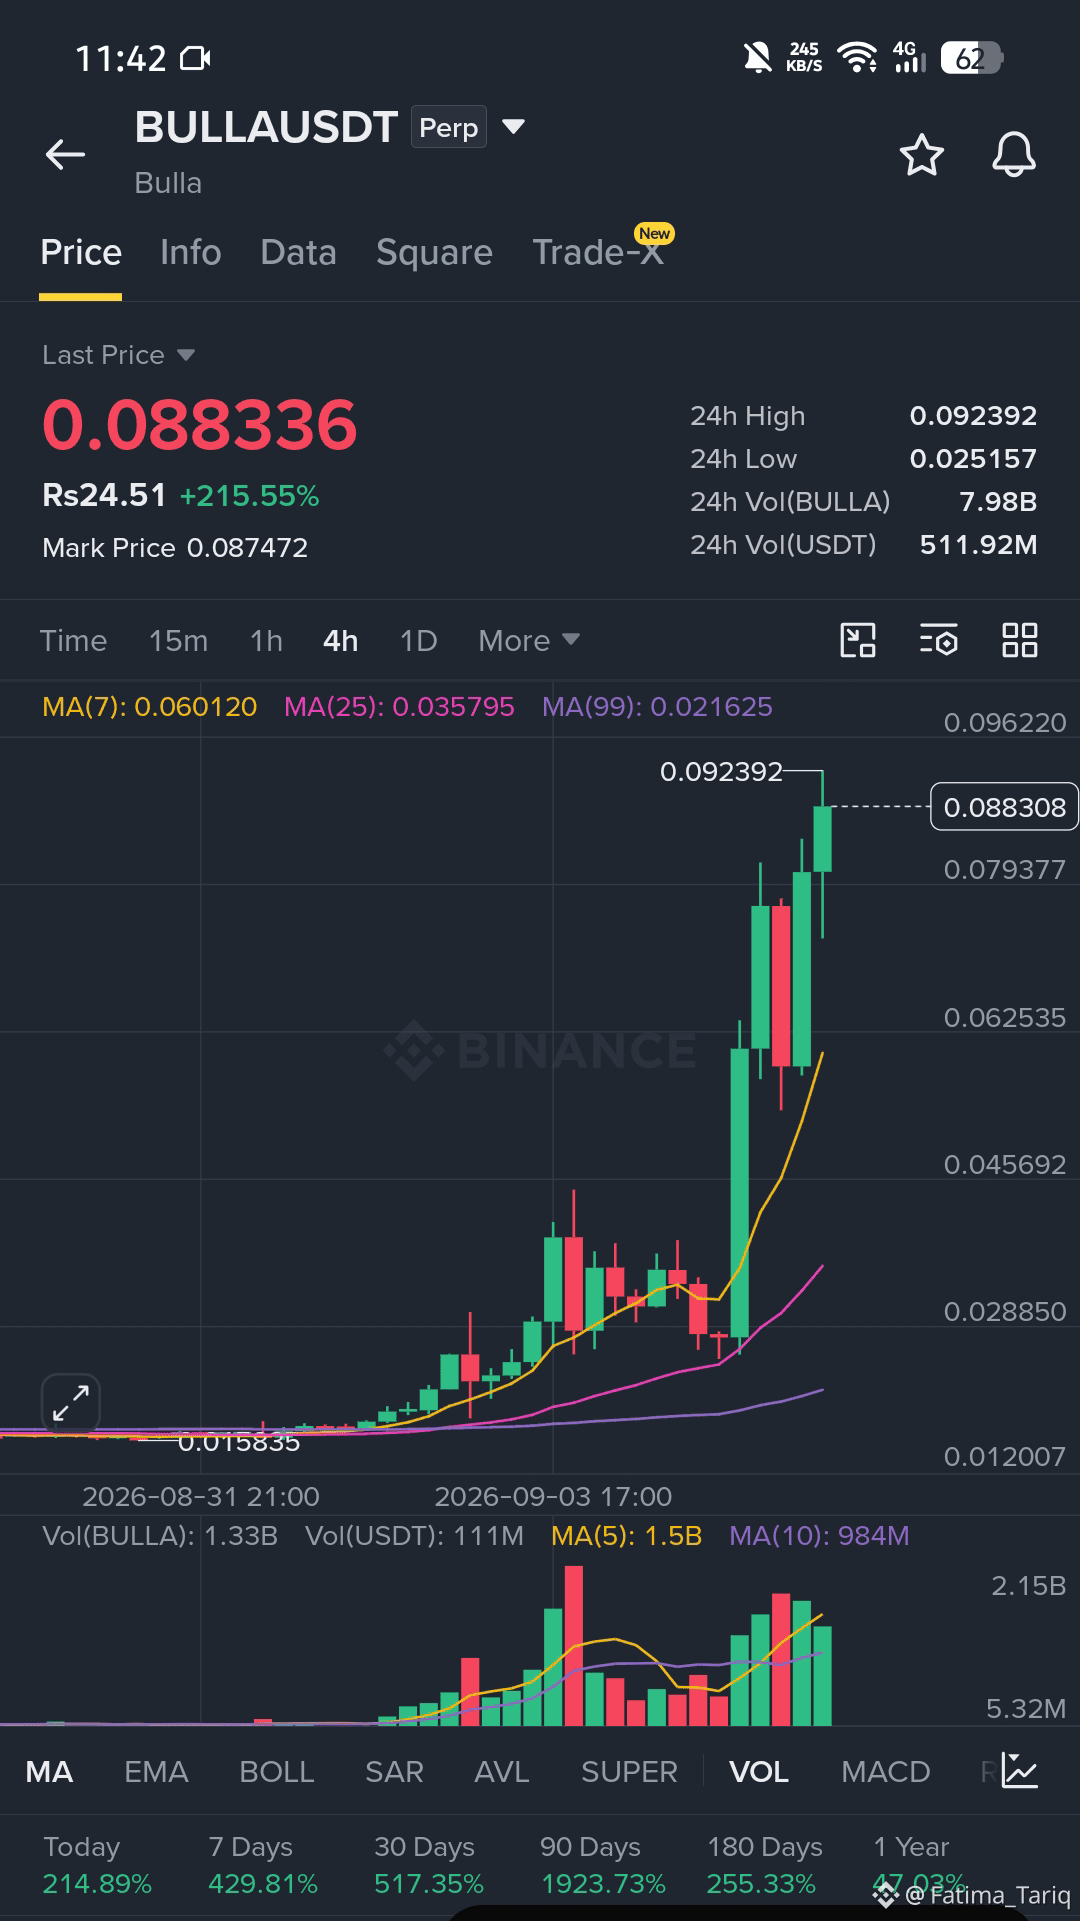
Fatima_Tariq
·
--
Bullish$BULLA is showing an interesting setup after its recent breakout.
The 4H structure remains constructive, with price consolidating around $0.073 after reaching $0.08188. Instead of chasing the initial spike, I’d be watching how price reacts around the current zone.
Entry: $0.0700–$0.0750
Targets: $0.0811 → $0.0879 → $0.0948
Invalidation: $0.0640
If buyers continue defending the $0.070 area, another push toward the recent high and above could come into focus.
Volume remains elevated, so volatility is likely to stay high. Manage risk accordingly.
#LearnWithFatima
The 4H structure remains constructive, with price consolidating around $0.073 after reaching $0.08188. Instead of chasing the initial spike, I’d be watching how price reacts around the current zone.
Entry: $0.0700–$0.0750
Targets: $0.0811 → $0.0879 → $0.0948
Invalidation: $0.0640
If buyers continue defending the $0.070 area, another push toward the recent high and above could come into focus.
Volume remains elevated, so volatility is likely to stay high. Manage risk accordingly.
#LearnWithFatima
1
6
878
·
--
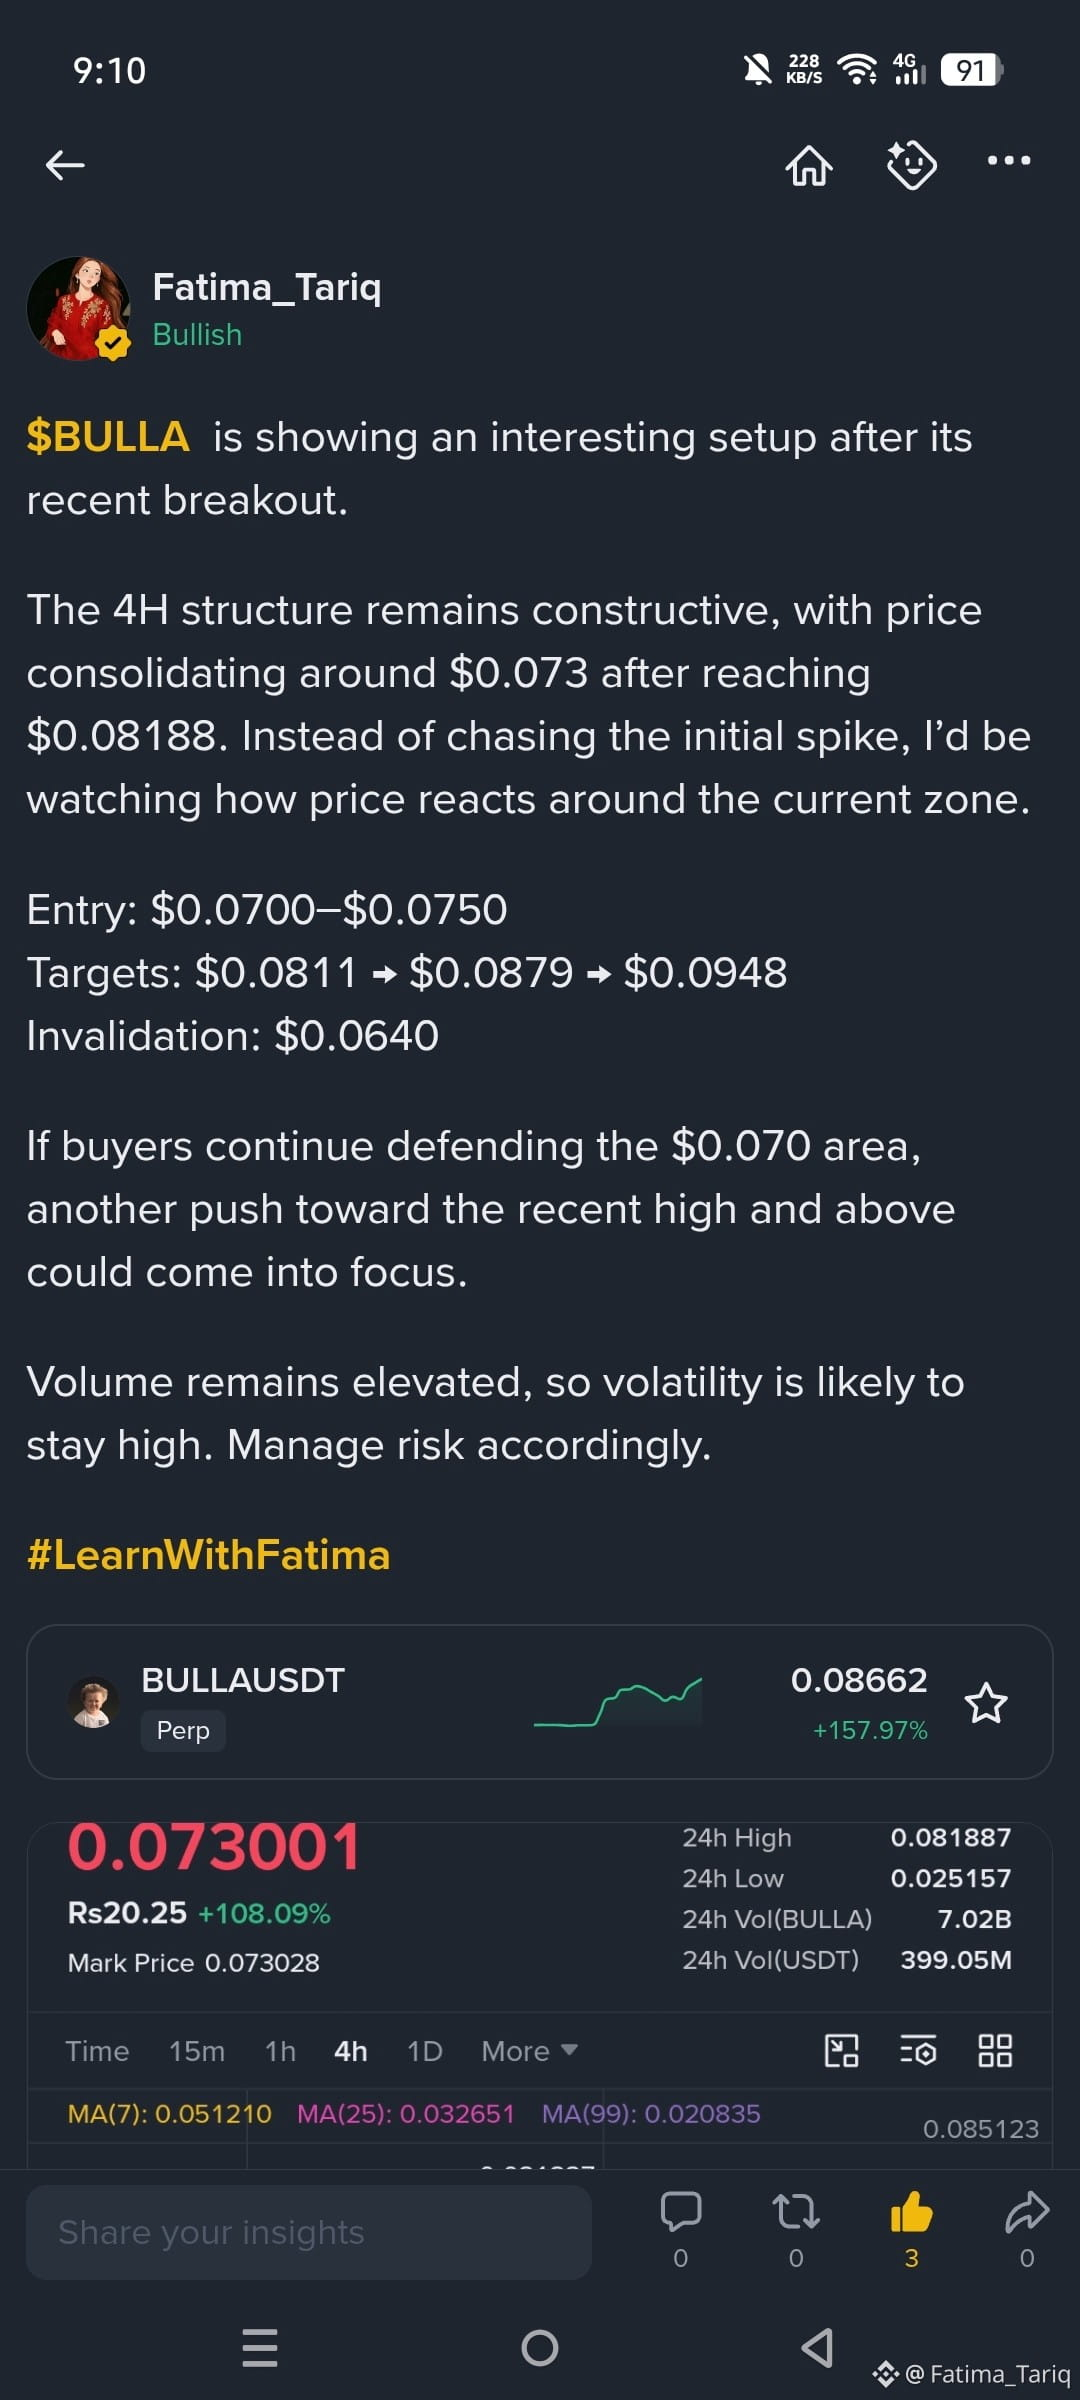
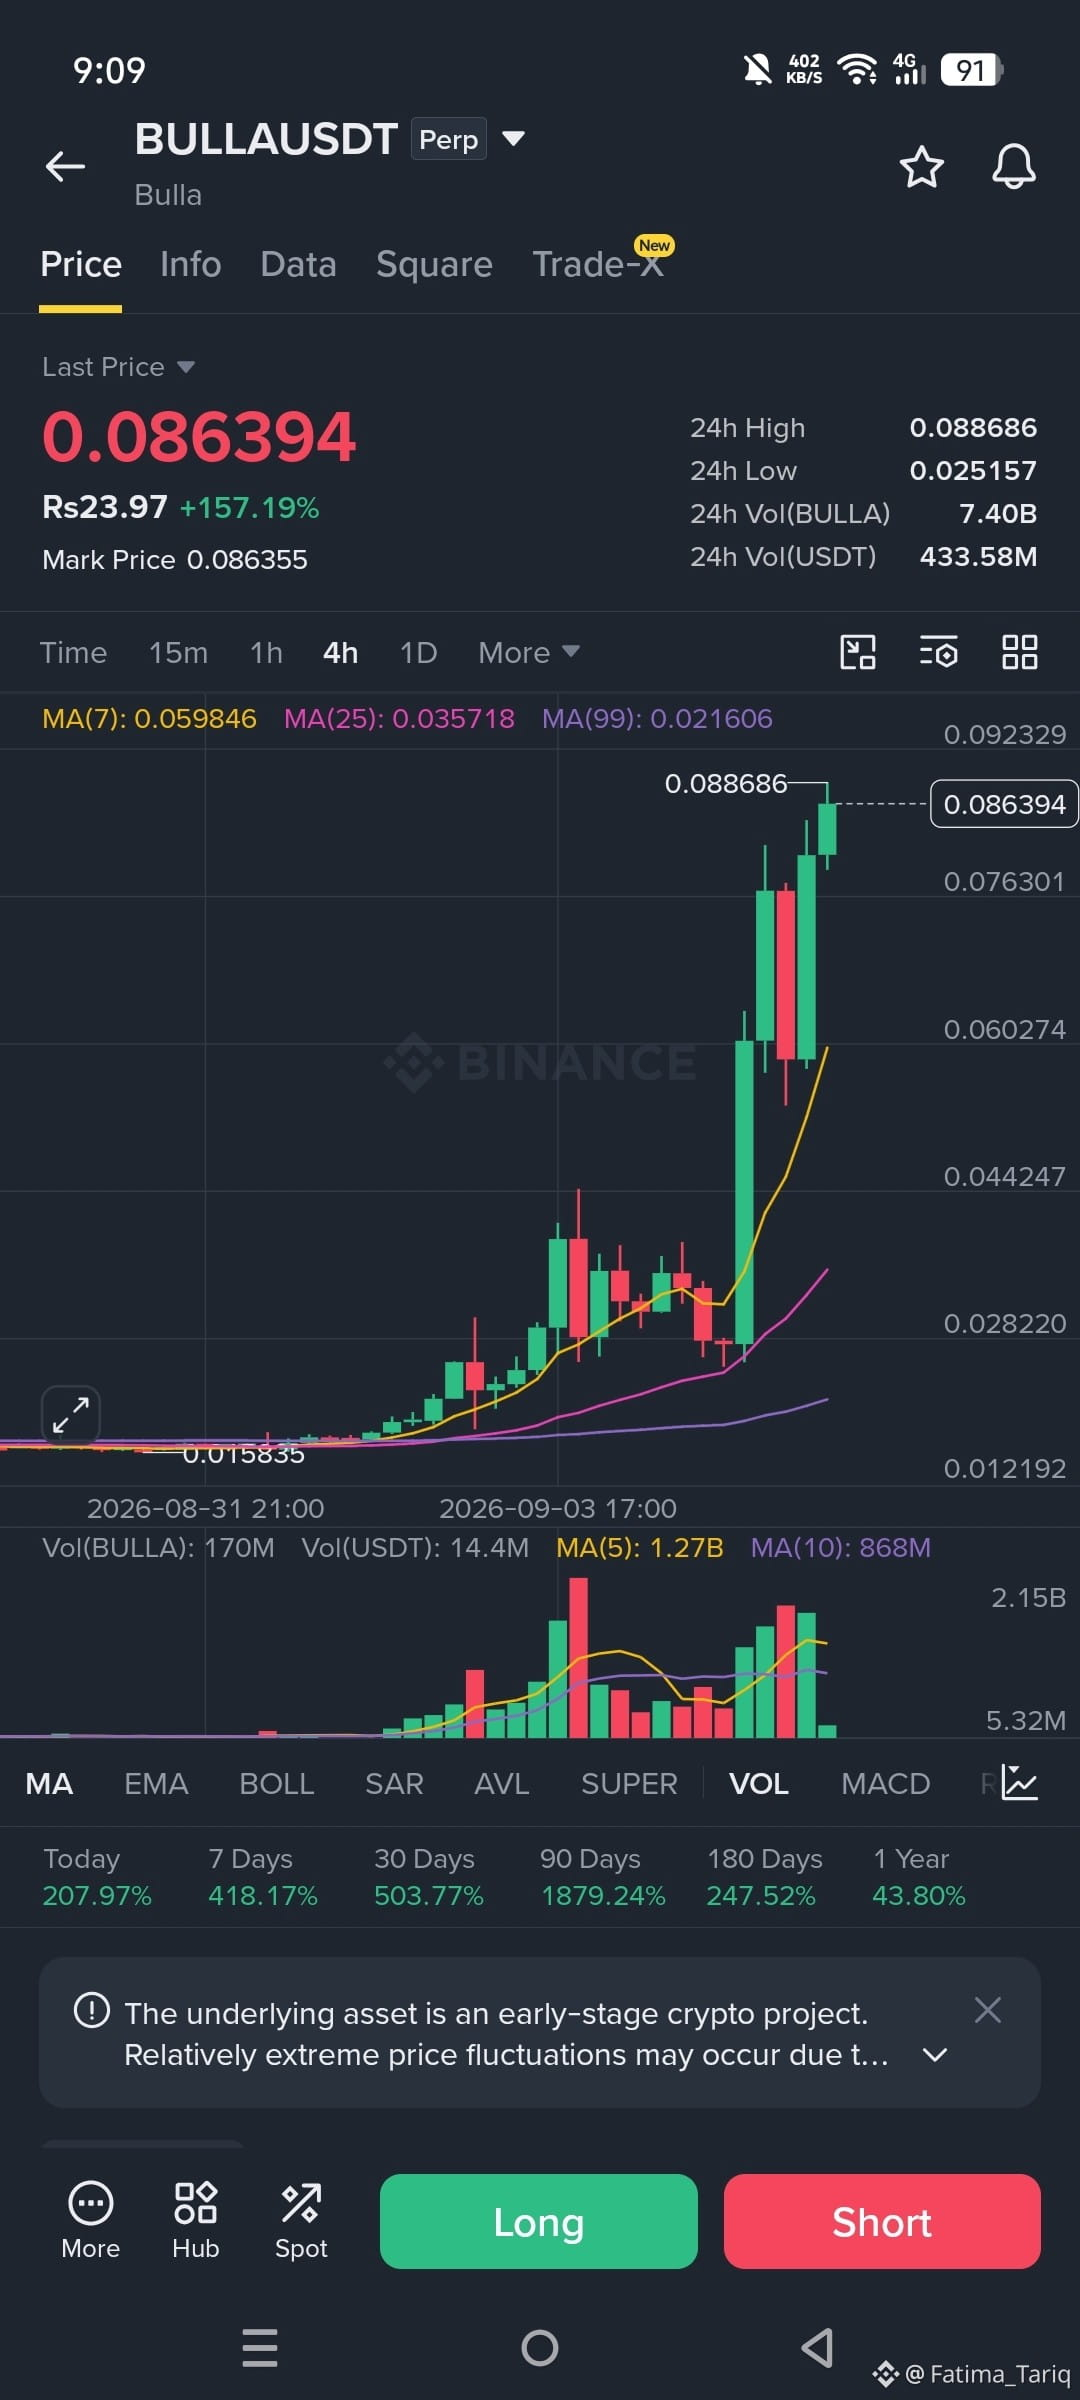
Fatima_Tariq
·
--
Bullish$BULLA is showing an interesting setup after its recent breakout.
The 4H structure remains constructive, with price consolidating around $0.073 after reaching $0.08188. Instead of chasing the initial spike, I’d be watching how price reacts around the current zone.
Entry: $0.0700–$0.0750
Targets: $0.0811 → $0.0879 → $0.0948
Invalidation: $0.0640
If buyers continue defending the $0.070 area, another push toward the recent high and above could come into focus.
Volume remains elevated, so volatility is likely to stay high. Manage risk accordingly.
#LearnWithFatima
The 4H structure remains constructive, with price consolidating around $0.073 after reaching $0.08188. Instead of chasing the initial spike, I’d be watching how price reacts around the current zone.
Entry: $0.0700–$0.0750
Targets: $0.0811 → $0.0879 → $0.0948
Invalidation: $0.0640
If buyers continue defending the $0.070 area, another push toward the recent high and above could come into focus.
Volume remains elevated, so volatility is likely to stay high. Manage risk accordingly.
#LearnWithFatima
3
727
Log in to explore more content
Join global crypto users on Binance Square
⚡️ Get latest and useful information about crypto.
💬 Trusted by the world’s largest crypto exchange.
👍 Discover real insights from verified creators.
Email / Phone number
Trending Topics
1
#AIStocksWhatNext
676,891 views
5,027 Discussing
2
#21SharesLaunchesEuropesFirstZcashETP
14,862 views
514 Discussing
3
#CardanoJoinsX402PaymentStandard
10,700 views
394 Discussing
4
#BitcoinTops$87KAtEightMonthHigh
8,178 views
89 Discussing
5
#ZECBreaksAbove$1600AtRecordHigh
4,658 views
73 Discussing
6
#BitwiseNEARStakingETPAssetsTop$100M
30,955 views
85 Discussing
7
#BitcoinBreaksAboveMayHighNears$86K
28,792 views
263 Discussing
8
#DogecoinRises15%
108,273 views
1,793 Discussing
9
#$14BBitcoinOptionsExpireFriday
8,110 views
110 Discussing
10
#BNBMarketCapPassesBNYMellon
68,959 views
1,473 Discussing