
#ltcpriceprediction
ltcpriceprediction
639,054 views
953 Discussing
Hot
Latest

·
--
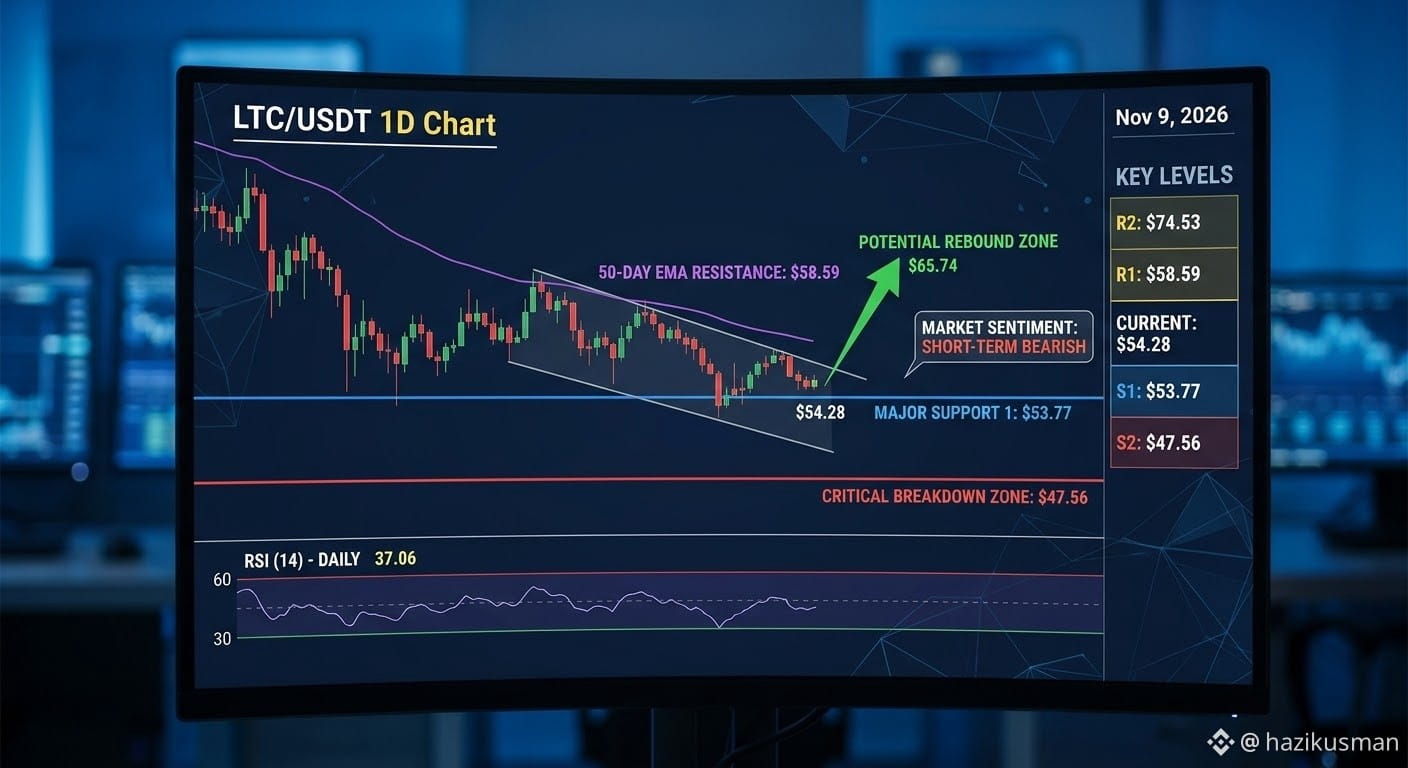
$LTC is navigating a challenging technical landscape, characterized by a short-term bearish trend. After experiencing a significant correction through late summer and early autumn, the price is currently consolidated near a multi-month demand zone around $53.77.
Market Outlook: Sellers Retain Control
The immediate technical setup favors the bears, as LTC is trading strictly below its flattening 50-day and 200-day Exponential Moving Averages (EMAs).
Crucial Defense Zone: A breakout below the $53.77 support line would invalidate the current base case and could trigger a liquidation event, targeting the next macro support around $47.56.
Bulls’ Roadblock: The $58.59 level (the current position of the downward-sloping 50-day EMA) serves as initial strong resistance. The trend will only pivot constructively on a decisive daily candle close above $65.74, which would reclaim key structural liquidity.
Neutral Momentum Indicators: While the primary trend is down, short-term indicators such as the daily Relative Strength Index (RSI) are hovering near 37.06, signaling neutral-to-bearish momentum. It is not yet oversold, indicating that further downside capacity remains
The infographic below captures the key technical dynamics discussed. It visualizes the current descending channel, highlighting how the price is testing the major demand zone at $53.77. It distinctly maps the primary barriers (50-EMA) and the multi-month support areas that frame the current market bias.
#AIChipSlumpNasdaq #earn_crypto #Earncommissions #LTCPricePrediction
$LTC is navigating a challenging technical landscape, characterized by a short-term bearish trend. After experiencing a significant correction through late summer and early autumn, the price is currently consolidated near a multi-month demand zone around $53.77.
Market Outlook: Sellers Retain Control
The immediate technical setup favors the bears, as LTC is trading strictly below its flattening 50-day and 200-day Exponential Moving Averages (EMAs).
Crucial Defense Zone: A breakout below the $53.77 support line would invalidate the current base case and could trigger a liquidation event, targeting the next macro support around $47.56.
Bulls’ Roadblock: The $58.59 level (the current position of the downward-sloping 50-day EMA) serves as initial strong resistance. The trend will only pivot constructively on a decisive daily candle close above $65.74, which would reclaim key structural liquidity.
Neutral Momentum Indicators: While the primary trend is down, short-term indicators such as the daily Relative Strength Index (RSI) are hovering near 37.06, signaling neutral-to-bearish momentum. It is not yet oversold, indicating that further downside capacity remains
The infographic below captures the key technical dynamics discussed. It visualizes the current descending channel, highlighting how the price is testing the major demand zone at $53.77. It distinctly maps the primary barriers (50-EMA) and the multi-month support areas that frame the current market bias.
#AIChipSlumpNasdaq #earn_crypto #Earncommissions #LTCPricePrediction
Market Outlook: Sellers Retain Control
The immediate technical setup favors the bears, as LTC is trading strictly below its flattening 50-day and 200-day Exponential Moving Averages (EMAs).
Crucial Defense Zone: A breakout below the $53.77 support line would invalidate the current base case and could trigger a liquidation event, targeting the next macro support around $47.56.
Bulls’ Roadblock: The $58.59 level (the current position of the downward-sloping 50-day EMA) serves as initial strong resistance. The trend will only pivot constructively on a decisive daily candle close above $65.74, which would reclaim key structural liquidity.
Neutral Momentum Indicators: While the primary trend is down, short-term indicators such as the daily Relative Strength Index (RSI) are hovering near 37.06, signaling neutral-to-bearish momentum. It is not yet oversold, indicating that further downside capacity remains
The infographic below captures the key technical dynamics discussed. It visualizes the current descending channel, highlighting how the price is testing the major demand zone at $53.77. It distinctly maps the primary barriers (50-EMA) and the multi-month support areas that frame the current market bias.
#AIChipSlumpNasdaq #earn_crypto #Earncommissions #LTCPricePrediction
41

Article
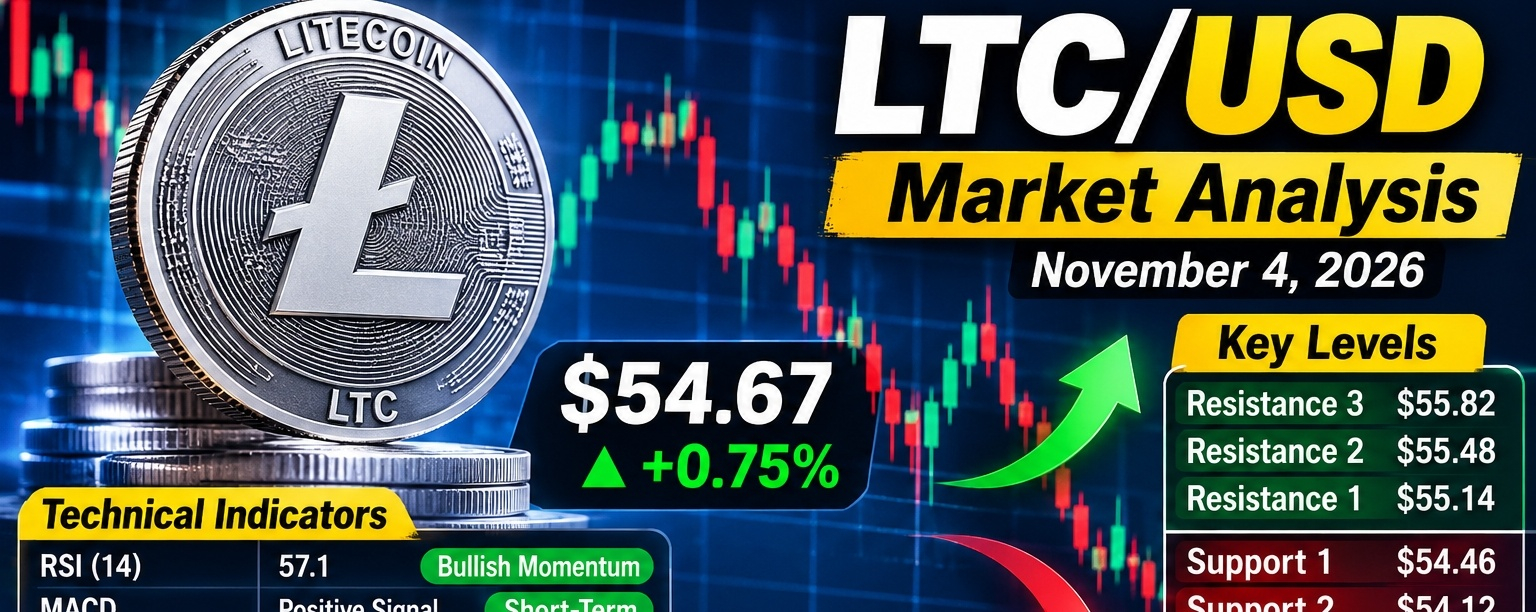
LTC/USD Analysis — November 4, 2026$LTC /USD Analysis — November 4, 2026
Market: Litecoin ($LTC ) / US Dollar (USD)
{spot}(LTCUSDT)

### $54.67
+0.75% daily
Latest reported market price OHLCX Markets +1
### 1\. Market overview
Litecoin is showing a short-term recovery attempt, but the broader daily trend remains weak. Technical indicators are giving mixed signals: shorter-term momentum has improved, while the daily trend still favors sellers. OHLCX Markets +1
* Short-term trend: Mildly bullish recovery
* Daily trend: Bearish
* Momentum: Mixed, with a possible relief bounce
* Trading risk: Elevated volatility
### 2\. Key support and resistance levels
Based on the latest available technical readings around the $54–$55 area: OHLCX Markets +1
| Level | Price (USD) | Significance |
| ------------ | ----------- | -------------------------- |
| Resistance 3 | $55.82 | Higher breakout zone |
| Resistance 2 | $55.48 | Bullish continuation level |
| Resistance 1 | $55.14 | First resistance |
| Support 1 | $54.46 | Near-term support |
| Support 2 | $54.12 | Important downside level |
| Support 3 | $53.78 | Further bearish target |
These are reference levels, not guaranteed turning points.
### 3\. Technical indicators
RSI (14)
### 57.1
Bullish momentum
MACD
### Positive signal
Short-term
Moving averages
Mixed to bearish
Daily trend
Bearish
The indicator readings vary by exchange and update time. Daily technical summaries remain weak, even though some shorter-term indicators suggest recovery potential. OHLCX Markets +1
### 4\. Possible trading scenarios
Bullish scenario
If LTC breaks above $55.14 and holds, the next areas to watch are $55.48 and $55.82. A sustained breakout with strong volume would improve the short-term outlook.
Bearish scenario
If LTC falls below $54.46, watch $54.12 and $53.78. A decisive break below $53.78 could indicate additional downside pressure.
Sideways scenario
If price remains between approximately $54.46 and $55.14, LTC may consolidate before choosing its next direction.
### 5\. Final outlook
Cautious — bearish daily trend
* Short-term: A recovery is possible if buying momentum continues.
* Daily timeframe: Sellers retain an advantage until resistance is broken convincingly.
* Trade approach: Wait for confirmation rather than entering solely on a small price bounce.
* Risk management: Use a predefined stop-loss and avoid excessive leverage.
This is technical market analysis, not a guaranteed prediction or financial advice. Crypto prices can change rapidly, a
nd the levels above should be verified against your exchange's live chart before trading.
#LTC📈 #LTCPricePrediction #LTC/USD #viralpost
LTC/USD Analysis — November 4, 2026
$LTC /USD Analysis — November 4, 2026
Market: Litecoin ($LTC ) / US Dollar (USD)

### $54.67
+0.75% daily
Latest reported market price OHLCX Markets +1
### 1\. Market overview
Litecoin is showing a short-term recovery attempt, but the broader daily trend remains weak. Technical indicators are giving mixed signals: shorter-term momentum has improved, while the daily trend still favors sellers. OHLCX Markets +1
* Short-term trend: Mildly bullish recovery
* Daily trend: Bearish
* Momentum: Mixed, with a possible relief bounce
* Trading risk: Elevated volatility
### 2\. Key support and resistance levels
Based on the latest available technical readings around the $54–$55 area: OHLCX Markets +1
| Level | Price (USD) | Significance |
| ------------ | ----------- | -------------------------- |
| Resistance 3 | $55.82 | Higher breakout zone |
| Resistance 2 | $55.48 | Bullish continuation level |
| Resistance 1 | $55.14 | First resistance |
| Support 1 | $54.46 | Near-term support |
| Support 2 | $54.12 | Important downside level |
| Support 3 | $53.78 | Further bearish target |
These are reference levels, not guaranteed turning points.
### 3\. Technical indicators
RSI (14)
### 57.1
Bullish momentum
MACD
### Positive signal
Short-term
Moving averages
Mixed to bearish
Daily trend
Bearish
The indicator readings vary by exchange and update time. Daily technical summaries remain weak, even though some shorter-term indicators suggest recovery potential. OHLCX Markets +1
### 4\. Possible trading scenarios
Bullish scenario
If LTC breaks above $55.14 and holds, the next areas to watch are $55.48 and $55.82. A sustained breakout with strong volume would improve the short-term outlook.
Bearish scenario
If LTC falls below $54.46, watch $54.12 and $53.78. A decisive break below $53.78 could indicate additional downside pressure.
Sideways scenario
If price remains between approximately $54.46 and $55.14, LTC may consolidate before choosing its next direction.
### 5\. Final outlook
Cautious — bearish daily trend
* Short-term: A recovery is possible if buying momentum continues.
* Daily timeframe: Sellers retain an advantage until resistance is broken convincingly.
* Trade approach: Wait for confirmation rather than entering solely on a small price bounce.
* Risk management: Use a predefined stop-loss and avoid excessive leverage.
This is technical market analysis, not a guaranteed prediction or financial advice. Crypto prices can change rapidly, a
nd the levels above should be verified against your exchange's live chart before trading.
#LTC📈 #LTCPricePrediction #LTC/USD #viralpost
Market: Litecoin ($LTC ) / US Dollar (USD)

### $54.67
+0.75% daily
Latest reported market price OHLCX Markets +1
### 1\. Market overview
Litecoin is showing a short-term recovery attempt, but the broader daily trend remains weak. Technical indicators are giving mixed signals: shorter-term momentum has improved, while the daily trend still favors sellers. OHLCX Markets +1
* Short-term trend: Mildly bullish recovery
* Daily trend: Bearish
* Momentum: Mixed, with a possible relief bounce
* Trading risk: Elevated volatility
### 2\. Key support and resistance levels
Based on the latest available technical readings around the $54–$55 area: OHLCX Markets +1
| Level | Price (USD) | Significance |
| ------------ | ----------- | -------------------------- |
| Resistance 3 | $55.82 | Higher breakout zone |
| Resistance 2 | $55.48 | Bullish continuation level |
| Resistance 1 | $55.14 | First resistance |
| Support 1 | $54.46 | Near-term support |
| Support 2 | $54.12 | Important downside level |
| Support 3 | $53.78 | Further bearish target |
These are reference levels, not guaranteed turning points.
### 3\. Technical indicators
RSI (14)
### 57.1
Bullish momentum
MACD
### Positive signal
Short-term
Moving averages
Mixed to bearish
Daily trend
Bearish
The indicator readings vary by exchange and update time. Daily technical summaries remain weak, even though some shorter-term indicators suggest recovery potential. OHLCX Markets +1
### 4\. Possible trading scenarios
Bullish scenario
If LTC breaks above $55.14 and holds, the next areas to watch are $55.48 and $55.82. A sustained breakout with strong volume would improve the short-term outlook.
Bearish scenario
If LTC falls below $54.46, watch $54.12 and $53.78. A decisive break below $53.78 could indicate additional downside pressure.
Sideways scenario
If price remains between approximately $54.46 and $55.14, LTC may consolidate before choosing its next direction.
### 5\. Final outlook
Cautious — bearish daily trend
* Short-term: A recovery is possible if buying momentum continues.
* Daily timeframe: Sellers retain an advantage until resistance is broken convincingly.
* Trade approach: Wait for confirmation rather than entering solely on a small price bounce.
* Risk management: Use a predefined stop-loss and avoid excessive leverage.
This is technical market analysis, not a guaranteed prediction or financial advice. Crypto prices can change rapidly, a
nd the levels above should be verified against your exchange's live chart before trading.
#LTC📈 #LTCPricePrediction #LTC/USD #viralpost
79

·
--

Article
LTC on the rise - Litecoin today, November 4, 2026Price now: $54.60 - $55.79, up +0.75% to +2.95% depending on the platform
Down -5.5% in 7 days, -23% in 30 days, and -36% in a year
Down -87% from its ATH of $410
📊 Technical analysis - mixed:
Daily RSI: 37.9, near oversold - weak
1h RSI: 55.5 - short-term improvement
ADX: 34.9 - strong downtrend
Above EMA50 but below EMA200 - mixed picture
Overall rating: 68/100, short-term bullish, daily bearish
LTC on the rise - Litecoin today, November 4, 2026
Price now: $54.60 - $55.79, up +0.75% to +2.95% depending on the platform
Down -5.5% in 7 days, -23% in 30 days, and -36% in a year
Down -87% from its ATH of $410
📊 Technical analysis - mixed:
Daily RSI: 37.9, near oversold - weak
1h RSI: 55.5 - short-term improvement
ADX: 34.9 - strong downtrend
Above EMA50 but below EMA200 - mixed picture
Overall rating: 68/100, short-term bullish, daily bearish
Down -5.5% in 7 days, -23% in 30 days, and -36% in a year
Down -87% from its ATH of $410
📊 Technical analysis - mixed:
Daily RSI: 37.9, near oversold - weak
1h RSI: 55.5 - short-term improvement
ADX: 34.9 - strong downtrend
Above EMA50 but below EMA200 - mixed picture
Overall rating: 68/100, short-term bullish, daily bearish
1
167
Article
LTC/USD Technical Analysis — November 1, 2026$LTC /USD Technical Analysis — November 1, 2026
{spot}(LTCUSDT)
Litecoin ($LTC ) vs US Dollar (USD) · Short-term trading outlook

### $55.90–$56.05
Approximate reference price from recent market data
Bearish bias
Litecoin is showing a weak short-term and medium-term trend, although a small intraday rebound is possible. Recent technical readings show daily RSI around 40, with price below important moving averages and momentum indicators still relatively weak. OHLCX Markets +2
### 1\. Key support and resistance levels
| Level | Price (USD) | Importance |
| ----------------- | ------------- | -------------------- |
| Resistance 3 | $59.30 | Stronger resistance |
| Resistance 2 | $57.63 | Upside target |
| Resistance 1 | $56.59–$56.96 | Immediate resistance |
| Current reference | $55.90–$56.05 | Price zone |
| Support 1 | $54.99–$55.05 | Immediate support |
| Support 2 | $53.07–$53.68 | Lower support |
| Support 3 | $51.66 | Bearish target |
These are approximate technical levels from November 1 market data and may vary by exchange. Borearis +1
### 2\. Trading scenarios
Bearish scenario — SELL setup
If LTC breaks below $54.99 and confirms the breakdown, the next potential levels are:
* Target 1: $53.70
* Target 2: $53.05
* Target 3: $51.66
Bullish scenario — BUY setup
If LTC breaks above $56.60–$56.96 and holds that zone:
* Target 1: $57.63
* Target 2: $58.00
* Target 3: $59.30
### 3\. Technical indicators
* RSI: Around 40 — weak momentum, but not deeply oversold.
* MACD: Bearish on the daily chart.
* Trend: Short-term bearish; a recovery is possible if resistance breaks.
* Overall bias: Bearish until price shows a convincing breakout. OHLCX Markets +1
### 4\. My trading view
Preferred bias: SELL on confirmed weakness
Watch for a break below $54.99 rather than entering blindly.
Bullish invalidation of the short-term view
A sustained move above $56.96 would improve the recovery outlook.
Risk management: Wait for candle confirmation, use a stop-loss, and avoid excessive leverage. These are technical scenarios, not guaranteed predictions.
Would you like a more specific trading setup?
Choose your chart timeframe
5-minute scalping
15-minute trading
1-hour trading
4-hour swing trading
Daily analysis
Trade direction
BUY only
SELL only
BUY and SELL setups
Get detailed LTC/USD setup.
#LTC📈 #LTC/USD #LTCPricePrediction
LTC/USD Technical Analysis — November 1, 2026
$LTC /USD Technical Analysis — November 1, 2026
Litecoin ($LTC ) vs US Dollar (USD) · Short-term trading outlook

### $55.90–$56.05
Approximate reference price from recent market data
Bearish bias
Litecoin is showing a weak short-term and medium-term trend, although a small intraday rebound is possible. Recent technical readings show daily RSI around 40, with price below important moving averages and momentum indicators still relatively weak. OHLCX Markets +2
### 1\. Key support and resistance levels
| Level | Price (USD) | Importance |
| ----------------- | ------------- | -------------------- |
| Resistance 3 | $59.30 | Stronger resistance |
| Resistance 2 | $57.63 | Upside target |
| Resistance 1 | $56.59–$56.96 | Immediate resistance |
| Current reference | $55.90–$56.05 | Price zone |
| Support 1 | $54.99–$55.05 | Immediate support |
| Support 2 | $53.07–$53.68 | Lower support |
| Support 3 | $51.66 | Bearish target |
These are approximate technical levels from November 1 market data and may vary by exchange. Borearis +1
### 2\. Trading scenarios
Bearish scenario — SELL setup
If LTC breaks below $54.99 and confirms the breakdown, the next potential levels are:
* Target 1: $53.70
* Target 2: $53.05
* Target 3: $51.66
Bullish scenario — BUY setup
If LTC breaks above $56.60–$56.96 and holds that zone:
* Target 1: $57.63
* Target 2: $58.00
* Target 3: $59.30
### 3\. Technical indicators
* RSI: Around 40 — weak momentum, but not deeply oversold.
* MACD: Bearish on the daily chart.
* Trend: Short-term bearish; a recovery is possible if resistance breaks.
* Overall bias: Bearish until price shows a convincing breakout. OHLCX Markets +1
### 4\. My trading view
Preferred bias: SELL on confirmed weakness
Watch for a break below $54.99 rather than entering blindly.
Bullish invalidation of the short-term view
A sustained move above $56.96 would improve the recovery outlook.
Risk management: Wait for candle confirmation, use a stop-loss, and avoid excessive leverage. These are technical scenarios, not guaranteed predictions.
Would you like a more specific trading setup?
Choose your chart timeframe
5-minute scalping
15-minute trading
1-hour trading
4-hour swing trading
Daily analysis
Trade direction
BUY only
SELL only
BUY and SELL setups
Get detailed LTC/USD setup.
#LTC📈 #LTC/USD #LTCPricePrediction
Litecoin ($LTC ) vs US Dollar (USD) · Short-term trading outlook

### $55.90–$56.05
Approximate reference price from recent market data
Bearish bias
Litecoin is showing a weak short-term and medium-term trend, although a small intraday rebound is possible. Recent technical readings show daily RSI around 40, with price below important moving averages and momentum indicators still relatively weak. OHLCX Markets +2
### 1\. Key support and resistance levels
| Level | Price (USD) | Importance |
| ----------------- | ------------- | -------------------- |
| Resistance 3 | $59.30 | Stronger resistance |
| Resistance 2 | $57.63 | Upside target |
| Resistance 1 | $56.59–$56.96 | Immediate resistance |
| Current reference | $55.90–$56.05 | Price zone |
| Support 1 | $54.99–$55.05 | Immediate support |
| Support 2 | $53.07–$53.68 | Lower support |
| Support 3 | $51.66 | Bearish target |
These are approximate technical levels from November 1 market data and may vary by exchange. Borearis +1
### 2\. Trading scenarios
Bearish scenario — SELL setup
If LTC breaks below $54.99 and confirms the breakdown, the next potential levels are:
* Target 1: $53.70
* Target 2: $53.05
* Target 3: $51.66
Bullish scenario — BUY setup
If LTC breaks above $56.60–$56.96 and holds that zone:
* Target 1: $57.63
* Target 2: $58.00
* Target 3: $59.30
### 3\. Technical indicators
* RSI: Around 40 — weak momentum, but not deeply oversold.
* MACD: Bearish on the daily chart.
* Trend: Short-term bearish; a recovery is possible if resistance breaks.
* Overall bias: Bearish until price shows a convincing breakout. OHLCX Markets +1
### 4\. My trading view
Preferred bias: SELL on confirmed weakness
Watch for a break below $54.99 rather than entering blindly.
Bullish invalidation of the short-term view
A sustained move above $56.96 would improve the recovery outlook.
Risk management: Wait for candle confirmation, use a stop-loss, and avoid excessive leverage. These are technical scenarios, not guaranteed predictions.
Would you like a more specific trading setup?
Choose your chart timeframe
5-minute scalping
15-minute trading
1-hour trading
4-hour swing trading
Daily analysis
Trade direction
BUY only
SELL only
BUY and SELL setups
Get detailed LTC/USD setup.
#LTC📈 #LTC/USD #LTCPricePrediction
272

#LTCPricePrediction
This is an established and well-known cryptocurrency project. While its future does not necessarily appear to be coming to an end, a rise in its price is also not guaranteed. If you are considering purchasing LTC or engaging in long/short (buy/sell) futures trading, it is essential to separately evaluate its fundamental aspects and its price trends.
1. Future Strengths and Risks of LTC
Limited Supply: Litecoin has a maximum supply of 84 million coins.
Fast Payments: It was designed to facilitate relatively low-cost digital payments.
Established Network: It has been present in the cryptocurrency market for many years.
Competition: It may face pressure due to Bitcoin, stablecoins, and other payment networks.
{spot}(LTCUSDT)
#LTC.24小时交易策略
#LTCPricePrediction
This is an established and well-known cryptocurrency project. While its future does not necessarily appear to be coming to an end, a rise in its price is also not guaranteed. If you are considering purchasing LTC or engaging in long/short (buy/sell) futures trading, it is essential to separately evaluate its fundamental aspects and its price trends.
1. Future Strengths and Risks of LTC
Limited Supply: Litecoin has a maximum supply of 84 million coins.
Fast Payments: It was designed to facilitate relatively low-cost digital payments.
Established Network: It has been present in the cryptocurrency market for many years.
Competition: It may face pressure due to Bitcoin, stablecoins, and other payment networks.
#LTC.24小时交易策略
This is an established and well-known cryptocurrency project. While its future does not necessarily appear to be coming to an end, a rise in its price is also not guaranteed. If you are considering purchasing LTC or engaging in long/short (buy/sell) futures trading, it is essential to separately evaluate its fundamental aspects and its price trends.
1. Future Strengths and Risks of LTC
Limited Supply: Litecoin has a maximum supply of 84 million coins.
Fast Payments: It was designed to facilitate relatively low-cost digital payments.
Established Network: It has been present in the cryptocurrency market for many years.
Competition: It may face pressure due to Bitcoin, stablecoins, and other payment networks.
#LTC.24小时交易策略
2
153

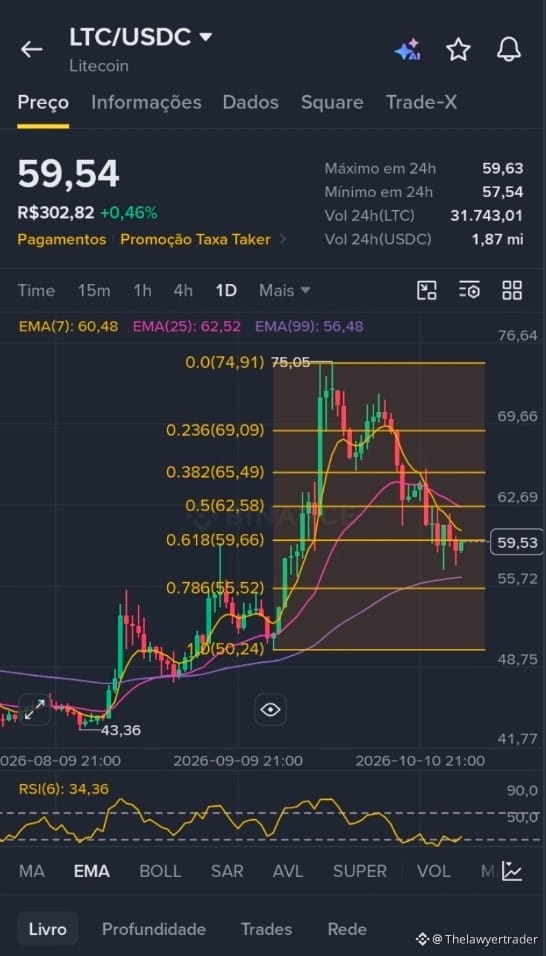
LTC/USDC — Litecoin at a decisive test on the daily chart (1D)
Litecoin is trading around 59.54 USDC, up slightly on the day, following a correction from the 75.05 high formed during the rally that began at 43.36. Price is testing the 0.618 Fibonacci level (59.66), known as the golden retracement zone, while the 6-period RSI reads 34.36, close to oversold territory.
Main support: the 55.50–56.50 area, where the 99-period EMA (56.48) and the 0.786 Fibonacci level (55.52) converge.
Main resistance: the 62.50–62.60 area, marked by the 25-period EMA (62.52) and the 0.5 Fibonacci level (62.58).
Chart pattern: a pullback (correction) within an uptrend, with price reacting in the 0.618 zone, supported by the 99-period EMA as dynamic support.
Historically, this confluence has a good chance of triggering a bounce when stabilization is confirmed, but no reversal candle has closed yet. If the 0.618 level is lost, the next downside target is the 0.786 level at 55.52. A recovery above 62.50 would indicate a resumption of the uptrend.
⚠️ This content is for informational purposes only and does not constitute investment advice.
#LTC #LTCPricePrediction $LTC
LTC/USDC — Litecoin at a decisive test on the daily chart (1D)
Litecoin is trading around 59.54 USDC, up slightly on the day, following a correction from the 75.05 high formed during the rally that began at 43.36. Price is testing the 0.618 Fibonacci level (59.66), known as the golden retracement zone, while the 6-period RSI reads 34.36, close to oversold territory.
Main support: the 55.50–56.50 area, where the 99-period EMA (56.48) and the 0.786 Fibonacci level (55.52) converge.
Main resistance: the 62.50–62.60 area, marked by the 25-period EMA (62.52) and the 0.5 Fibonacci level (62.58).
Chart pattern: a pullback (correction) within an uptrend, with price reacting in the 0.618 zone, supported by the 99-period EMA as dynamic support.
Historically, this confluence has a good chance of triggering a bounce when stabilization is confirmed, but no reversal candle has closed yet. If the 0.618 level is lost, the next downside target is the 0.786 level at 55.52. A recovery above 62.50 would indicate a resumption of the uptrend.
⚠️ This content is for informational purposes only and does not constitute investment advice.
#LTC #LTCPricePrediction $LTC
Litecoin is trading around 59.54 USDC, up slightly on the day, following a correction from the 75.05 high formed during the rally that began at 43.36. Price is testing the 0.618 Fibonacci level (59.66), known as the golden retracement zone, while the 6-period RSI reads 34.36, close to oversold territory.
Main support: the 55.50–56.50 area, where the 99-period EMA (56.48) and the 0.786 Fibonacci level (55.52) converge.
Main resistance: the 62.50–62.60 area, marked by the 25-period EMA (62.52) and the 0.5 Fibonacci level (62.58).
Chart pattern: a pullback (correction) within an uptrend, with price reacting in the 0.618 zone, supported by the 99-period EMA as dynamic support.
Historically, this confluence has a good chance of triggering a bounce when stabilization is confirmed, but no reversal candle has closed yet. If the 0.618 level is lost, the next downside target is the 0.786 level at 55.52. A recovery above 62.50 would indicate a resumption of the uptrend.
⚠️ This content is for informational purposes only and does not constitute investment advice.
#LTC #LTCPricePrediction $LTC

406

·
--
As of October 17, 2026, Litecoin $LTC is experiencing a period of short-term bearish pressure, trading at $59.62 USD. Despite recently marking its 15th-anniversary milestone with robust on-chain metric consistency and high MWEB privacy pool volume, broader macroeconomic headwinds and steady capital outflows have driven the price below key support walls.
Immediate Support: $58.51 to $59.54 serves as a vital cushion. If this floor cracks, momentum could accelerate down toward the next strong structural zone at $56.10.
Key Resistance: Bulls face major hurdles at $62.67 and $64.42. A high-volume breach above these thresholds is required to reverse the near-term downtrend and focus targets back toward the psychological $70.00 mark.
#LTCPricePrediction #LTCUSDT #RecentUpdate
{spot}(LTCUSDT)
As of October 17, 2026, Litecoin $LTC is experiencing a period of short-term bearish pressure, trading at $59.62 USD. Despite recently marking its 15th-anniversary milestone with robust on-chain metric consistency and high MWEB privacy pool volume, broader macroeconomic headwinds and steady capital outflows have driven the price below key support walls.
Immediate Support: $58.51 to $59.54 serves as a vital cushion. If this floor cracks, momentum could accelerate down toward the next strong structural zone at $56.10.
Key Resistance: Bulls face major hurdles at $62.67 and $64.42. A high-volume breach above these thresholds is required to reverse the near-term downtrend and focus targets back toward the psychological $70.00 mark.
#LTCPricePrediction #LTCUSDT #RecentUpdate
Immediate Support: $58.51 to $59.54 serves as a vital cushion. If this floor cracks, momentum could accelerate down toward the next strong structural zone at $56.10.
Key Resistance: Bulls face major hurdles at $62.67 and $64.42. A high-volume breach above these thresholds is required to reverse the near-term downtrend and focus targets back toward the psychological $70.00 mark.
#LTCPricePrediction #LTCUSDT #RecentUpdate
1
173

Based on my analysis of your Binance LTC/USDT chart, Litecoin is now near an important support zone. However, there is a risk of further price declines in the short term.
Current price shown on the chart
### $59.09
−3.70%
Support
### $58.70
Resistance
### $62.45
These figures are from the screenshot you sent; they are not live prices.
### What does the chart indicate?
* Trend: The long-term trend on the monthly chart is still weak. The price is well below MA(25) at $79.35 and MA(99) at $85.87.
* Bullish signal: There has been a strong recovery from $39.28, and the price is above MA(7) at $52.63.
* Bearish signal: A red candle appeared after the recent large green candle. This suggests there may be selling pressure in the $65–$70 range.
### Possible price movements
Bullish scenario
### $62.45 → $65–$70
If the price makes a strong move back above $62.45 and holds there, these levels could be the next targets.
Bearish scenario
### $58.70 → $55–$56
If the current support breaks, the price may fall further. #LTCPricePrediction
Based on my analysis of your Binance LTC/USDT chart, Litecoin is now near an important support zone. However, there is a risk of further price declines in the short term.
Current price shown on the chart
### $59.09
−3.70%
Support
### $58.70
Resistance
### $62.45
These figures are from the screenshot you sent; they are not live prices.
### What does the chart indicate?
* Trend: The long-term trend on the monthly chart is still weak. The price is well below MA(25) at $79.35 and MA(99) at $85.87.
* Bullish signal: There has been a strong recovery from $39.28, and the price is above MA(7) at $52.63.
* Bearish signal: A red candle appeared after the recent large green candle. This suggests there may be selling pressure in the $65–$70 range.
### Possible price movements
Bullish scenario
### $62.45 → $65–$70
If the price makes a strong move back above $62.45 and holds there, these levels could be the next targets.
Bearish scenario
### $58.70 → $55–$56
If the current support breaks, the price may fall further. #LTCPricePrediction
Current price shown on the chart
### $59.09
−3.70%
Support
### $58.70
Resistance
### $62.45
These figures are from the screenshot you sent; they are not live prices.
### What does the chart indicate?
* Trend: The long-term trend on the monthly chart is still weak. The price is well below MA(25) at $79.35 and MA(99) at $85.87.
* Bullish signal: There has been a strong recovery from $39.28, and the price is above MA(7) at $52.63.
* Bearish signal: A red candle appeared after the recent large green candle. This suggests there may be selling pressure in the $65–$70 range.
### Possible price movements
Bullish scenario
### $62.45 → $65–$70
If the price makes a strong move back above $62.45 and holds there, these levels could be the next targets.
Bearish scenario
### $58.70 → $55–$56
If the current support breaks, the price may fall further. #LTCPricePrediction
80

·
--
Bullish
⚡ $LTC GETS A POWERFUL SURGE! WHY DOES EVERYONE TALK ABOUT LITECOIN? 🔥
While the market is storming, $LTC shows iron-level holding and confident growth! Whales and investors are attracted by the network’s reliability.
Why $LTC is in focus right now:
Stability: Keeps the green zone even during overall volatility.
Security and MWEB: The network works like a clock, volumes are growing.
Accumulation: Big players view LTC as a safe-haven asset.
❓ YOUR FORECAST FOR $LTC:
1️⃣ $70+ — the breakout is already close!
2️⃣ $100+ — a confident climb to new highs.
3️⃣ For now, I’m watching.
Write your version in the comments! 👇 #Litecoin #LTCPricePrediction #BinanceSquareTalks
⚡ $LTC GETS A POWERFUL SURGE! WHY DOES EVERYONE TALK ABOUT LITECOIN? 🔥
While the market is storming, $LTC shows iron-level holding and confident growth! Whales and investors are attracted by the network’s reliability.
Why $LTC is in focus right now:
Stability: Keeps the green zone even during overall volatility.
Security and MWEB: The network works like a clock, volumes are growing.
Accumulation: Big players view LTC as a safe-haven asset.
❓ YOUR FORECAST FOR $LTC :
1️⃣ $70+ — the breakout is already close!
2️⃣ $100+ — a confident climb to new highs.
3️⃣ For now, I’m watching.
Write your version in the comments! 👇 #Litecoin #LTCPricePrediction #BinanceSquareTalks
While the market is storming, $LTC shows iron-level holding and confident growth! Whales and investors are attracted by the network’s reliability.
Why $LTC is in focus right now:
Stability: Keeps the green zone even during overall volatility.
Security and MWEB: The network works like a clock, volumes are growing.
Accumulation: Big players view LTC as a safe-haven asset.
❓ YOUR FORECAST FOR $LTC :
1️⃣ $70+ — the breakout is already close!
2️⃣ $100+ — a confident climb to new highs.
3️⃣ For now, I’m watching.
Write your version in the comments! 👇 #Litecoin #LTCPricePrediction #BinanceSquareTalks
58

·
--
Bullish
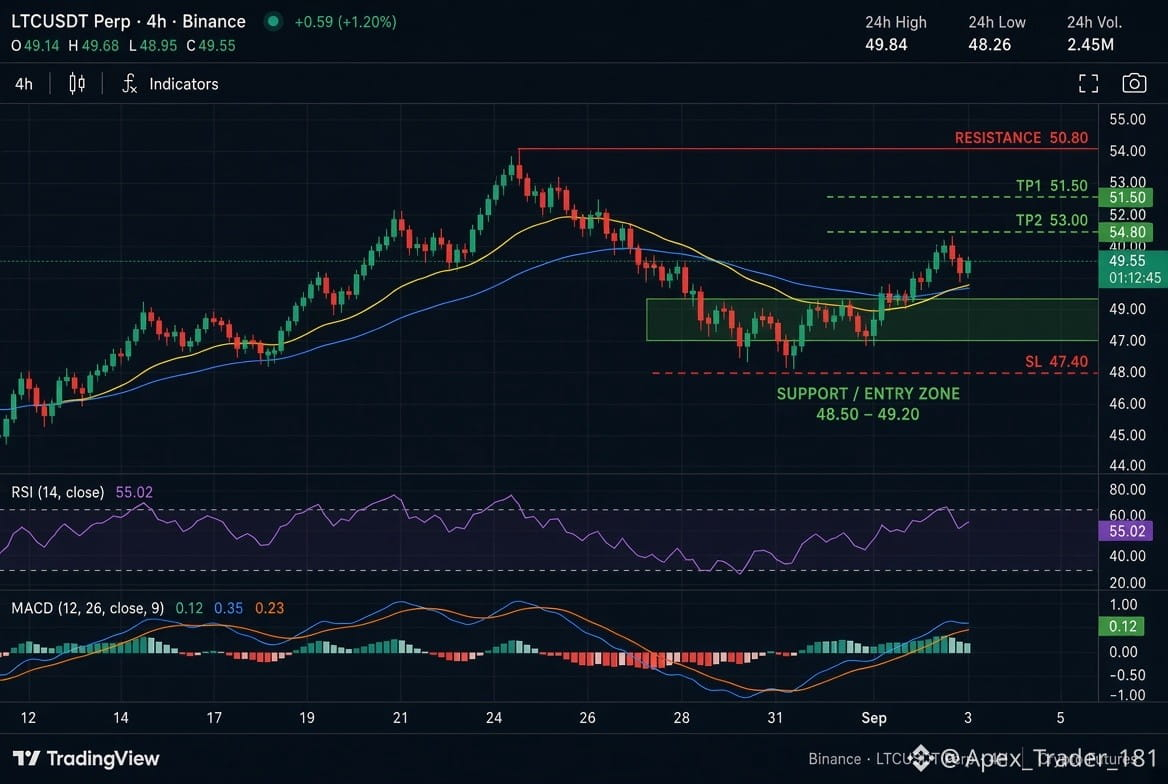
$LTC open big long now, thanks me soon🤑
Entry Zone: $48.60
SL: $47.40
TP1: $50.80
TP2: $52.80
TP3: $54.50
$LTC long👇#LTCPricePrediction
#LTC/USD
{future}(LTCUSDT)
$LTC open big long now, thanks me soon🤑
Entry Zone: $48.60
SL: $47.40
TP1: $50.80
TP2: $52.80
TP3: $54.50
$LTC long👇#LTCPricePrediction
#LTC/USD
Entry Zone: $48.60
SL: $47.40
TP1: $50.80
TP2: $52.80
TP3: $54.50
$LTC long👇#LTCPricePrediction
#LTC/USD
67
4
330

·
--
Bullish
LTC Hao-ge’s Trading Strategy for Today
Yesterday’s LTC market action perfectly matched the prediction. The strategy “script” Hao-ge shared in advance hit the target zone precisely! The timing was controlled flawlessly, and all the partners who followed the plan successfully took profits.
Many friends who missed yesterday’s move can only slap their thighs—opportunities always go to those who get on board with the thinking in advance.
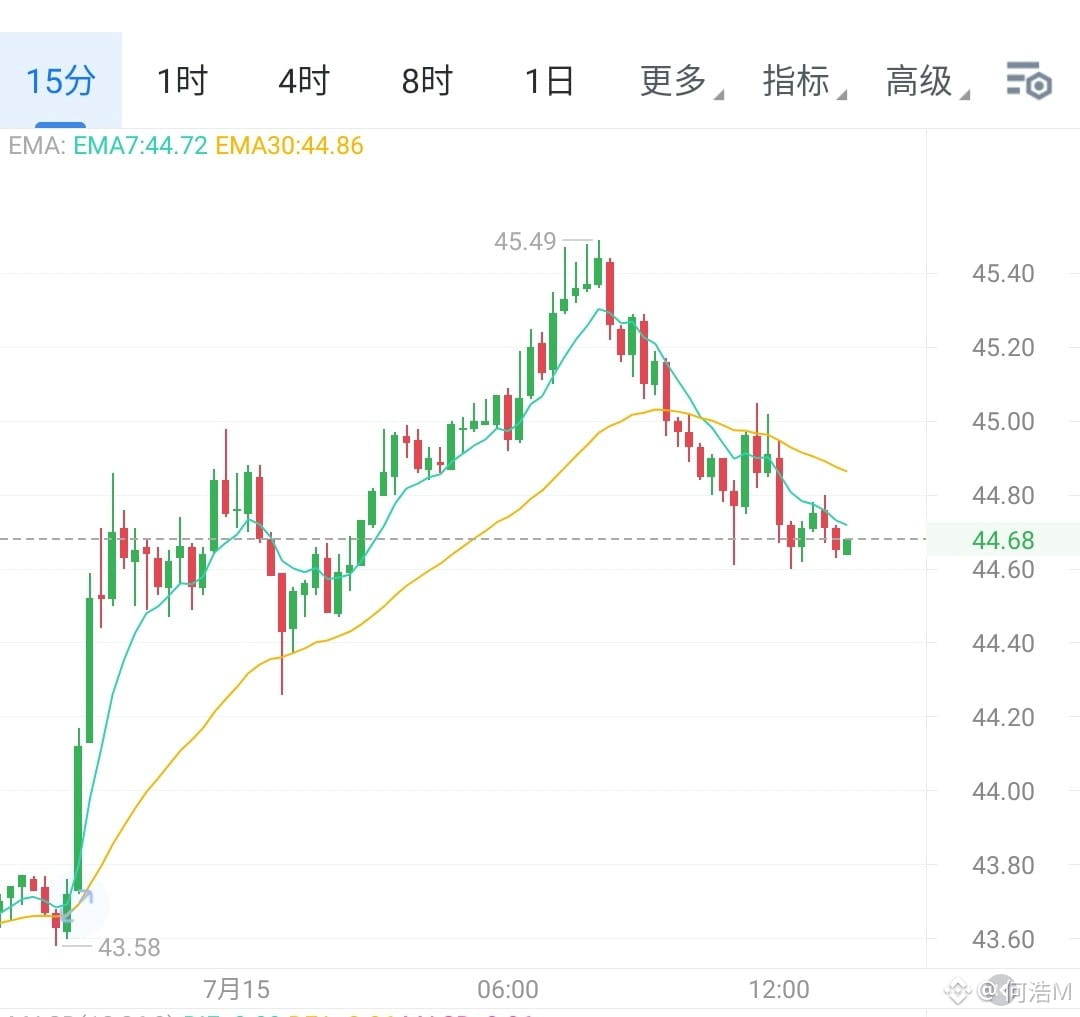
Today’s chart shows bullish momentum continuing. Overall, the plan remains to ride the trend and stay bullish!
For the short-term: pullbacks in the support range of 44.60–43.90 can be bought in batches for long positions. The first target is 45.30. After consolidation and a push higher, the second target is 46.20. Keep holding the short-term rebound profits steadily! #LTCPricePrediction $LTC
{future}(LTCUSDT)
LTC Hao-ge’s Trading Strategy for Today
Yesterday’s LTC market action perfectly matched the prediction. The strategy “script” Hao-ge shared in advance hit the target zone precisely! The timing was controlled flawlessly, and all the partners who followed the plan successfully took profits.
Many friends who missed yesterday’s move can only slap their thighs—opportunities always go to those who get on board with the thinking in advance.
Today’s chart shows bullish momentum continuing. Overall, the plan remains to ride the trend and stay bullish!
For the short-term: pullbacks in the support range of 44.60–43.90 can be bought in batches for long positions. The first target is 45.30. After consolidation and a push higher, the second target is 46.20. Keep holding the short-term rebound profits steadily! #LTCPricePrediction $LTC
Yesterday’s LTC market action perfectly matched the prediction. The strategy “script” Hao-ge shared in advance hit the target zone precisely! The timing was controlled flawlessly, and all the partners who followed the plan successfully took profits.
Many friends who missed yesterday’s move can only slap their thighs—opportunities always go to those who get on board with the thinking in advance.
Today’s chart shows bullish momentum continuing. Overall, the plan remains to ride the trend and stay bullish!
For the short-term: pullbacks in the support range of 44.60–43.90 can be bought in batches for long positions. The first target is 45.30. After consolidation and a push higher, the second target is 46.20. Keep holding the short-term rebound profits steadily! #LTCPricePrediction $LTC
250

·
--
Bullish
🟠 $LTC /USDT
LTC is currently about $51.7–$52.1; recent support is in the $50–$53 zone.
🟢 Support: $50.0–$52.0
🔴 Resistance: $55–$57
🚀 $57 breakout: $60+
⚠️ $50 breakdown: $48 → $46
LONG: Hold $50–52 + confirmation
TP: $55 → $57 → $60
SL: $48.8
Bias: 🟡 Neutral → Bullish — be cautious until $55–$57 is reclaimed. #LTC📈 #LTCPricePrediction #LTC/USD #BessentEndorsesFinalClarityActDraft #BessentEndorsesFinalClarityActDraft
{spot}(LTCUSDT)
🟠 $LTC /USDT
LTC is currently about $51.7–$52.1; recent support is in the $50–$53 zone.
🟢 Support: $50.0–$52.0
🔴 Resistance: $55–$57
🚀 $57 breakout: $60+
⚠️ $50 breakdown: $48 → $46
LONG: Hold $50–52 + confirmation
TP: $55 → $57 → $60
SL: $48.8
Bias: 🟡 Neutral → Bullish — be cautious until $55–$57 is reclaimed. #LTC📈 #LTCPricePrediction #LTC/USD #BessentEndorsesFinalClarityActDraft #BessentEndorsesFinalClarityActDraft
LTC is currently about $51.7–$52.1; recent support is in the $50–$53 zone.
🟢 Support: $50.0–$52.0
🔴 Resistance: $55–$57
🚀 $57 breakout: $60+
⚠️ $50 breakdown: $48 → $46
LONG: Hold $50–52 + confirmation
TP: $55 → $57 → $60
SL: $48.8
Bias: 🟡 Neutral → Bullish — be cautious until $55–$57 is reclaimed. #LTC📈 #LTCPricePrediction #LTC/USD #BessentEndorsesFinalClarityActDraft #BessentEndorsesFinalClarityActDraft
1
368

🚨🚨🚨$LTC LOVERS: THREE DIGITS ARE STILL ON THE TABLE!
Litecoin is trading near $49, with a market cap of about $3.8 billion. That is well below the 2021 peak near $413, but the structure is a coil, not a breakdown.
📌Technical picture:
Price is holding above the 20-day and 50-day averages (roughly $47.4 & $46.3) and stalling beneath the 200-day average near $50.5–$50.6. Daily RSI is around 56; neutral. Momentum has flattened rather than reversed.
🔑 Key levels:
- Support: $48.6, then $47, then $45.8–$46.3
- Resistance: $50.6, then $51.7–$52.8, then $54–$55
A sustained daily close above $51.7 would be the first confirmation of a breakout. A daily close below $47 opens a retest of the $44–$46 demand zone. Further upside maps toward $62, the weekly region near $80, and $100.
📌2027 outlook
The next Litecoin halving is expected around 28 July 2027, cutting the block reward from 6.25 to 3.125 LTC & reducing daily issuance by roughly half. Prior halvings were often sold into; the more relevant window has historically been the six to twelve months before the event.
A three-digit print in 2027 is possible in a constructive Bitcoin cycle. $100 is the more realistic cycle high if Litecoin simply participates. $150–$200 would require stronger rotation and stabilization in LTC/BTC, which remains near historic lows. A return to the all-time high would require a much broader risk-on phase.
The spot ETF is live, but assets under management remain small. Supply tightens in 2027; price will still be decided by demand and relative performance versus Bitcoin.
As always, not financial advice; do your own research(DYOR).
$ICP $UNI
"The market rewards the sharp, and patient; be both."
#LTCPricePrediction #HalvingHorizons
🚨🚨🚨$LTC LOVERS: THREE DIGITS ARE STILL ON THE TABLE!
Litecoin is trading near $49, with a market cap of about $3.8 billion. That is well below the 2021 peak near $413, but the structure is a coil, not a breakdown.
📌Technical picture:
Price is holding above the 20-day and 50-day averages (roughly $47.4 & $46.3) and stalling beneath the 200-day average near $50.5–$50.6. Daily RSI is around 56; neutral. Momentum has flattened rather than reversed.
🔑 Key levels:
- Support: $48.6, then $47, then $45.8–$46.3
- Resistance: $50.6, then $51.7–$52.8, then $54–$55
A sustained daily close above $51.7 would be the first confirmation of a breakout. A daily close below $47 opens a retest of the $44–$46 demand zone. Further upside maps toward $62, the weekly region near $80, and $100.
📌2027 outlook
The next Litecoin halving is expected around 28 July 2027, cutting the block reward from 6.25 to 3.125 LTC & reducing daily issuance by roughly half. Prior halvings were often sold into; the more relevant window has historically been the six to twelve months before the event.
A three-digit print in 2027 is possible in a constructive Bitcoin cycle. $100 is the more realistic cycle high if Litecoin simply participates. $150–$200 would require stronger rotation and stabilization in LTC/BTC, which remains near historic lows. A return to the all-time high would require a much broader risk-on phase.
The spot ETF is live, but assets under management remain small. Supply tightens in 2027; price will still be decided by demand and relative performance versus Bitcoin.
As always, not financial advice; do your own research(DYOR).
$ICP $UNI
"The market rewards the sharp, and patient; be both."
#LTCPricePrediction #HalvingHorizons
Litecoin is trading near $49, with a market cap of about $3.8 billion. That is well below the 2021 peak near $413, but the structure is a coil, not a breakdown.
📌Technical picture:
Price is holding above the 20-day and 50-day averages (roughly $47.4 & $46.3) and stalling beneath the 200-day average near $50.5–$50.6. Daily RSI is around 56; neutral. Momentum has flattened rather than reversed.
🔑 Key levels:
- Support: $48.6, then $47, then $45.8–$46.3
- Resistance: $50.6, then $51.7–$52.8, then $54–$55
A sustained daily close above $51.7 would be the first confirmation of a breakout. A daily close below $47 opens a retest of the $44–$46 demand zone. Further upside maps toward $62, the weekly region near $80, and $100.
📌2027 outlook
The next Litecoin halving is expected around 28 July 2027, cutting the block reward from 6.25 to 3.125 LTC & reducing daily issuance by roughly half. Prior halvings were often sold into; the more relevant window has historically been the six to twelve months before the event.
A three-digit print in 2027 is possible in a constructive Bitcoin cycle. $100 is the more realistic cycle high if Litecoin simply participates. $150–$200 would require stronger rotation and stabilization in LTC/BTC, which remains near historic lows. A return to the all-time high would require a much broader risk-on phase.
The spot ETF is live, but assets under management remain small. Supply tightens in 2027; price will still be decided by demand and relative performance versus Bitcoin.
As always, not financial advice; do your own research(DYOR).
$ICP $UNI
"The market rewards the sharp, and patient; be both."
#LTCPricePrediction #HalvingHorizons

1
234

·
--
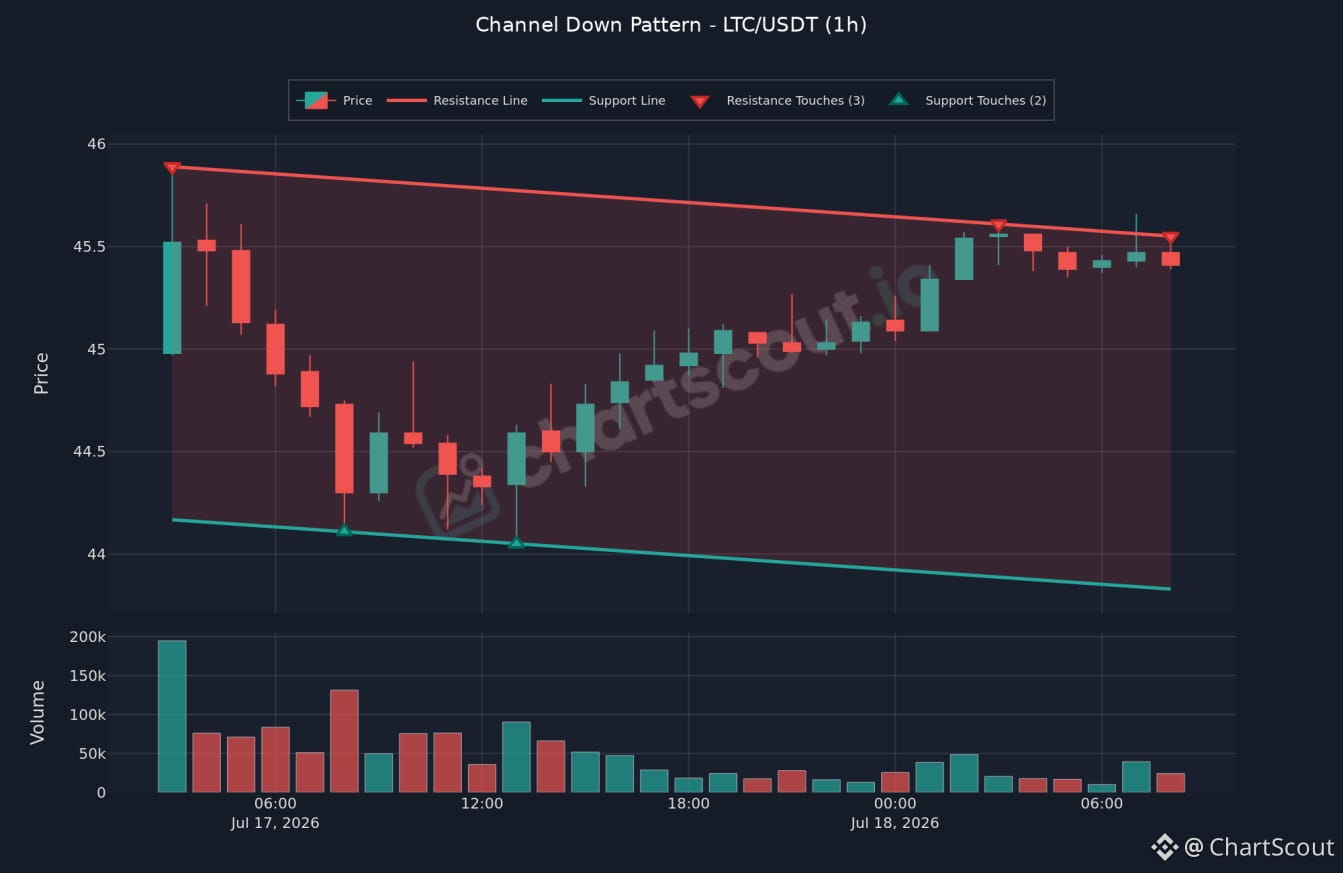
LTC/USDT is moving inside a Channel Down on the 1H, and the structure is still holding cleanly.
Price has been respecting both boundaries with 3 resistance touches and 2 support touches, while the channel keeps grinding lower without a confirmed breakout.
This one is still in play, so the next reaction near the upper line will matter.
DYOR before making any moves. 🧠
#ChartScout #LTC #LTC📈 #LTCPricePrediction
LTC/USDT is moving inside a Channel Down on the 1H, and the structure is still holding cleanly.
Price has been respecting both boundaries with 3 resistance touches and 2 support touches, while the channel keeps grinding lower without a confirmed breakout.
This one is still in play, so the next reaction near the upper line will matter.
DYOR before making any moves. 🧠
#ChartScout #LTC #LTC📈 #LTCPricePrediction
Price has been respecting both boundaries with 3 resistance touches and 2 support touches, while the channel keeps grinding lower without a confirmed breakout.
This one is still in play, so the next reaction near the upper line will matter.
DYOR before making any moves. 🧠
#ChartScout #LTC #LTC📈 #LTCPricePrediction
64

·
--
Bullish
$LTC /USDT SPOT SETUP
Market is broadly red, but $LTC is showing strong relative strength (+6%).
Setup
• Entry: $66.80
• Stop: $65.80
• TP: $68.05
• Risk: ~$2.40
• Potential profit: ~$3
• Spot only — No leverage
{spot}(LTCUSDT)
Why $LTC ?
• Stronger than BTC /ETH/SOL today
• 1H EMA20 > EMA50
• Breakout from $60–62 range
• Pullback entry avoids chasing
• RSI ~70 → waiting for a better entry makes sense
Invalidation: 1H close below $65.80.
If LTC doesn't pull back to $66.80, don't chase. A break above $69.48 would be a separate setup.
DYOR. This is a trade setup, not a guarantee of profit. Manage your own risk.
#LTCPricePrediction #altsesaon #BTC☀ #LitecoinUpdate #BTCdominance
$LTC /USDT SPOT SETUP
Market is broadly red, but $LTC is showing strong relative strength (+6%).
Setup
• Entry: $66.80
• Stop: $65.80
• TP: $68.05
• Risk: ~$2.40
• Potential profit: ~$3
• Spot only — No leverage
Why $LTC ?
• Stronger than BTC /ETH/SOL today
• 1H EMA20 > EMA50
• Breakout from $60–62 range
• Pullback entry avoids chasing
• RSI ~70 → waiting for a better entry makes sense
Invalidation: 1H close below $65.80.
If LTC doesn't pull back to $66.80, don't chase. A break above $69.48 would be a separate setup.
DYOR. This is a trade setup, not a guarantee of profit. Manage your own risk.
#LTCPricePrediction #altsesaon #BTC☀ #LitecoinUpdate #BTCdominance
Market is broadly red, but $LTC is showing strong relative strength (+6%).
Setup
• Entry: $66.80
• Stop: $65.80
• TP: $68.05
• Risk: ~$2.40
• Potential profit: ~$3
• Spot only — No leverage
Why $LTC ?
• Stronger than BTC /ETH/SOL today
• 1H EMA20 > EMA50
• Breakout from $60–62 range
• Pullback entry avoids chasing
• RSI ~70 → waiting for a better entry makes sense
Invalidation: 1H close below $65.80.
If LTC doesn't pull back to $66.80, don't chase. A break above $69.48 would be a separate setup.
DYOR. This is a trade setup, not a guarantee of profit. Manage your own risk.
#LTCPricePrediction #altsesaon #BTC☀ #LitecoinUpdate #BTCdominance
1
193

·
--
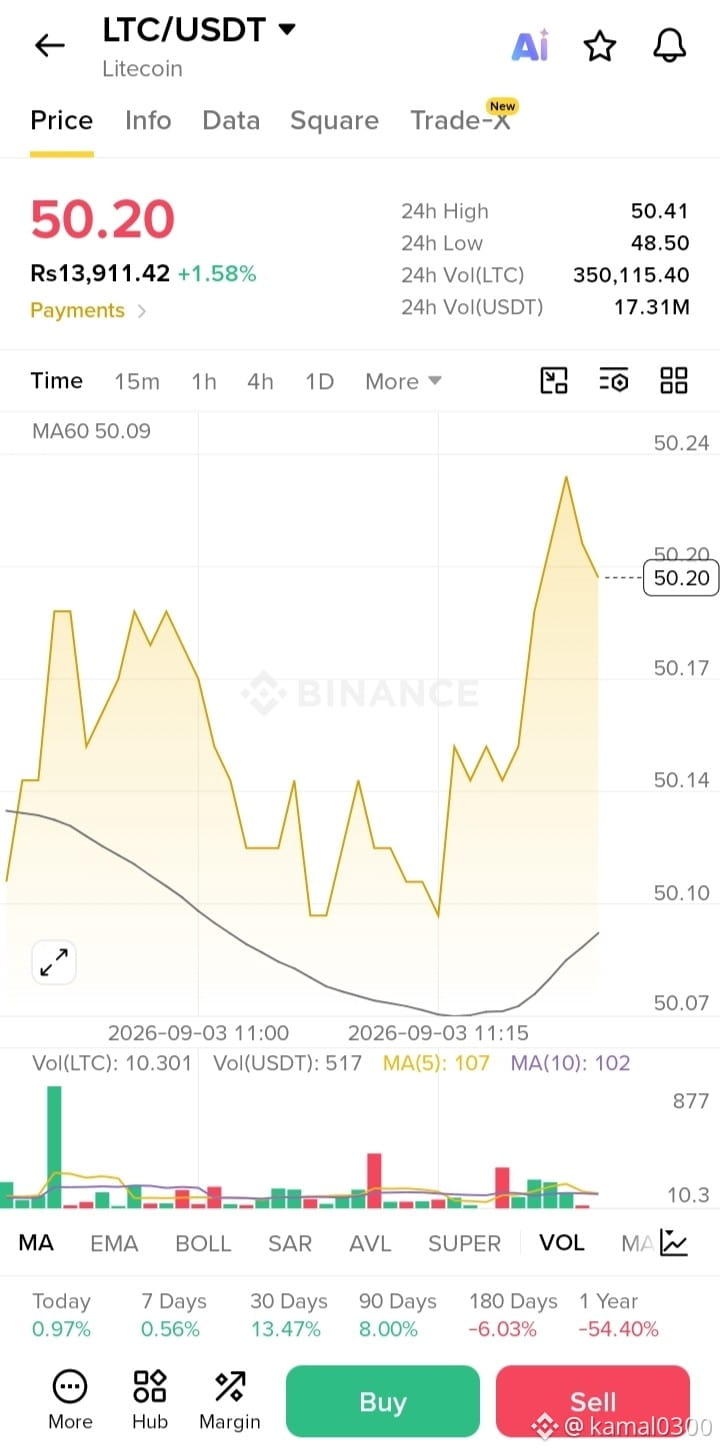
Holding $LTC 22.2 USDT
$LTC
Capital: $50
Entry 1: $50.10 → ~$25 (0.499 LTC)
Entry 2: $50.00 → ~$25 (0.500 LTC)
Average entry: around $50.05
🛑 Stop-loss: $49.85
🎯 TP1: $50.40
🎯 TP2: $50.60$
🎯 TP3: $50.80
If price breaks $50.25–$50.30 with a strong 15-minute candle, you can instead consider the breakout entry, but don't chase a sudden spike.
Risk: With $50, the planned stop from ~$50.05 to $49.85 is only about $0.20 loss before trading fees
$LTC
#LTC
#LTCPricePrediction
$LTC
Capital: $50
Entry 1: $50.10 → ~$25 (0.499 LTC)
Entry 2: $50.00 → ~$25 (0.500 LTC)
Average entry: around $50.05
🛑 Stop-loss: $49.85
🎯 TP1: $50.40
🎯 TP2: $50.60$
🎯 TP3: $50.80
If price breaks $50.25–$50.30 with a strong 15-minute candle, you can instead consider the breakout entry, but don't chase a sudden spike.
Risk: With $50, the planned stop from ~$50.05 to $49.85 is only about $0.20 loss before trading fees
$LTC
#LTC
#LTCPricePrediction
Capital: $50
Entry 1: $50.10 → ~$25 (0.499 LTC)
Entry 2: $50.00 → ~$25 (0.500 LTC)
Average entry: around $50.05
🛑 Stop-loss: $49.85
🎯 TP1: $50.40
🎯 TP2: $50.60$
🎯 TP3: $50.80
If price breaks $50.25–$50.30 with a strong 15-minute candle, you can instead consider the breakout entry, but don't chase a sudden spike.
Risk: With $50, the planned stop from ~$50.05 to $49.85 is only about $0.20 loss before trading fees
$LTC
#LTC
#LTCPricePrediction
1
2
228


·
--
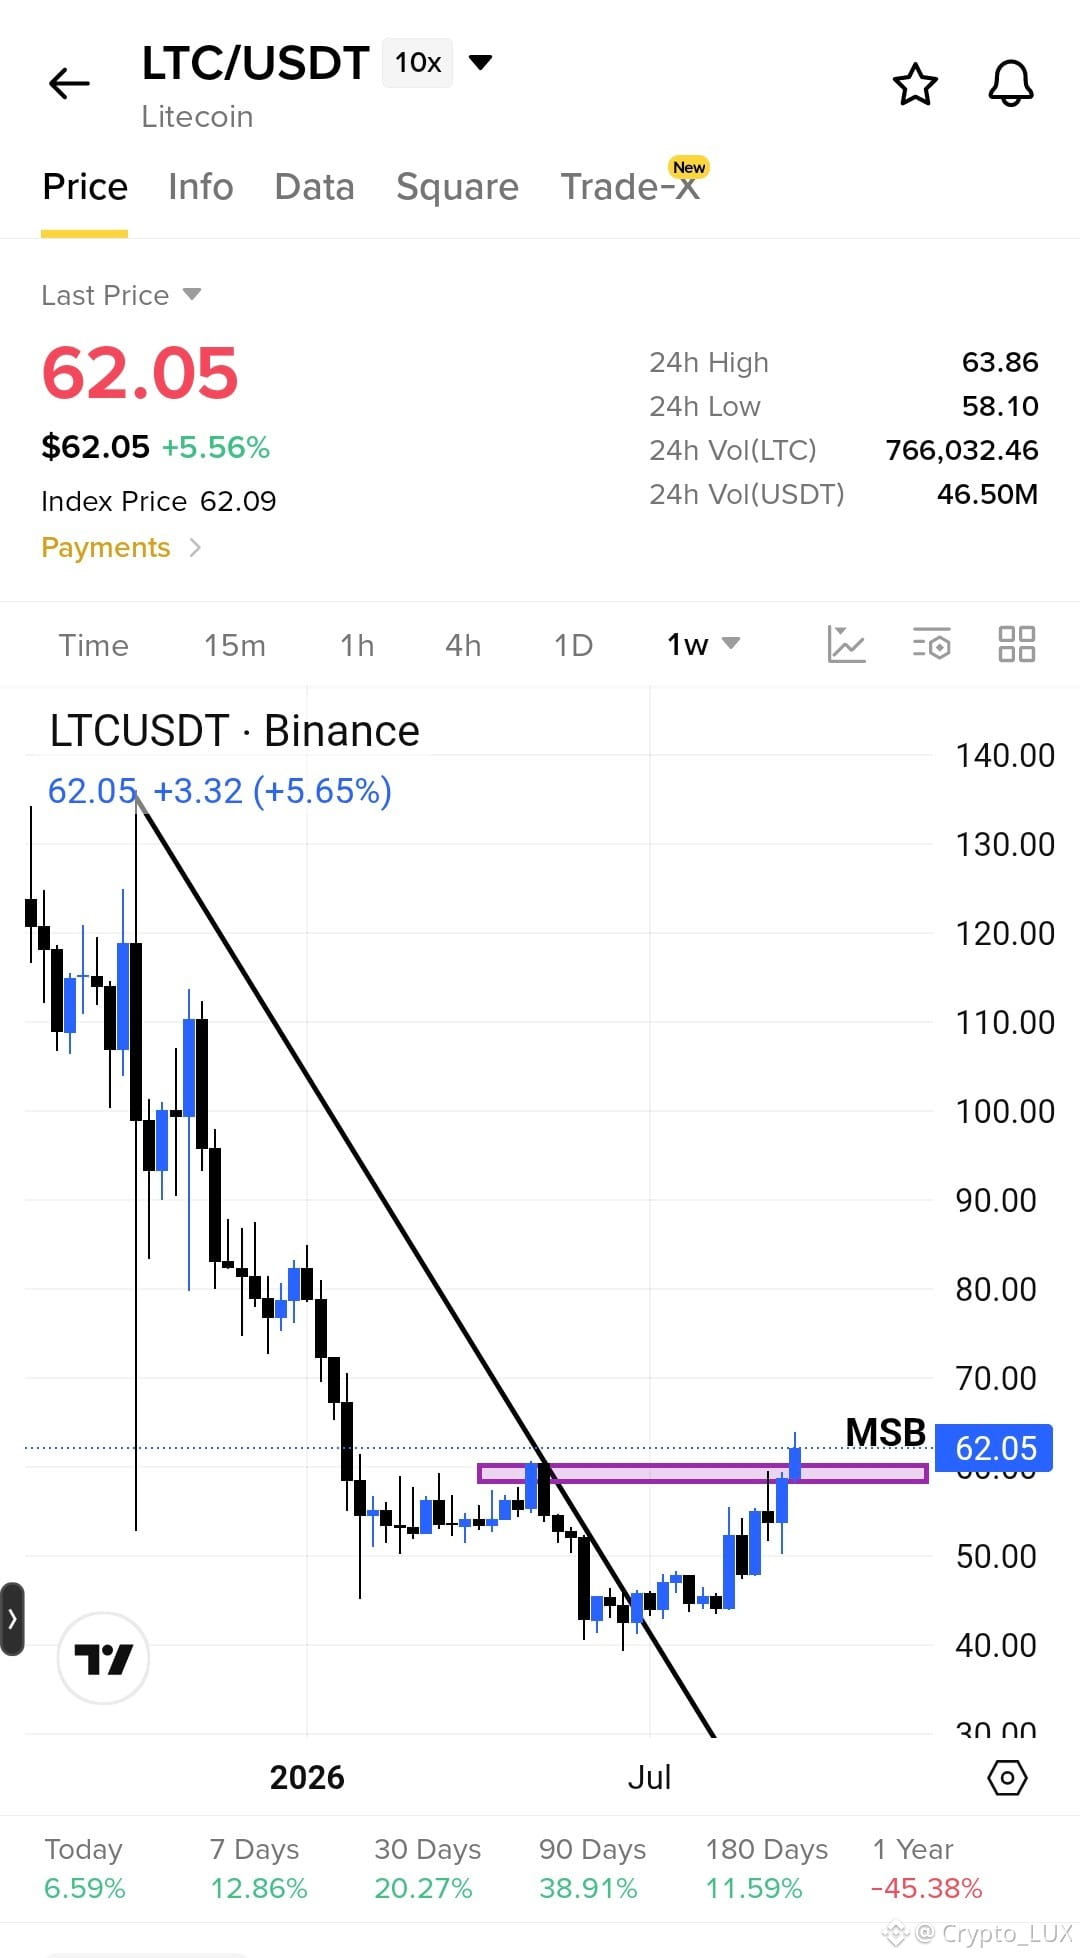
You know what happens when structure shifts on the weekly? As you guys seen the BTC…
$LTC along with the structure break on $BTC
Exactly what you would be thinking. It’s ready to blast.
We have broken and retested the weekly downtrend, along with a market structure break, indicating a massive move ahead.
My entries are around $60, with DCA margin down to $55, and SL below $50.
First target will be $70, where I will make it a risk-free trade, followed by $75, $80, and $85.
and yes, You'll be in profits you if you picked my call on $SUI .
Shift SL to entry once 0.99$ hits.
Protecting Capital is my first priority.
it's about growing together and protecting each other.
#NEARRisesNearly80%InAWeek
#LTCPricePrediction
{future}(LTCUSDT)
{future}(BTCUSDT)
{future}(SUIUSDT)
You know what happens when structure shifts on the weekly? As you guys seen the BTC…
$LTC along with the structure break on $BTC
Exactly what you would be thinking. It’s ready to blast.
We have broken and retested the weekly downtrend, along with a market structure break, indicating a massive move ahead.
My entries are around $60, with DCA margin down to $55, and SL below $50.
First target will be $70, where I will make it a risk-free trade, followed by $75, $80, and $85.
and yes, You'll be in profits you if you picked my call on $SUI .
Shift SL to entry once 0.99$ hits.
Protecting Capital is my first priority.
it's about growing together and protecting each other.
#NEARRisesNearly80%InAWeek
#LTCPricePrediction
$LTC along with the structure break on $BTC
Exactly what you would be thinking. It’s ready to blast.
We have broken and retested the weekly downtrend, along with a market structure break, indicating a massive move ahead.
My entries are around $60, with DCA margin down to $55, and SL below $50.
First target will be $70, where I will make it a risk-free trade, followed by $75, $80, and $85.
and yes, You'll be in profits you if you picked my call on $SUI .
Shift SL to entry once 0.99$ hits.
Protecting Capital is my first priority.
it's about growing together and protecting each other.
#NEARRisesNearly80%InAWeek
#LTCPricePrediction
1
13
2.7k

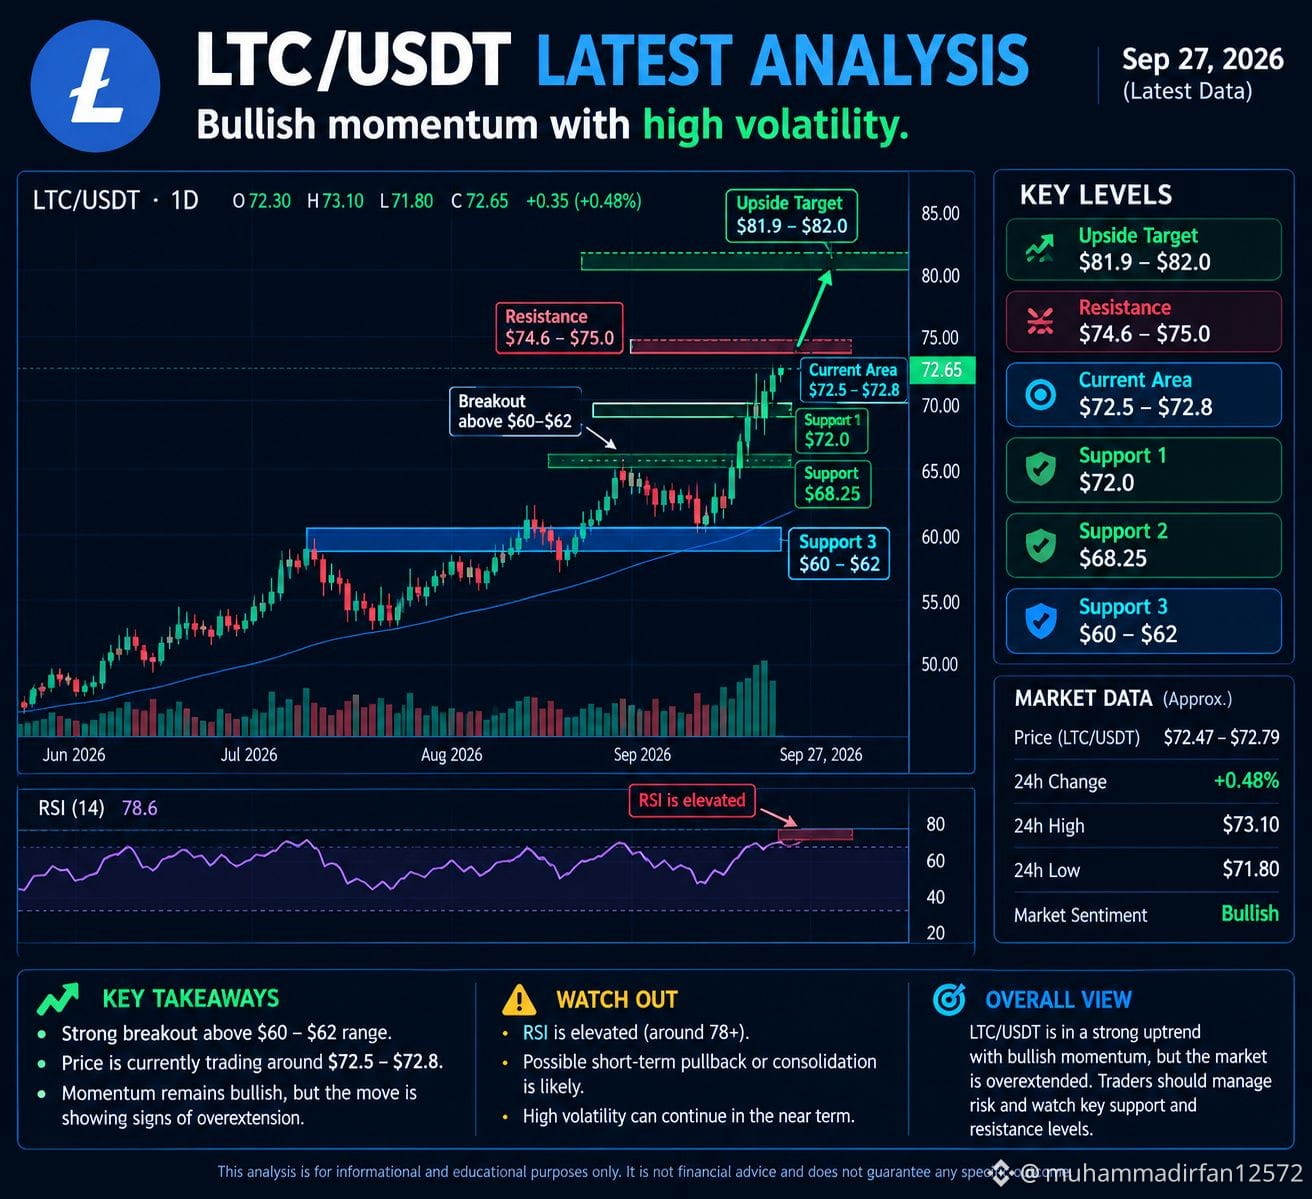
$LTC /USDT Latest Analysis
* **Current area:** $72.5–$72.8
* **Resistance:** $74.6–$75.0
* **Upside target:** $81.9–$82.0 if price breaks and holds above resistance
* **Support 1:** $72.0
* **Support 2:** $68.25
* **Major support:** $60–$62
* **Momentum:** Bullish, but short-term momentum looks extended.
* **RSI:** Around 78, indicating elevated/overbought conditions.
Market View
$LTC is showing strong bullish momentum after breaking above the **$60–$62** zone. A confirmed breakout above **$74.6–$75** could open the way toward the **$81.9–$82** area. However, because RSI is elevated, a short-term pullback or consolidation is also possible.
**Key levels to watch:** $75 resistance and $72 / $68.25 support.
#LTC📈 #LTCPricePrediction #Launchpool #LTC/USD
$LTC /USDT Latest Analysis
* **Current area:** $72.5–$72.8
* **Resistance:** $74.6–$75.0
* **Upside target:** $81.9–$82.0 if price breaks and holds above resistance
* **Support 1:** $72.0
* **Support 2:** $68.25
* **Major support:** $60–$62
* **Momentum:** Bullish, but short-term momentum looks extended.
* **RSI:** Around 78, indicating elevated/overbought conditions.
Market View
$LTC is showing strong bullish momentum after breaking above the **$60–$62** zone. A confirmed breakout above **$74.6–$75** could open the way toward the **$81.9–$82** area. However, because RSI is elevated, a short-term pullback or consolidation is also possible.
**Key levels to watch:** $75 resistance and $72 / $68.25 support.
#LTC📈 #LTCPricePrediction #Launchpool #LTC/USD
* **Current area:** $72.5–$72.8
* **Resistance:** $74.6–$75.0
* **Upside target:** $81.9–$82.0 if price breaks and holds above resistance
* **Support 1:** $72.0
* **Support 2:** $68.25
* **Major support:** $60–$62
* **Momentum:** Bullish, but short-term momentum looks extended.
* **RSI:** Around 78, indicating elevated/overbought conditions.
Market View
$LTC is showing strong bullish momentum after breaking above the **$60–$62** zone. A confirmed breakout above **$74.6–$75** could open the way toward the **$81.9–$82** area. However, because RSI is elevated, a short-term pullback or consolidation is also possible.
**Key levels to watch:** $75 resistance and $72 / $68.25 support.
#LTC📈 #LTCPricePrediction #Launchpool #LTC/USD
120

·
--
Bullish
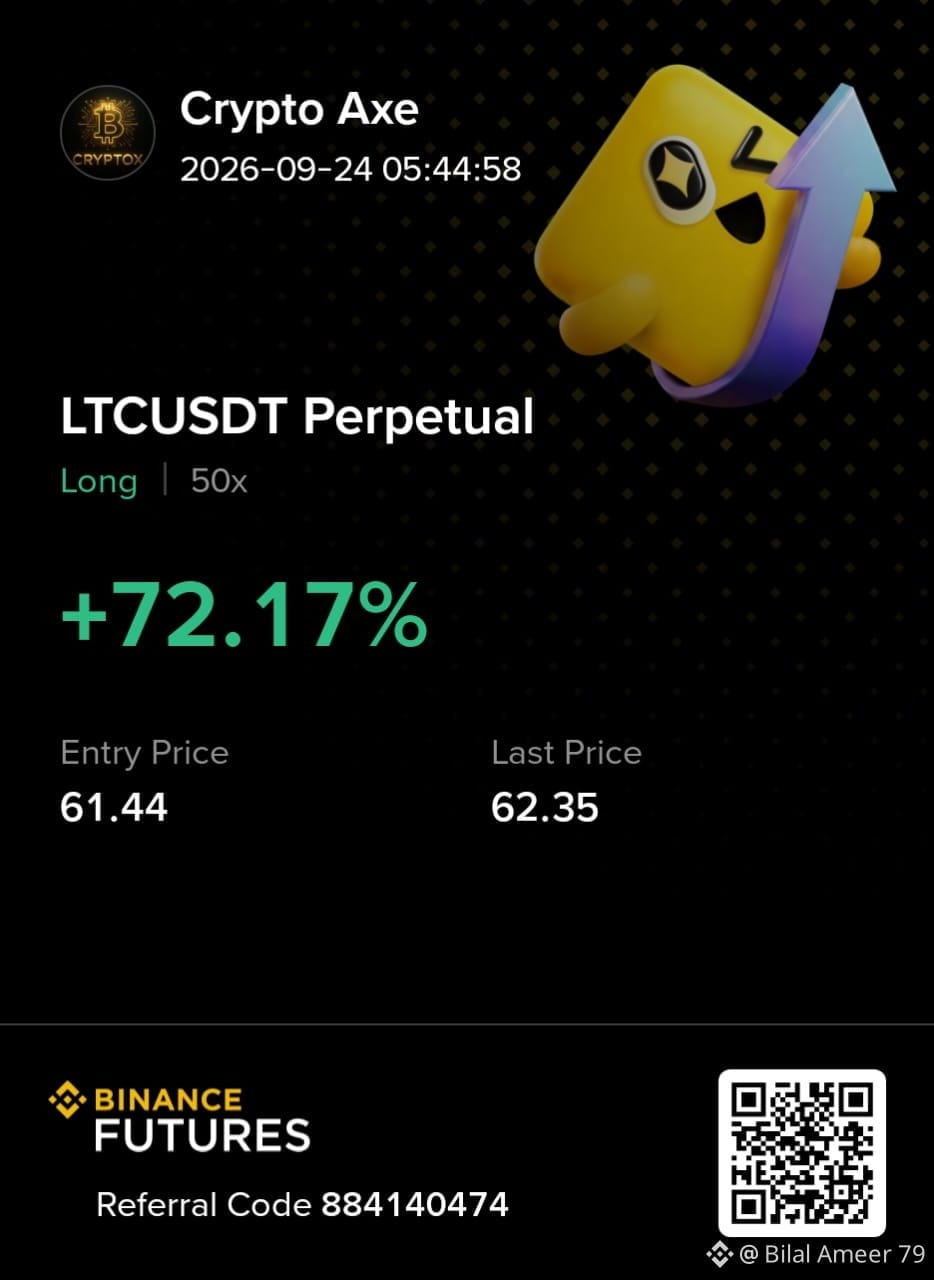
🚀 LTC/USDT — TRADE UPDATE 🚀
🎯 TP1 HIT SUCCESSFULLY! ✅💰
📊 Price respected our key levels and the setup played out as planned.
🔥 Plan → Patience → Execution → Results
💰 First profit secured
🔥 Follow for more market analysis & trading setups
DYOR • Manage Risk • Stay Disciplined
$LTC
{spot}(LTCUSDT)
#LTCPricePrediction
#BinanceSquareFamily
#analysis
#BinanceExplorers 🚀🚀
🚀 LTC/USDT — TRADE UPDATE 🚀
🎯 TP1 HIT SUCCESSFULLY! ✅💰
📊 Price respected our key levels and the setup played out as planned.
🔥 Plan → Patience → Execution → Results
💰 First profit secured
🔥 Follow for more market analysis & trading setups
DYOR • Manage Risk • Stay Disciplined
$LTC
#LTCPricePrediction
#BinanceSquareFamily
#analysis
#BinanceExplorers 🚀🚀
🎯 TP1 HIT SUCCESSFULLY! ✅💰
📊 Price respected our key levels and the setup played out as planned.
🔥 Plan → Patience → Execution → Results
💰 First profit secured
🔥 Follow for more market analysis & trading setups
DYOR • Manage Risk • Stay Disciplined
$LTC
#LTCPricePrediction
#BinanceSquareFamily
#analysis
#BinanceExplorers 🚀🚀
1
115

·
--
Estimates for the price of 1 Litecoin (LTC) in 2030 range significantly from around $50 to upwards of $1,000, depending on whether you look at conservative algorithmic models or more optimistic industry projections. #LTCPricePrediction
Estimates for the price of 1 Litecoin (LTC) in 2030 range significantly from around $50 to upwards of $1,000, depending on whether you look at conservative algorithmic models or more optimistic industry projections. #LTCPricePrediction
175
Log in to explore more content
Join global crypto users on Binance Square
⚡️ Get latest and useful information about crypto.
💬 Trusted by the world’s largest crypto exchange.
👍 Discover real insights from verified creators.
Email / Phone number
Trending Topics
1
#CPITestsDecemberRateOutlook
778,775 views
3,895 Discussing
2
#AnthropicRejectsIPODelayValuationinQuestion
98,352 views
897 Discussing
3
#NvidiaInvestigatesAfterHuang’sAffairApology
331,767 views
2,425 Discussing
4
#CanNvidiaEarningsEaseMarketConcerns?
3,238 views
91 Discussing
5
#US-IranTalksFuelStrongStockMarketRebound
36,150 views
324 Discussing
6
#BitcoinFiveWeeklyLosses
354,355 views
2,769 Discussing
7
#AIChipSlumpNasdaq
201,151 views
1,637 Discussing
8
#BitcoinSpotETFsPost$201MNetOutflowForThirdStraightDay
761 views
11 Discussing
9
#CryptoLiquidationsReach$1.16BIn24Hours
40,137 views
67 Discussing
10
#TradFiForBeginners
405,117 views
2,751 Discussing