
#hype
hype
12M views
57,950 Discussing
Hot
Latest

·
--
🔥 $HYPE : $3 MILLION IN DAILY REVENUE — BUT THE TOKEN IS STILL UNDER PRESSURE!
Hyperliquid is showing strong protocol activity despite recent market weakness:
- $3.04M revenue: Hyperliquid reportedly led protocols in revenue on November 15.
- $70.4M protocol revenue: DefiLlama data shows this over the past 30 days.
- Daily buybacks: The Assistance Fund reportedly bought back 39,293 on November 15.
- Ecosystem expansion: Elysium Layer 2 went live on November 9, using as its gas token.
- Market pressure: $HYPE remained down around 9.8% over seven days as of November 16.
Key takeaway: Revenue and buybacks are notable, but they don't guarantee a token-price recovery.
$HYPE
{future}(HYPEUSDT)
.
.
.
#HYPE #Hyperliquid #crypto
Not financial advice. DYOR.
🔥 $HYPE : $3 MILLION IN DAILY REVENUE — BUT THE TOKEN IS STILL UNDER PRESSURE!
Hyperliquid is showing strong protocol activity despite recent market weakness:
- $3.04M revenue: Hyperliquid reportedly led protocols in revenue on November 15.
- $70.4M protocol revenue: DefiLlama data shows this over the past 30 days.
- Daily buybacks: The Assistance Fund reportedly bought back 39,293 on November 15.
- Ecosystem expansion: Elysium Layer 2 went live on November 9, using as its gas token.
- Market pressure: $HYPE remained down around 9.8% over seven days as of November 16.
Key takeaway: Revenue and buybacks are notable, but they don't guarantee a token-price recovery.
$HYPE
.
.
.
#HYPE #Hyperliquid #crypto
Not financial advice. DYOR.
Hyperliquid is showing strong protocol activity despite recent market weakness:
- $3.04M revenue: Hyperliquid reportedly led protocols in revenue on November 15.
- $70.4M protocol revenue: DefiLlama data shows this over the past 30 days.
- Daily buybacks: The Assistance Fund reportedly bought back 39,293 on November 15.
- Ecosystem expansion: Elysium Layer 2 went live on November 9, using as its gas token.
- Market pressure: $HYPE remained down around 9.8% over seven days as of November 16.
Key takeaway: Revenue and buybacks are notable, but they don't guarantee a token-price recovery.
$HYPE
.
.
.
#HYPE #Hyperliquid #crypto
Not financial advice. DYOR.

1
354

·
--
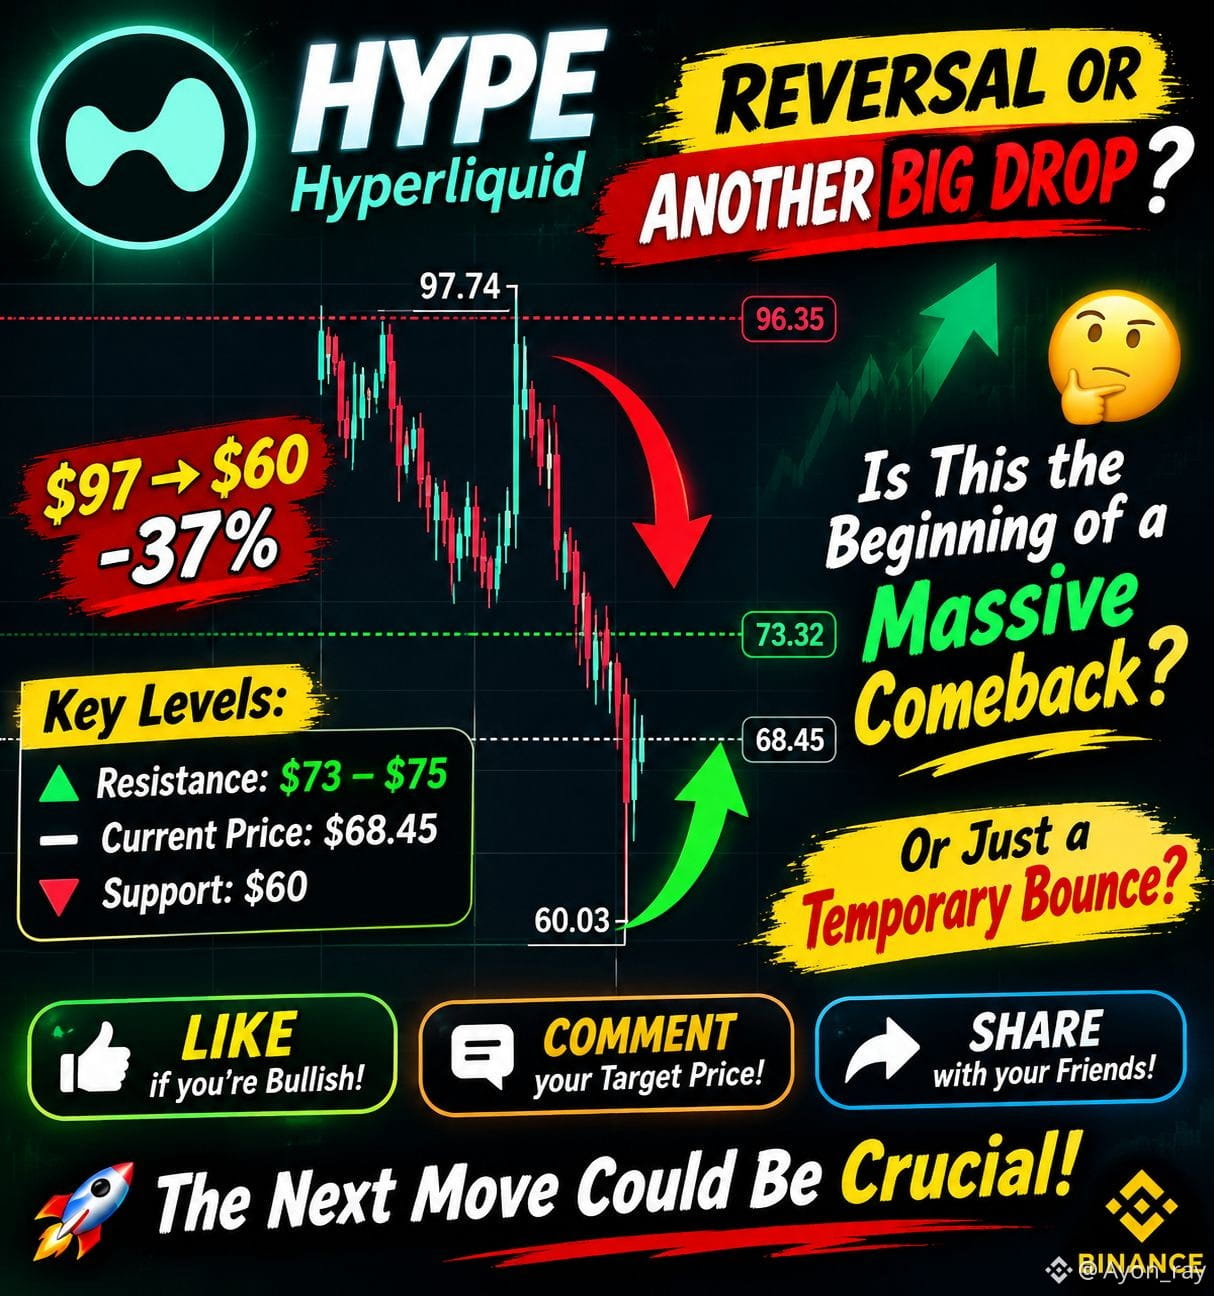
🚨 $HYPE REVERSAL OR ANOTHER BIG DROP? 👀
From $97 to $60… $HYPE has taken a serious hit! 📉
But now, something interesting is happening. The price is showing a small recovery around $68.45.
🐂 Is this the beginning of a massive comeback? 🐻 Or just a temporary bounce before another dip?
🎯 Key levels to watch:
Support: $60
Current Price: $68.45
Resistance: $73–75
The next move could be crucial! 🚀
🔥 What’s your prediction for $HYPE ?
❤️ LIKE if you're bullish! 💬 COMMENT your target price! 🔁 SHARE with your crypto friends!
#hype #Hyperliquid #crypto #BinanceSquare #Altcoins
{spot}(HYPEUSDT)
🚨 $HYPE REVERSAL OR ANOTHER BIG DROP? 👀
From $97 to $60… $HYPE has taken a serious hit! 📉
But now, something interesting is happening. The price is showing a small recovery around $68.45.
🐂 Is this the beginning of a massive comeback? 🐻 Or just a temporary bounce before another dip?
🎯 Key levels to watch:
Support: $60
Current Price: $68.45
Resistance: $73–75
The next move could be crucial! 🚀
🔥 What’s your prediction for $HYPE ?
❤️ LIKE if you're bullish! 💬 COMMENT your target price! 🔁 SHARE with your crypto friends!
#hype #Hyperliquid #crypto #BinanceSquare #Altcoins
From $97 to $60… $HYPE has taken a serious hit! 📉
But now, something interesting is happening. The price is showing a small recovery around $68.45.
🐂 Is this the beginning of a massive comeback? 🐻 Or just a temporary bounce before another dip?
🎯 Key levels to watch:
Support: $60
Current Price: $68.45
Resistance: $73–75
The next move could be crucial! 🚀
🔥 What’s your prediction for $HYPE ?
❤️ LIKE if you're bullish! 💬 COMMENT your target price! 🔁 SHARE with your crypto friends!
#hype #Hyperliquid #crypto #BinanceSquare #Altcoins
2
378

·
--
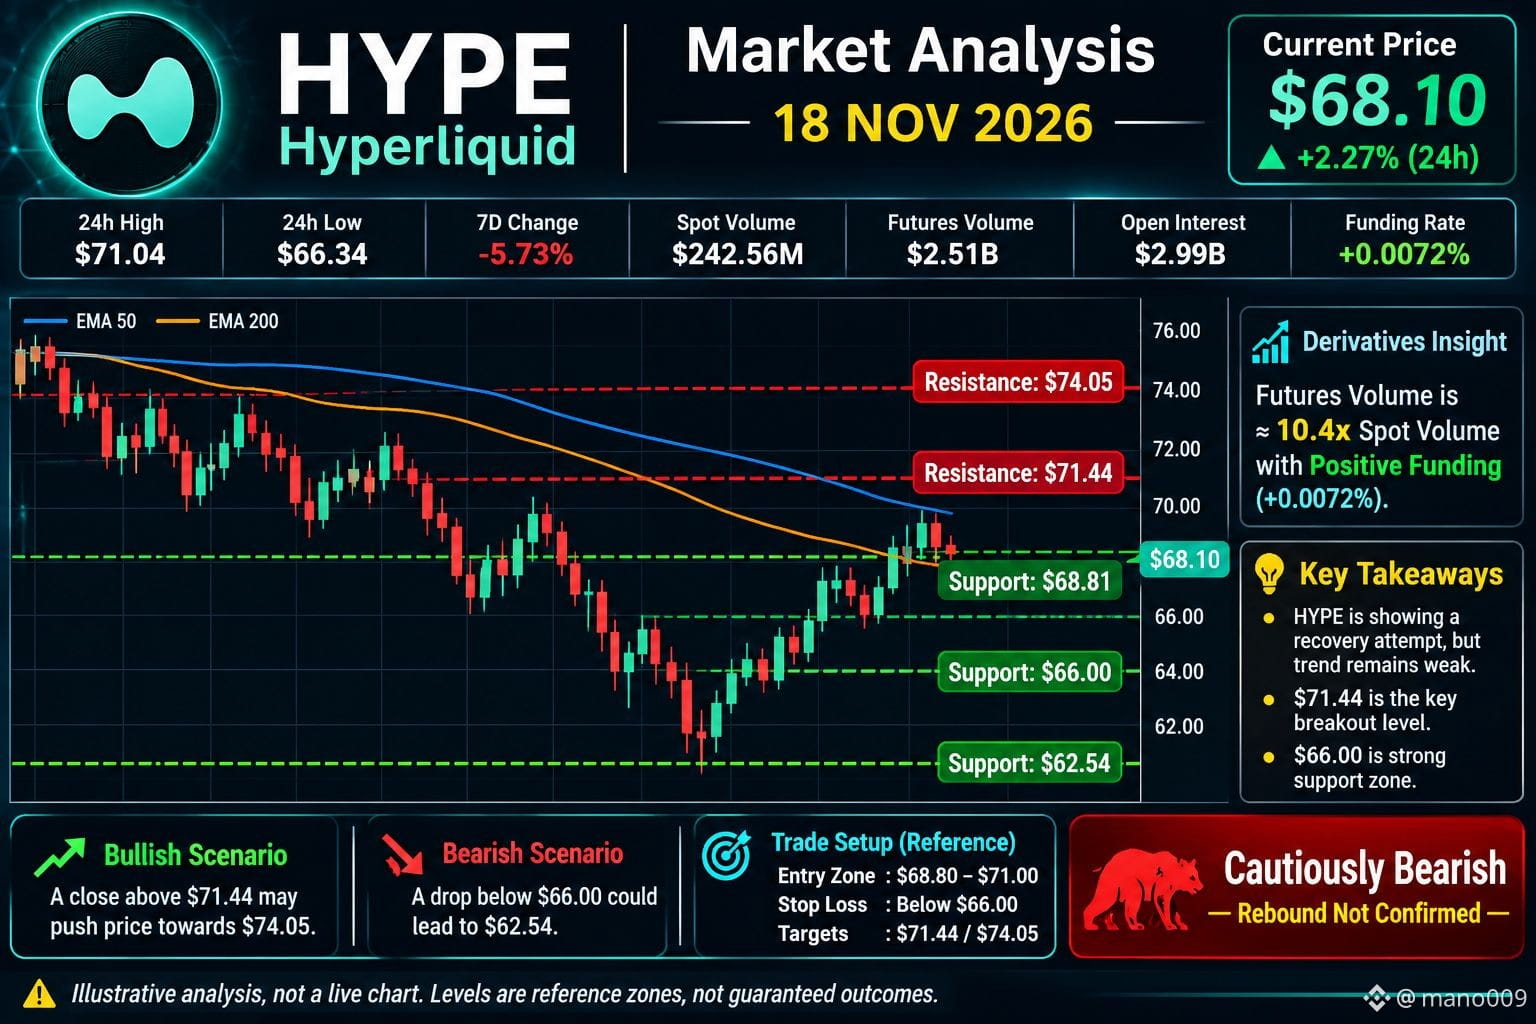
$HYPE is attempting a recovery, gaining 2.27% over 24 hours. However, the broader trend remains weak, with a 5.73% decline over seven days. The price is still approximately 30.5% below its September all-time high of $97.98.
1. Market structure and derivatives
24H high/low: $71.04 / $66.34
Market cap: $17.20 billion
Spot volume: $242.56 million
Futures volume: $2.51 billion
Open interest: $2.99 billion
Funding rate: +0.0072%
Futures volume is around 10 times spot volume, indicating substantial derivatives activity. Positive funding means long positions are paying shorts, but this alone does not confirm bullish momentum.
2. Technical analysis
Daily indicators show a bearish bias, with RSI around 37.6. The 4H trend is also bearish, although the 1H timeframe shows some recovery signals. This disagreement suggests the rebound is not yet a confirmed reversal.
Important level Price
Resistance 1 $71.44
Resistance 2 $74.05
Support 1 $66.00
Support 2 $62.54
3. Bullish vs bearish scenarios
A strong 4H close above $71.44, supported by rising spot volume, could open the way towards $74.05 and potentially $77.
Failure to reclaim $68.81 and a breakdown below $66 could expose $62.54, followed by the $60 area.
4. Fundamental outlook
Hyperliquid's Q3 performance showed significant growth in derivatives-market share, reaching 11.7% across eight major exchanges. However, reported quarterly bridge outflows of $953 million remain worth monitoring. Strong platform activity does not automatically mean immediate token-price appreciation.
Final verdict
$HYPE has recovery potential, but the daily trend remains bearish. I would watch $71.44 for a bullish confirmation and $66 for downside risk.
Risk management: Avoid chasing a green candle. Wait for a confirmed breakout or breakdown, use a predefined stop-loss, and keep leverage conservative.
#hype #BTC #BinanceSquareTalks
#BinanceSquareFamily
{spot}(HYPEUSDT)
$HYPE is attempting a recovery, gaining 2.27% over 24 hours. However, the broader trend remains weak, with a 5.73% decline over seven days. The price is still approximately 30.5% below its September all-time high of $97.98.
1. Market structure and derivatives
24H high/low: $71.04 / $66.34
Market cap: $17.20 billion
Spot volume: $242.56 million
Futures volume: $2.51 billion
Open interest: $2.99 billion
Funding rate: +0.0072%
Futures volume is around 10 times spot volume, indicating substantial derivatives activity. Positive funding means long positions are paying shorts, but this alone does not confirm bullish momentum.
2. Technical analysis
Daily indicators show a bearish bias, with RSI around 37.6. The 4H trend is also bearish, although the 1H timeframe shows some recovery signals. This disagreement suggests the rebound is not yet a confirmed reversal.
Important level Price
Resistance 1 $71.44
Resistance 2 $74.05
Support 1 $66.00
Support 2 $62.54
3. Bullish vs bearish scenarios
A strong 4H close above $71.44, supported by rising spot volume, could open the way towards $74.05 and potentially $77.
Failure to reclaim $68.81 and a breakdown below $66 could expose $62.54, followed by the $60 area.
4. Fundamental outlook
Hyperliquid's Q3 performance showed significant growth in derivatives-market share, reaching 11.7% across eight major exchanges. However, reported quarterly bridge outflows of $953 million remain worth monitoring. Strong platform activity does not automatically mean immediate token-price appreciation.
Final verdict
$HYPE has recovery potential, but the daily trend remains bearish. I would watch $71.44 for a bullish confirmation and $66 for downside risk.
Risk management: Avoid chasing a green candle. Wait for a confirmed breakout or breakdown, use a predefined stop-loss, and keep leverage conservative.
#hype #BTC #BinanceSquareTalks
#BinanceSquareFamily
1. Market structure and derivatives
24H high/low: $71.04 / $66.34
Market cap: $17.20 billion
Spot volume: $242.56 million
Futures volume: $2.51 billion
Open interest: $2.99 billion
Funding rate: +0.0072%
Futures volume is around 10 times spot volume, indicating substantial derivatives activity. Positive funding means long positions are paying shorts, but this alone does not confirm bullish momentum.
2. Technical analysis
Daily indicators show a bearish bias, with RSI around 37.6. The 4H trend is also bearish, although the 1H timeframe shows some recovery signals. This disagreement suggests the rebound is not yet a confirmed reversal.
Important level Price
Resistance 1 $71.44
Resistance 2 $74.05
Support 1 $66.00
Support 2 $62.54
3. Bullish vs bearish scenarios
A strong 4H close above $71.44, supported by rising spot volume, could open the way towards $74.05 and potentially $77.
Failure to reclaim $68.81 and a breakdown below $66 could expose $62.54, followed by the $60 area.
4. Fundamental outlook
Hyperliquid's Q3 performance showed significant growth in derivatives-market share, reaching 11.7% across eight major exchanges. However, reported quarterly bridge outflows of $953 million remain worth monitoring. Strong platform activity does not automatically mean immediate token-price appreciation.
Final verdict
$HYPE has recovery potential, but the daily trend remains bearish. I would watch $71.44 for a bullish confirmation and $66 for downside risk.
Risk management: Avoid chasing a green candle. Wait for a confirmed breakout or breakdown, use a predefined stop-loss, and keep leverage conservative.
#hype #BTC #BinanceSquareTalks
#BinanceSquareFamily
101

·
--
Article
🚨 Hyperliquid Hits a Massive Milestone: $4.2B Weekly Volume on Nvidia Pair🚨 Hyperliquid Hits a Massive Milestone: $4.2B Weekly Volume on Nvidia Pair!
On-chain perps are heating up. According to recent data, the $
Nvidia trading pair on Hyperliquid just smashed a weekly volume record of $4.2B—more than 4x its pre-November high—with Open Interest sitting at $476M.
Overall, Hyperliquid's average daily volume is back near late-August highs at $11.45B, with HIP-3 markets driving 34% of that action.
📊 Why This Matters for $HYPE
• Revenue Engine: Higher contract trading volume directly boosts platform fee revenue, which supports organic demand for $HYPE.
• Catalysts Ahead: Watch Nvidia’s upcoming earnings and the Nov. 19 Anthropic IPO closely—both events could bring another wave of volatility and volume.
• Sustainability Check: Keep an eye on Open Interest post-earnings. If volume and OI drop sharply after the news settles, this surge might just be short-term event hype.
Are you trading $HYPE or watching the AI-perp narrative play out? Let’s hear your thoughts below! 👇$NVDAB
#hype #Hyperliquid #CryptoNews
#defi #trading
🚨 Hyperliquid Hits a Massive Milestone: $4.2B Weekly Volume on Nvidia Pair
🚨 Hyperliquid Hits a Massive Milestone: $4.2B Weekly Volume on Nvidia Pair!
On-chain perps are heating up. According to recent data, the $
Nvidia trading pair on Hyperliquid just smashed a weekly volume record of $4.2B—more than 4x its pre-November high—with Open Interest sitting at $476M.
Overall, Hyperliquid's average daily volume is back near late-August highs at $11.45B, with HIP-3 markets driving 34% of that action.
📊 Why This Matters for $HYPE
• Revenue Engine: Higher contract trading volume directly boosts platform fee revenue, which supports organic demand for $HYPE .
• Catalysts Ahead: Watch Nvidia’s upcoming earnings and the Nov. 19 Anthropic IPO closely—both events could bring another wave of volatility and volume.
• Sustainability Check: Keep an eye on Open Interest post-earnings. If volume and OI drop sharply after the news settles, this surge might just be short-term event hype.
Are you trading $HYPE or watching the AI-perp narrative play out? Let’s hear your thoughts below! 👇$NVDAB
#hype #Hyperliquid #CryptoNews
#defi #trading
On-chain perps are heating up. According to recent data, the $
Nvidia trading pair on Hyperliquid just smashed a weekly volume record of $4.2B—more than 4x its pre-November high—with Open Interest sitting at $476M.
Overall, Hyperliquid's average daily volume is back near late-August highs at $11.45B, with HIP-3 markets driving 34% of that action.
📊 Why This Matters for $HYPE
• Revenue Engine: Higher contract trading volume directly boosts platform fee revenue, which supports organic demand for $HYPE .
• Catalysts Ahead: Watch Nvidia’s upcoming earnings and the Nov. 19 Anthropic IPO closely—both events could bring another wave of volatility and volume.
• Sustainability Check: Keep an eye on Open Interest post-earnings. If volume and OI drop sharply after the news settles, this surge might just be short-term event hype.
Are you trading $HYPE or watching the AI-perp narrative play out? Let’s hear your thoughts below! 👇$NVDAB
#hype #Hyperliquid #CryptoNews
#defi #trading
453

·
--
🔥 $HYPE is green while the market bleeds
Fear & Greed Index is at 12 (Extreme Fear), yet Hyperliquid keeps showing strength. 👀
📊 Snapshot
• Price: ~$70
• 24h change: +5.7%
• 24h volume: ~$1.47B
• Rank: Top 10
• BTC for comparison: still stuck around $65K
🧠 Why it's worth watching
When most of the market is red, coins that hold up and rebound on real volume usually draw attention. Strong volume matters more than a green candle alone, because it shows real participation.
🔍 What to watch next
• Does volume stay strong or fade?
• Does BTC hold the $62K–$63K support? A drop there could pull altcoins down too.
💬 Are you watching $HYPE or waiting for calmer markets? Comment below 👇
⚠️ Not financial advice. Crypto is highly volatile. Always DYOR and never invest more than you can afford to lose.
#hype #Hyperliquid #Binance #crypto
{spot}(HYPEUSDT)
🔥 $HYPE is green while the market bleeds
Fear & Greed Index is at 12 (Extreme Fear), yet Hyperliquid keeps showing strength. 👀
📊 Snapshot
• Price: ~$70
• 24h change: +5.7%
• 24h volume: ~$1.47B
• Rank: Top 10
• BTC for comparison: still stuck around $65K
🧠 Why it's worth watching
When most of the market is red, coins that hold up and rebound on real volume usually draw attention. Strong volume matters more than a green candle alone, because it shows real participation.
🔍 What to watch next
• Does volume stay strong or fade?
• Does BTC hold the $62K–$63K support? A drop there could pull altcoins down too.
💬 Are you watching $HYPE or waiting for calmer markets? Comment below 👇
⚠️ Not financial advice. Crypto is highly volatile. Always DYOR and never invest more than you can afford to lose.
#hype #Hyperliquid #Binance #crypto
Fear & Greed Index is at 12 (Extreme Fear), yet Hyperliquid keeps showing strength. 👀
📊 Snapshot
• Price: ~$70
• 24h change: +5.7%
• 24h volume: ~$1.47B
• Rank: Top 10
• BTC for comparison: still stuck around $65K
🧠 Why it's worth watching
When most of the market is red, coins that hold up and rebound on real volume usually draw attention. Strong volume matters more than a green candle alone, because it shows real participation.
🔍 What to watch next
• Does volume stay strong or fade?
• Does BTC hold the $62K–$63K support? A drop there could pull altcoins down too.
💬 Are you watching $HYPE or waiting for calmer markets? Comment below 👇
⚠️ Not financial advice. Crypto is highly volatile. Always DYOR and never invest more than you can afford to lose.
#hype #Hyperliquid #Binance #crypto

260

·
--
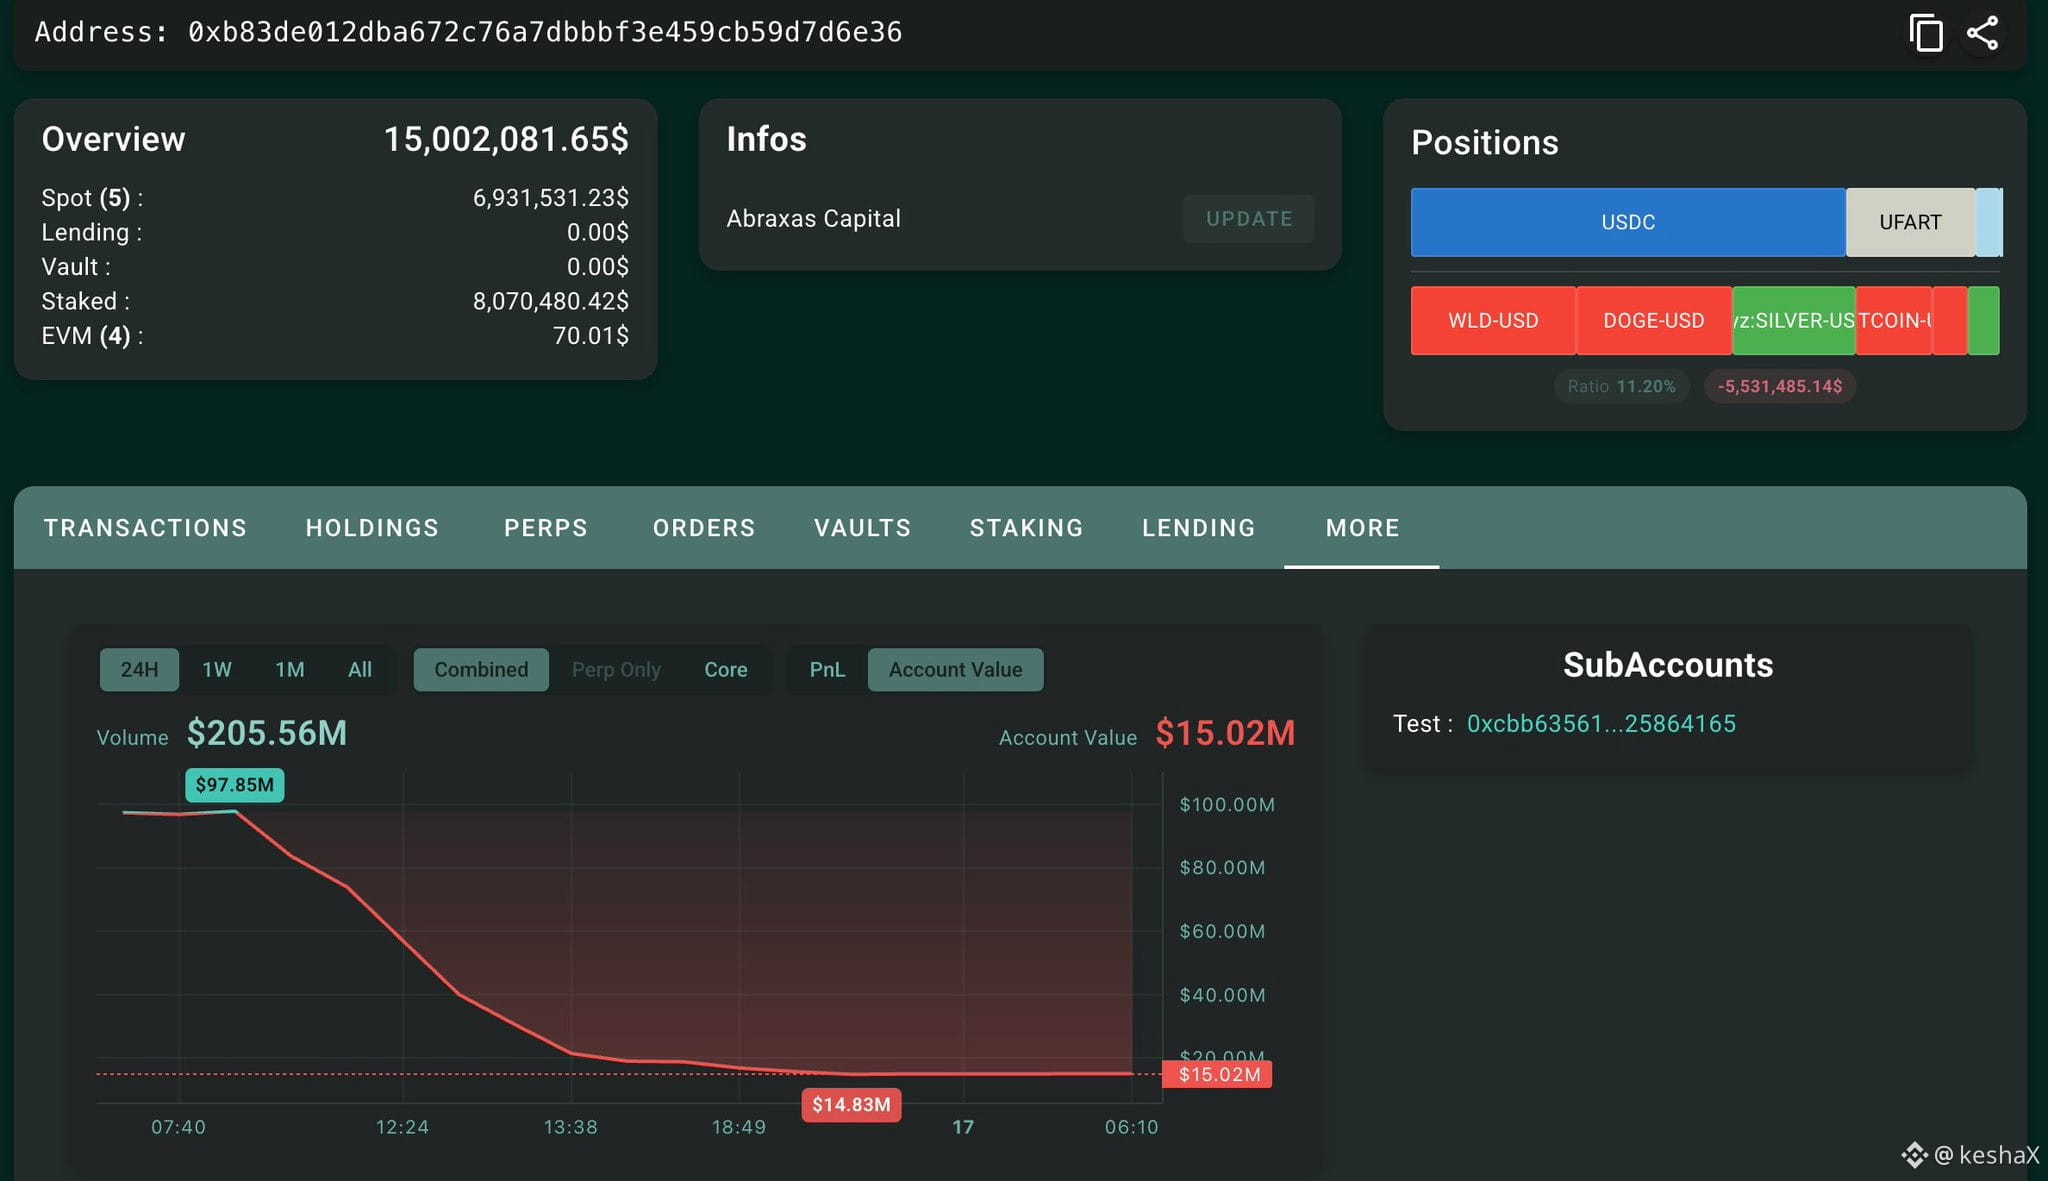
🚨 $HYPE BACK NEAR $70 AFTER ABRAXAS PULLED THE PLUG
One leaked API key on Lighter, and a famous hedge-fund whale unwinds on Hyperliquid.
→ $10.4M traced out of Lighter, up to ~$15.5M across two market-maker accounts
→ On-chain sleuths tie one of them to Abraxas Capital (no comment from the firm yet)
→ Abraxas closed almost all its Hyperliquid shorts, only $11.6M still open
→ Account value down $161M in 24h, to $22.4M
→ ~$60.6M of HYPE sold in 70 minutes
HYPE dipped to $65.11 and bounced.
Still trading through API keys after this: yes or no?
#Hyperliquid #HYPE #CryptoSelloffTriggersMultipleWhaleLiquidations #CryptoNews
🚨 $HYPE BACK NEAR $70 AFTER ABRAXAS PULLED THE PLUG
One leaked API key on Lighter, and a famous hedge-fund whale unwinds on Hyperliquid.
→ $10.4M traced out of Lighter, up to ~$15.5M across two market-maker accounts
→ On-chain sleuths tie one of them to Abraxas Capital (no comment from the firm yet)
→ Abraxas closed almost all its Hyperliquid shorts, only $11.6M still open
→ Account value down $161M in 24h, to $22.4M
→ ~$60.6M of HYPE sold in 70 minutes
HYPE dipped to $65.11 and bounced.
Still trading through API keys after this: yes or no?
#Hyperliquid #HYPE #CryptoSelloffTriggersMultipleWhaleLiquidations #CryptoNews
One leaked API key on Lighter, and a famous hedge-fund whale unwinds on Hyperliquid.
→ $10.4M traced out of Lighter, up to ~$15.5M across two market-maker accounts
→ On-chain sleuths tie one of them to Abraxas Capital (no comment from the firm yet)
→ Abraxas closed almost all its Hyperliquid shorts, only $11.6M still open
→ Account value down $161M in 24h, to $22.4M
→ ~$60.6M of HYPE sold in 70 minutes
HYPE dipped to $65.11 and bounced.
Still trading through API keys after this: yes or no?
#Hyperliquid #HYPE #CryptoSelloffTriggersMultipleWhaleLiquidations #CryptoNews
107

🚀 $HYPE COIN — BIG VOLATILITY ALERT!
Hyperliquid is attracting serious market attention!
💰 Price: $69.29
📈 24H Change: +4.60%
📊 $HYPE /USDT TRADING WATCH
🟢 Entry: Above $71.10 after breakout confirmation
🎯 TP1: $72.50
🎯 TP2: $74.00
🎯 TP3: $76.00
🛑 SL: $68.20
⚠️ Daily trend remains weak. Wait for confirmation before entering LONG.
Can HYPE reach $75?
LIKE SHARE 🔁 FOLLOW for more crypto signals!
#HYPE #Hyperliquid #hypeusdt #BinanceSquare #CryptoSignals #Altcoins #CryptoTrading
🚀 $HYPE COIN — BIG VOLATILITY ALERT!
Hyperliquid is attracting serious market attention!
💰 Price: $69.29
📈 24H Change: +4.60%
📊 $HYPE /USDT TRADING WATCH
🟢 Entry: Above $71.10 after breakout confirmation
🎯 TP1: $72.50
🎯 TP2: $74.00
🎯 TP3: $76.00
🛑 SL: $68.20
⚠️ Daily trend remains weak. Wait for confirmation before entering LONG.
Can HYPE reach $75?
LIKE SHARE 🔁 FOLLOW for more crypto signals!
#HYPE #Hyperliquid #hypeusdt #BinanceSquare #CryptoSignals #Altcoins #CryptoTrading
Hyperliquid is attracting serious market attention!
💰 Price: $69.29
📈 24H Change: +4.60%
📊 $HYPE /USDT TRADING WATCH
🟢 Entry: Above $71.10 after breakout confirmation
🎯 TP1: $72.50
🎯 TP2: $74.00
🎯 TP3: $76.00
🛑 SL: $68.20
⚠️ Daily trend remains weak. Wait for confirmation before entering LONG.
Can HYPE reach $75?
LIKE SHARE 🔁 FOLLOW for more crypto signals!
#HYPE #Hyperliquid #hypeusdt #BinanceSquare #CryptoSignals #Altcoins #CryptoTrading
31

·
--
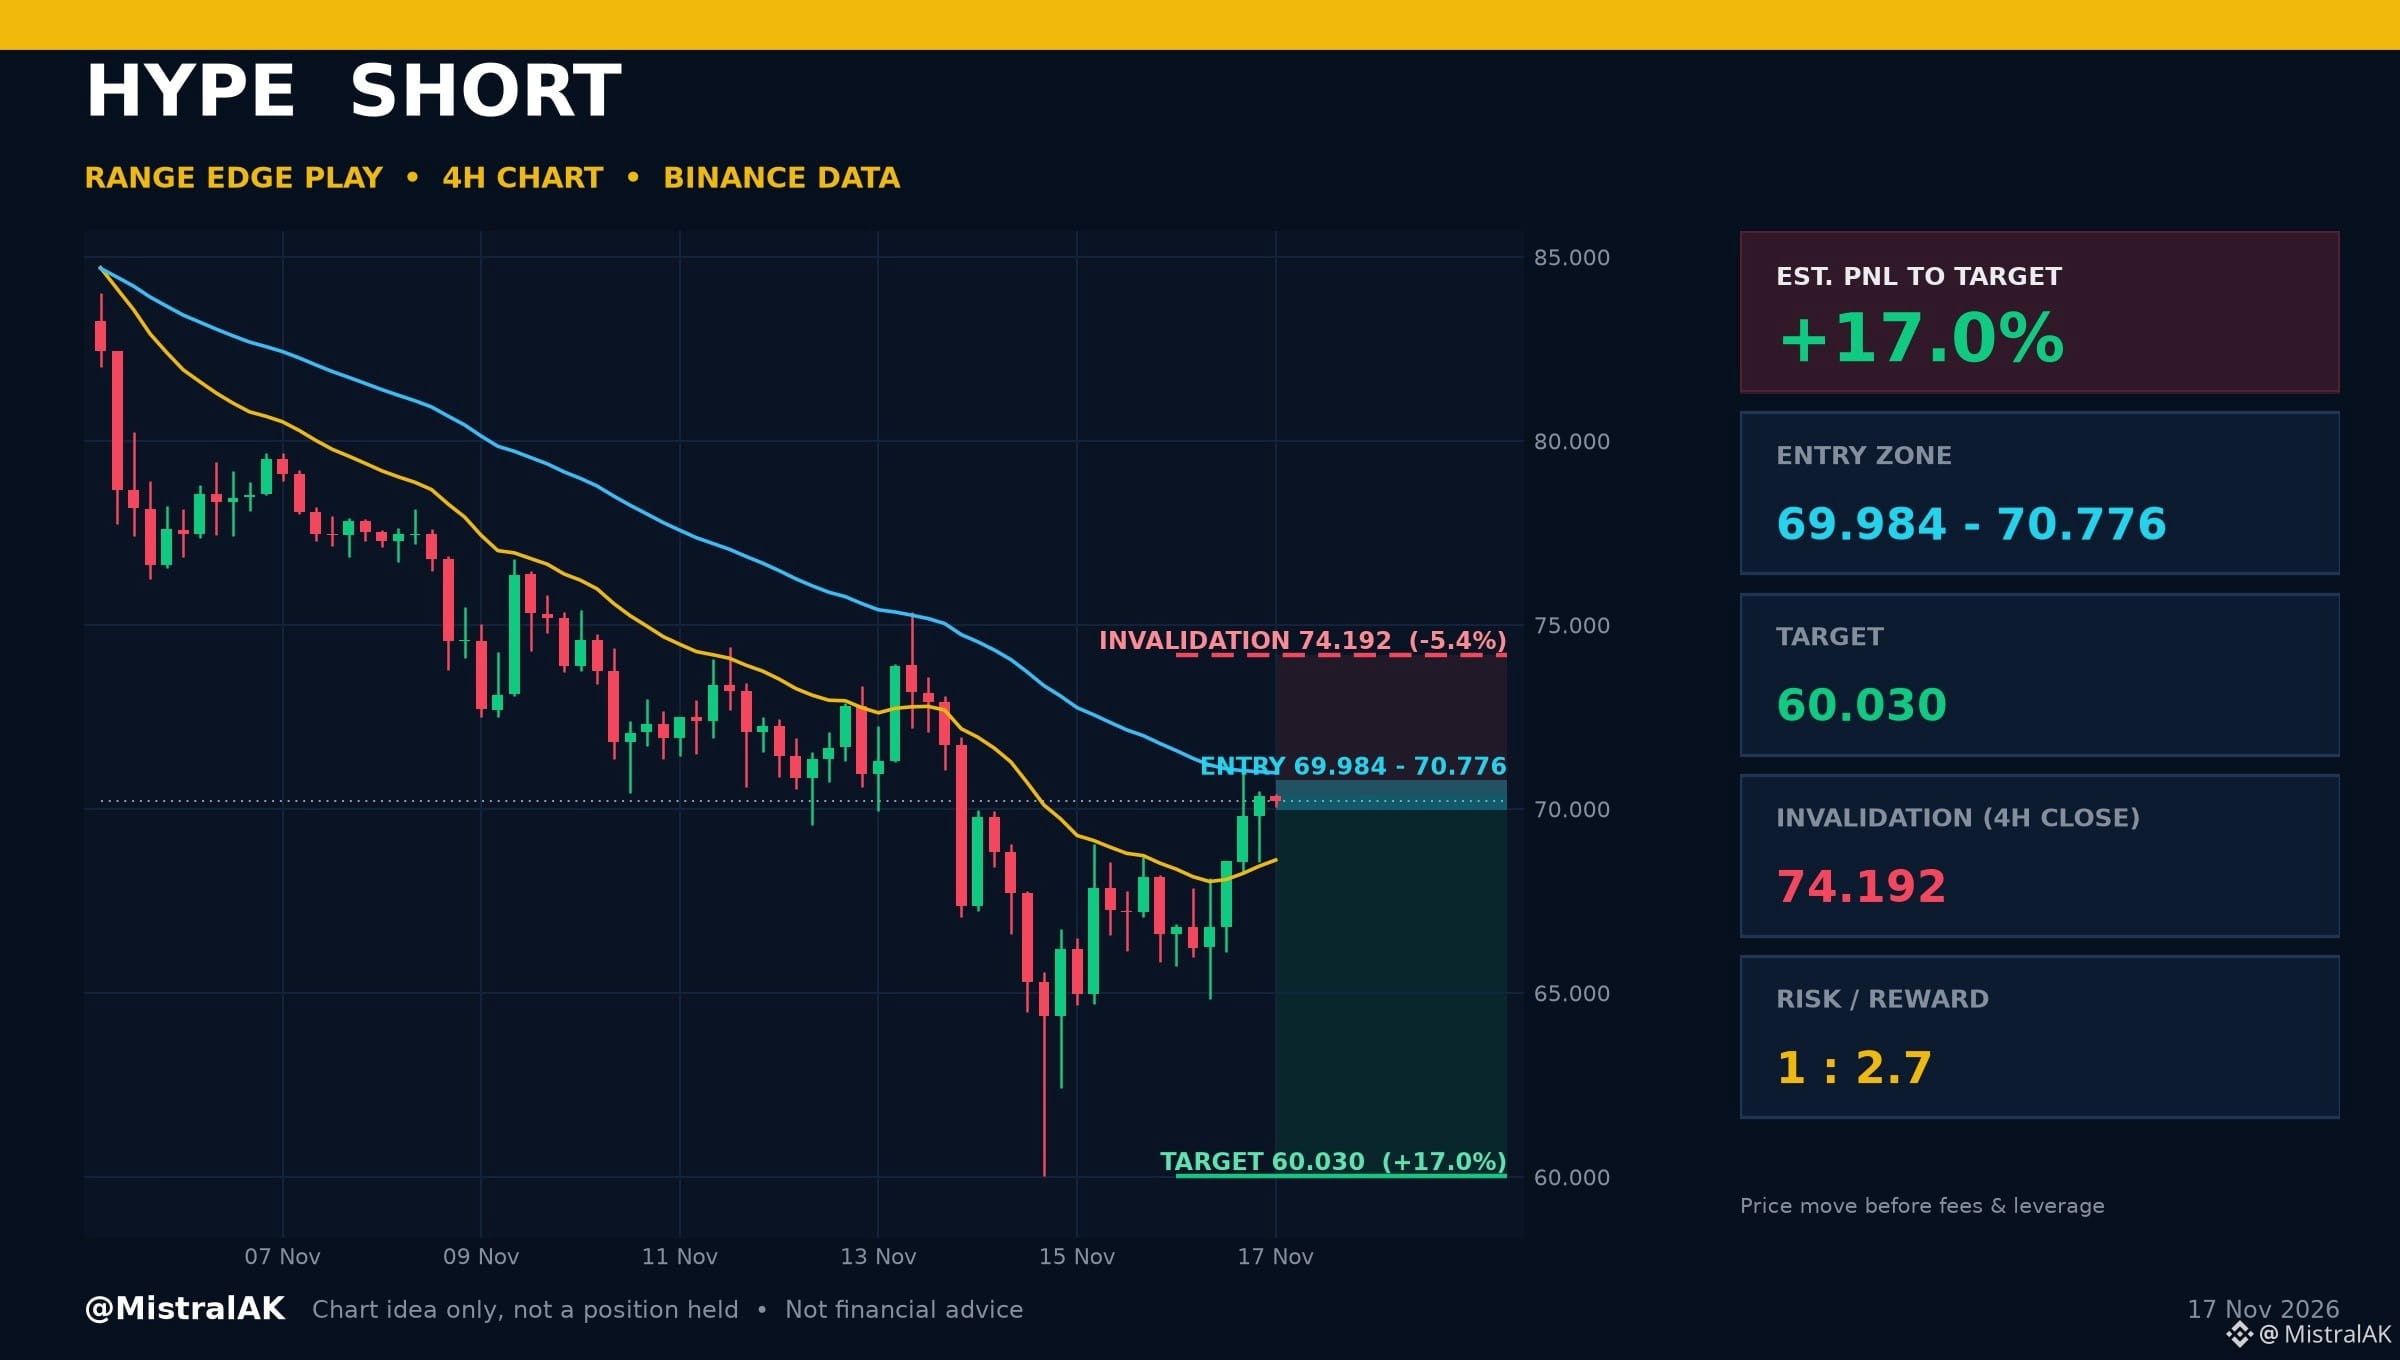
$HYPE Short | Est. PNL +17.0%: Range Edge Play
Entry zone: 69.984 - 70.776 USD
Target: 60.030 USD (range low)
Invalidation: 4H close above 74.192 USD
Risk/Reward: 1 : 2.7
Est. PNL to target: +17.0% | to invalidation: -5.4% (price move from 70.210 USD, before fees and leverage)
WHY THIS LEVEL
▪️ Price is moving between support and resistance with mixed EMA signals
▪️ 4H RSI 54.3 (neutral)
A 4H close above 74.192 USD cancels the idea. Chart idea only, not a position I hold.
Would you take this one, wait for more, or stay out? Tell us why below.
Not financial advice. Always DYOR.
Like & Follow for Daily Trade Analytics & Insider News. @MistralAK
#HYPE #TechnicalAnalysis #TradingSignals
$HYPE Short | Est. PNL +17.0%: Range Edge Play
Entry zone: 69.984 - 70.776 USD
Target: 60.030 USD (range low)
Invalidation: 4H close above 74.192 USD
Risk/Reward: 1 : 2.7
Est. PNL to target: +17.0% | to invalidation: -5.4% (price move from 70.210 USD, before fees and leverage)
WHY THIS LEVEL
▪️ Price is moving between support and resistance with mixed EMA signals
▪️ 4H RSI 54.3 (neutral)
A 4H close above 74.192 USD cancels the idea. Chart idea only, not a position I hold.
Would you take this one, wait for more, or stay out? Tell us why below.
Not financial advice. Always DYOR.
Like & Follow for Daily Trade Analytics & Insider News. @MistralAK
#HYPE #TechnicalAnalysis #TradingSignals
Entry zone: 69.984 - 70.776 USD
Target: 60.030 USD (range low)
Invalidation: 4H close above 74.192 USD
Risk/Reward: 1 : 2.7
Est. PNL to target: +17.0% | to invalidation: -5.4% (price move from 70.210 USD, before fees and leverage)
WHY THIS LEVEL
▪️ Price is moving between support and resistance with mixed EMA signals
▪️ 4H RSI 54.3 (neutral)
A 4H close above 74.192 USD cancels the idea. Chart idea only, not a position I hold.
Would you take this one, wait for more, or stay out? Tell us why below.
Not financial advice. Always DYOR.
Like & Follow for Daily Trade Analytics & Insider News. @MistralAK
#HYPE #TechnicalAnalysis #TradingSignals
74

🔥 Hyperliquid ($HYPE ) Near $68: $3.3B Buybacks vs. Nov 29 Unlock
While the broader market faces fear, $HYPE is holding steady around $67–$69.
Two major forces are driving the price right now:
1️⃣ Massive Buybacks (Bullish). The Assistance Fund has accumulated/burned over $3.3B worth of HYPE from protocol fees. Upbit listings and U.S. expansion plans with ICE add strong fundamental support.
2️⃣ Nov 29 Unlock (Risk). A large token unlock approaches at month-end, causing some whales to de-risk early.
📊 Key Levels:
• Support: $64–$65 (losing this opens the door to $60).
• Resistance: $72–$75 (reclaiming this targets $80+).
💡 For Beginners: $HYPE moves fast. Avoid high leverage ahead of the Nov 29 unlock and consider spot DCA after the market absorbs the new supply.
Holding HYPE or waiting for a dip? Comment below 👇
If this quick update helped you, feel free to leave a tip for coffee! ☕️
#HYPE #Hyperliquid #Altcoins #BinanceSquare
{future}(HYPEUSDT)
🔥 Hyperliquid ($HYPE ) Near $68: $3.3B Buybacks vs. Nov 29 Unlock
While the broader market faces fear, $HYPE is holding steady around $67–$69.
Two major forces are driving the price right now:
1️⃣ Massive Buybacks (Bullish). The Assistance Fund has accumulated/burned over $3.3B worth of HYPE from protocol fees. Upbit listings and U.S. expansion plans with ICE add strong fundamental support.
2️⃣ Nov 29 Unlock (Risk). A large token unlock approaches at month-end, causing some whales to de-risk early.
📊 Key Levels:
• Support: $64–$65 (losing this opens the door to $60).
• Resistance: $72–$75 (reclaiming this targets $80+).
💡 For Beginners: $HYPE moves fast. Avoid high leverage ahead of the Nov 29 unlock and consider spot DCA after the market absorbs the new supply.
Holding HYPE or waiting for a dip? Comment below 👇
If this quick update helped you, feel free to leave a tip for coffee! ☕️
#HYPE #Hyperliquid #Altcoins #BinanceSquare
While the broader market faces fear, $HYPE is holding steady around $67–$69.
Two major forces are driving the price right now:
1️⃣ Massive Buybacks (Bullish). The Assistance Fund has accumulated/burned over $3.3B worth of HYPE from protocol fees. Upbit listings and U.S. expansion plans with ICE add strong fundamental support.
2️⃣ Nov 29 Unlock (Risk). A large token unlock approaches at month-end, causing some whales to de-risk early.
📊 Key Levels:
• Support: $64–$65 (losing this opens the door to $60).
• Resistance: $72–$75 (reclaiming this targets $80+).
💡 For Beginners: $HYPE moves fast. Avoid high leverage ahead of the Nov 29 unlock and consider spot DCA after the market absorbs the new supply.
Holding HYPE or waiting for a dip? Comment below 👇
If this quick update helped you, feel free to leave a tip for coffee! ☕️
#HYPE #Hyperliquid #Altcoins #BinanceSquare
8


·
--
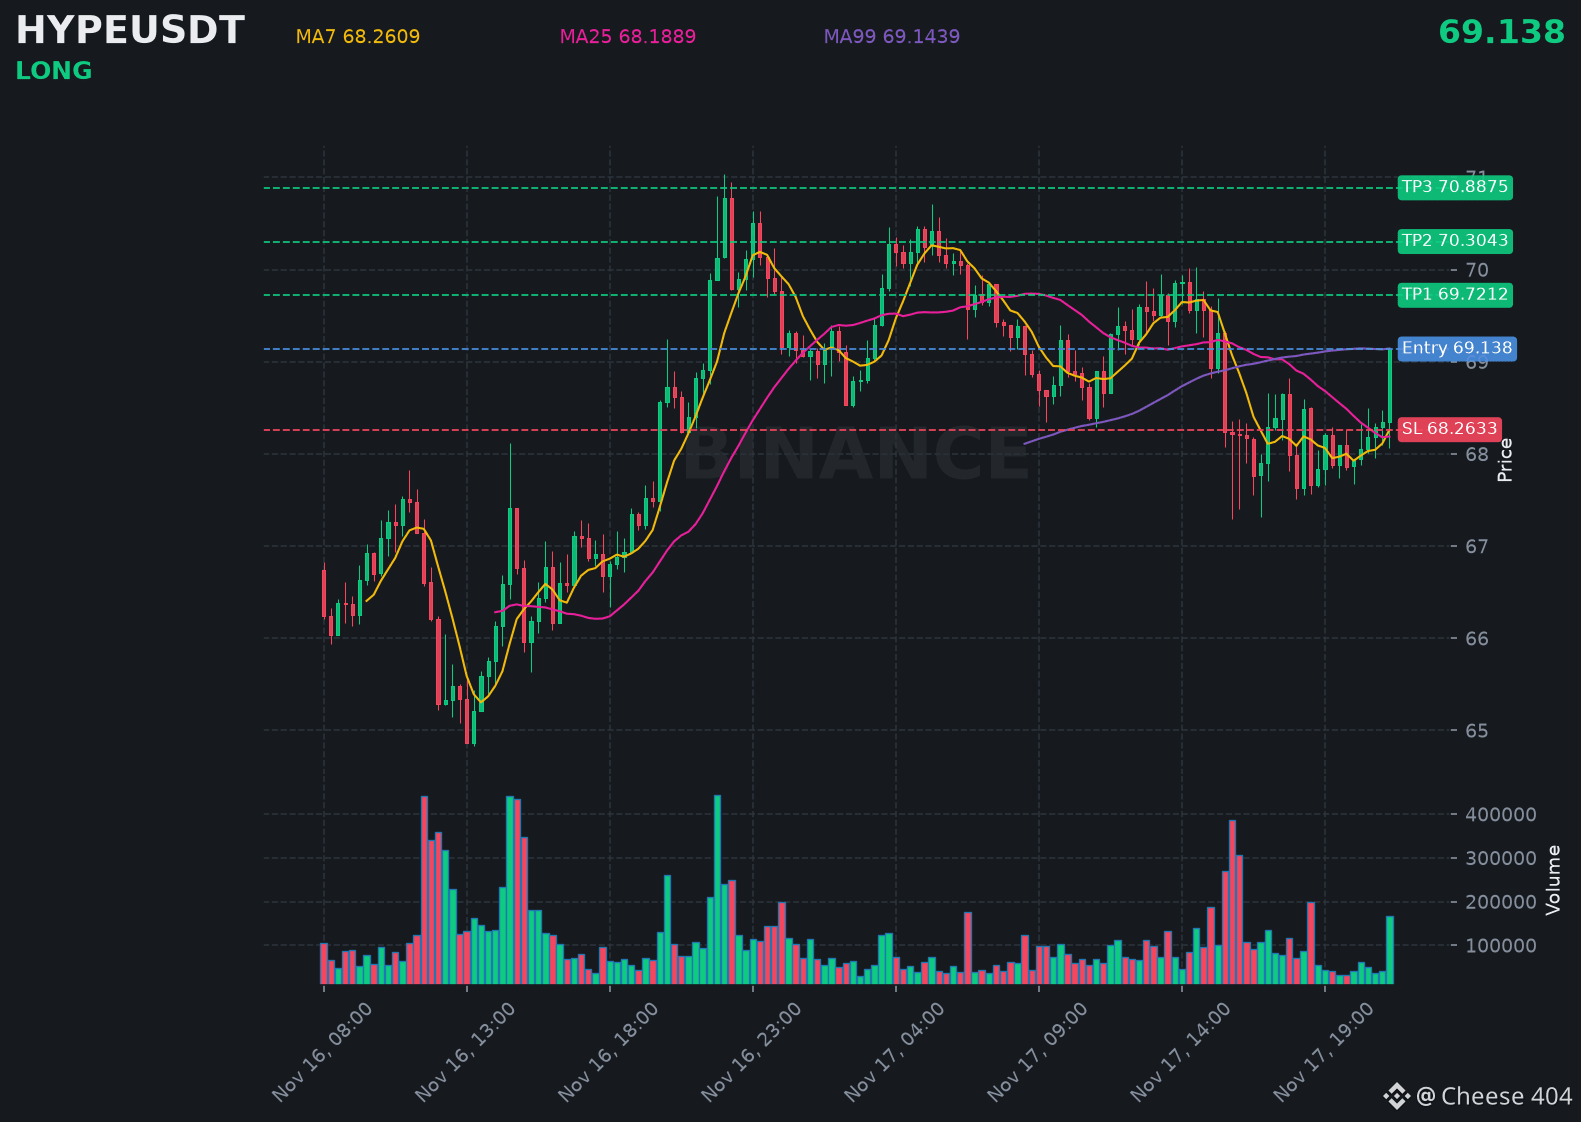
$HYPE looks primed to keep climbing, with bulls firmly in control of the trend.
📍 @ 69.138 | Volume: 11.51M USD
RSI 60 | EMA20: 68.3188 USD
📈 Trade Plan:
📈 Entry: 68.9631 – 69.3129
🛑 Stop Loss: 68.2633
🎯 TP1: 69.7212
🎯 TP2: 70.3043
🎯 TP3: 70.8875
Waiting for a retest, then riding the uptrend.
👉 $HYPE 👈 Catch it
#HYPE
$HYPE looks primed to keep climbing, with bulls firmly in control of the trend.
📍 @ 69.138 | Volume: 11.51M USD
RSI 60 | EMA20: 68.3188 USD
📈 Trade Plan:
📈 Entry: 68.9631 – 69.3129
🛑 Stop Loss: 68.2633
🎯 TP1: 69.7212
🎯 TP2: 70.3043
🎯 TP3: 70.8875
Waiting for a retest, then riding the uptrend.
👉 $HYPE 👈 Catch it
#HYPE
📍 @ 69.138 | Volume: 11.51M USD
RSI 60 | EMA20: 68.3188 USD
📈 Trade Plan:
📈 Entry: 68.9631 – 69.3129
🛑 Stop Loss: 68.2633
🎯 TP1: 69.7212
🎯 TP2: 70.3043
🎯 TP3: 70.8875
Waiting for a retest, then riding the uptrend.
👉 $HYPE 👈 Catch it
#HYPE
7

·
--
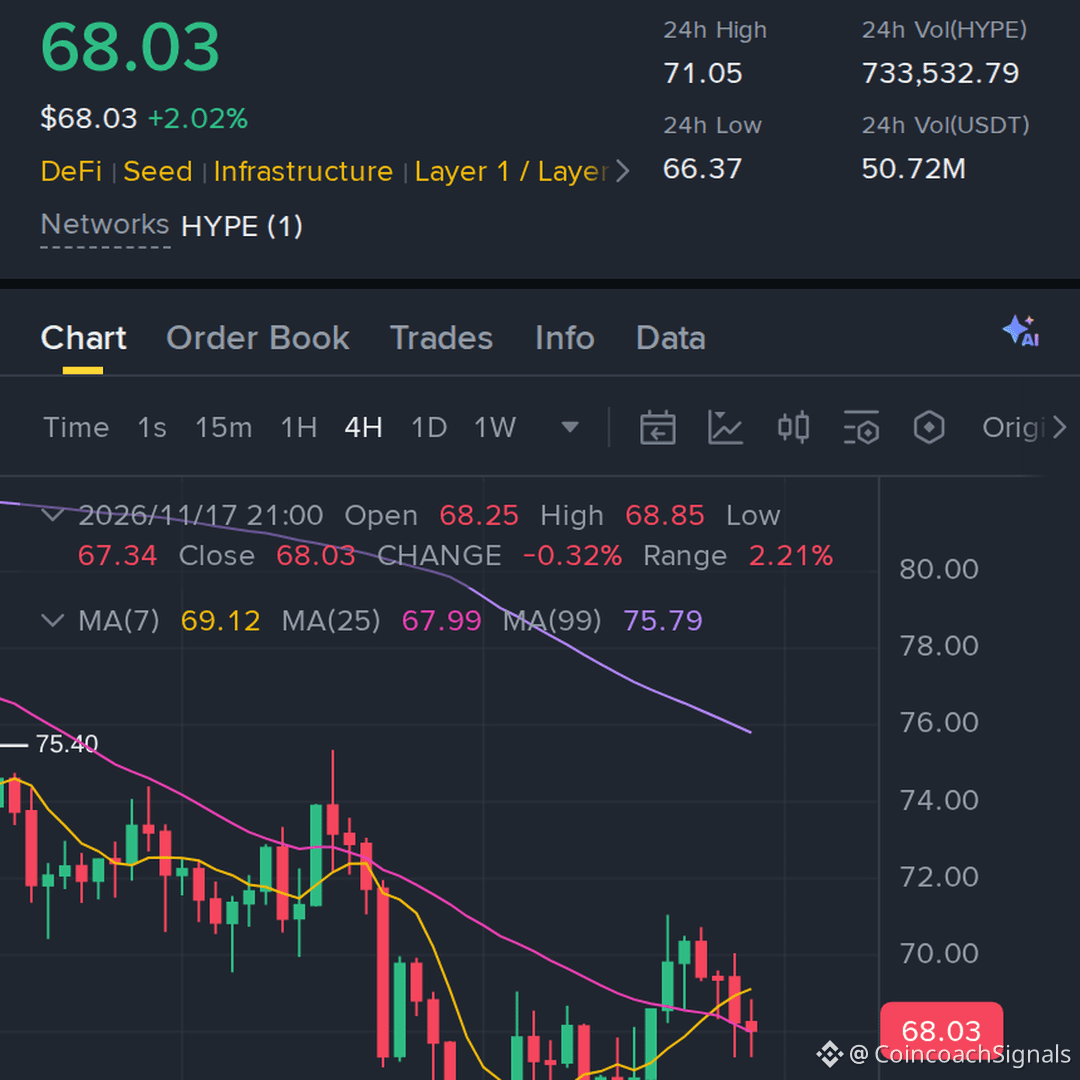
$HYPE -0.32% | $ASTER +1.13% | $SPCXB +1.98%
#HYPE trades at $68.29, down 0.32% on $51.4 M of volume; the Hyperliquid L1 sees modest outflow despite its perpetual futures focus.
#ASTER sits at $0.5737, up 1.13% with $39.1 M moving, suggesting its hidden‑order features are attracting a bit more interest.
#SPCXB is priced at $141.62, up 1.98% on $35.6 M of volume, a solid lift for the spot‑focused token.
🔎 Keep an eye on HYPE’s volume relative to its price dip – it may signal a short‑term swing opportunity.
#Write2Earn #Binance
$HYPE -0.32% | $ASTER +1.13% | $SPCXB +1.98%
#HYPE trades at $68.29, down 0.32% on $51.4 M of volume; the Hyperliquid L1 sees modest outflow despite its perpetual futures focus.
#ASTER sits at $0.5737, up 1.13% with $39.1 M moving, suggesting its hidden‑order features are attracting a bit more interest.
#SPCXB is priced at $141.62, up 1.98% on $35.6 M of volume, a solid lift for the spot‑focused token.
🔎 Keep an eye on HYPE’s volume relative to its price dip – it may signal a short‑term swing opportunity.
#Write2Earn #Binance
#HYPE trades at $68.29, down 0.32% on $51.4 M of volume; the Hyperliquid L1 sees modest outflow despite its perpetual futures focus.
#ASTER sits at $0.5737, up 1.13% with $39.1 M moving, suggesting its hidden‑order features are attracting a bit more interest.
#SPCXB is priced at $141.62, up 1.98% on $35.6 M of volume, a solid lift for the spot‑focused token.
🔎 Keep an eye on HYPE’s volume relative to its price dip – it may signal a short‑term swing opportunity.
#Write2Earn #Binance
5

·
--
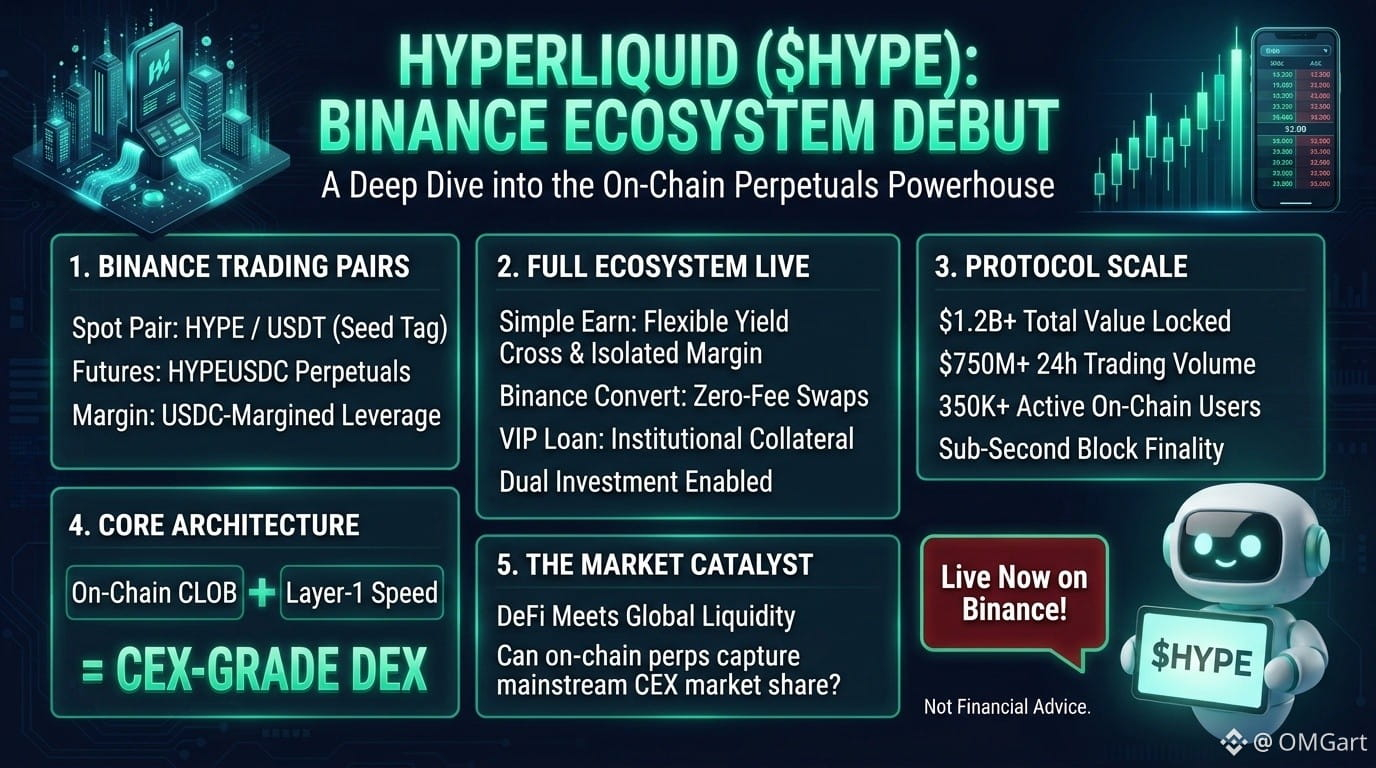
Hyperliquid (HYPE) just landed on Binance! 🚀
The leading decentralized perpetuals exchange is now live on the world's largest exchange:
🟢 Spot: HYPE/USDT (Seed Tag)
📈 Futures: HYPEUSDC Perps (USDC-Margined)
🔥 Ecosystem: Earn + Margin + Convert + VIP Loan
Key metrics:
• TVL: .2B+ | 24h Vol: 50M+
• 50K+ daily users | On-chain CLOB
• First DEX with CEX-grade performance
Hyperliquid brings on-chain order book + CEX-grade speed to Binance users. The DeFi ↔ CeFi bridge just got real.
#HYPE #BinanceListing
⚠️ Not Financial Advice. DYOR.
Hyperliquid (HYPE) just landed on Binance! 🚀
The leading decentralized perpetuals exchange is now live on the world's largest exchange:
🟢 Spot: HYPE/USDT (Seed Tag)
📈 Futures: HYPEUSDC Perps (USDC-Margined)
🔥 Ecosystem: Earn + Margin + Convert + VIP Loan
Key metrics:
• TVL: .2B+ | 24h Vol: 50M+
• 50K+ daily users | On-chain CLOB
• First DEX with CEX-grade performance
Hyperliquid brings on-chain order book + CEX-grade speed to Binance users. The DeFi ↔ CeFi bridge just got real.
#HYPE #BinanceListing
⚠️ Not Financial Advice. DYOR.
The leading decentralized perpetuals exchange is now live on the world's largest exchange:
🟢 Spot: HYPE/USDT (Seed Tag)
📈 Futures: HYPEUSDC Perps (USDC-Margined)
🔥 Ecosystem: Earn + Margin + Convert + VIP Loan
Key metrics:
• TVL: .2B+ | 24h Vol: 50M+
• 50K+ daily users | On-chain CLOB
• First DEX with CEX-grade performance
Hyperliquid brings on-chain order book + CEX-grade speed to Binance users. The DeFi ↔ CeFi bridge just got real.
#HYPE #BinanceListing
⚠️ Not Financial Advice. DYOR.
55

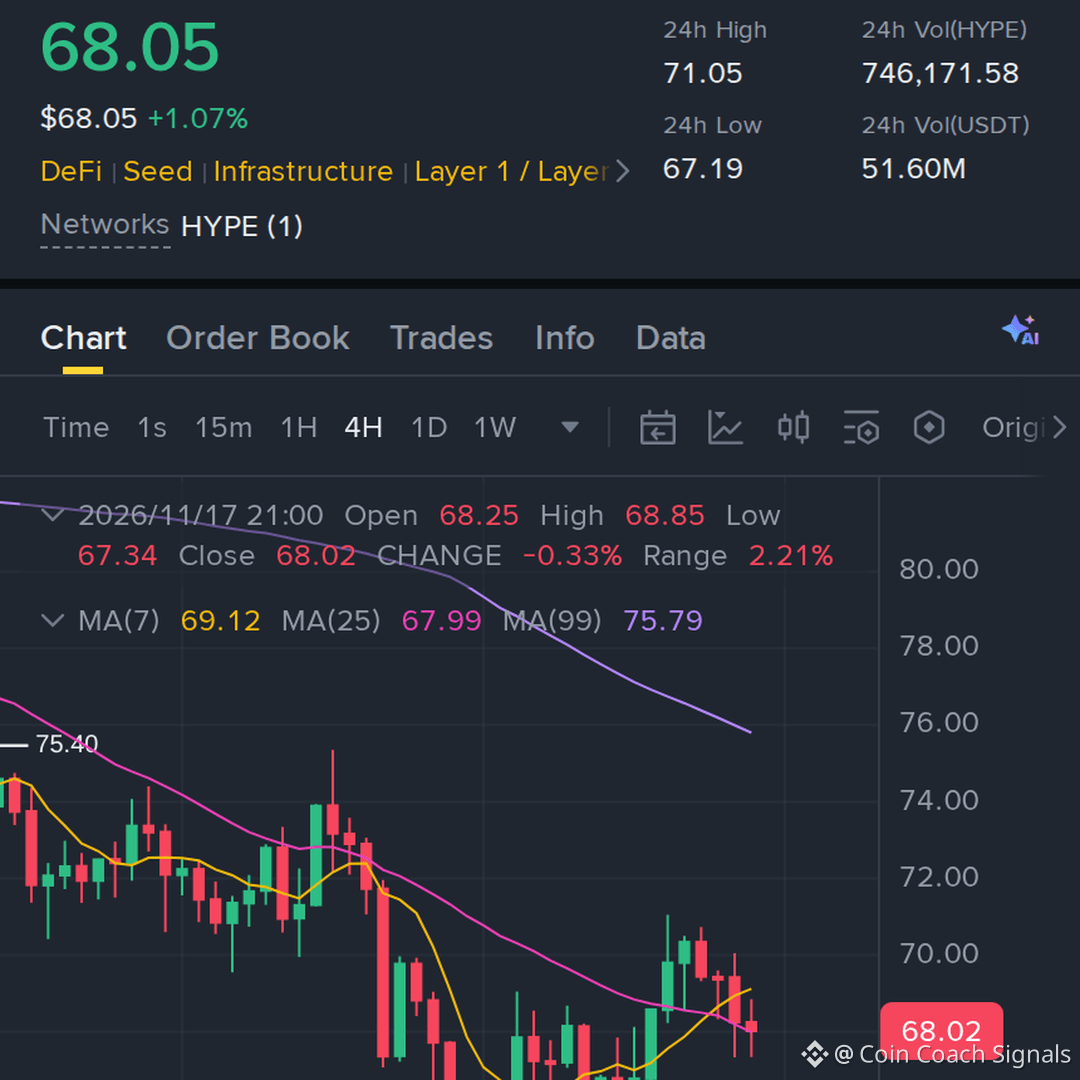
just noticed this, $HYPE keeps rejecting the same area, so the short side is worth watching, so I’m working with about 43x
Entry: 67.96–68.6 | TP1: 64.87 / TP2: 61.8 / TP3: 58.72 | Stop Loss: 71.52
#HYPE #crypto #Write2Earn #Binance
just noticed this, $HYPE keeps rejecting the same area, so the short side is worth watching, so I’m working with about 43x
Entry: 67.96–68.6 | TP1: 64.87 / TP2: 61.8 / TP3: 58.72 | Stop Loss: 71.52
#HYPE #crypto #Write2Earn #Binance
Entry: 67.96–68.6 | TP1: 64.87 / TP2: 61.8 / TP3: 58.72 | Stop Loss: 71.52
#HYPE #crypto #Write2Earn #Binance
154

·
--
SHORT $HYPE
Entry: $68.80–69.50
SL: $72.00
TP1: $66.30 | TP2: $62.00
Invalidation: 4H close above $72.00
HYPE bounced 18% off the $60 low but stalled right under the 200-day EMA at $69.50 — old support flipped to resistance, with the 24h high capped at $70.91.
BTC stays in a downtrend and HYPE is still below all major EMAs. A rejection here opens the way back to $66, then the $60 low.
Not financial advice.
#HYPE #Hyperliquid
SHORT $HYPE
Entry: $68.80–69.50
SL: $72.00
TP1: $66.30 | TP2: $62.00
Invalidation: 4H close above $72.00
HYPE bounced 18% off the $60 low but stalled right under the 200-day EMA at $69.50 — old support flipped to resistance, with the 24h high capped at $70.91.
BTC stays in a downtrend and HYPE is still below all major EMAs. A rejection here opens the way back to $66, then the $60 low.
Not financial advice.
#HYPE #Hyperliquid
Entry: $68.80–69.50
SL: $72.00
TP1: $66.30 | TP2: $62.00
Invalidation: 4H close above $72.00
HYPE bounced 18% off the $60 low but stalled right under the 200-day EMA at $69.50 — old support flipped to resistance, with the 24h high capped at $70.91.
BTC stays in a downtrend and HYPE is still below all major EMAs. A rejection here opens the way back to $66, then the $60 low.
Not financial advice.
#HYPE #Hyperliquid
4

HYPE, ASTER and TRX: Three Market Narratives in a Volatile Crypto Landscape
The latest market data shows a clear divide between HYPE, ASTER and TRX. While all three assets are operating in a cautious technical environment, their price behavior, volume participation, and capital flow are telling very different stories. This is the type of market where traders need to look beyond a single green or red candle and focus on whether demand is strong enough to change the broader trend.
HYPE is trading near $67.85, up 0.34% over the latest 24 hour period based on spot market data. The asset reached a high near $71.05 and a low around $67.33 during the session, showing that it remains highly reactive to intraday liquidity shifts. Despite the modest 24 hour gain, the current daily candle is weaker, with price down 2.79% versus the previous close.
The wider picture for HYPE remains under pressure. It is down 9.75% over the past 7 days and 13.10% over the past 30 days. HYPE is currently trading below its 7 day moving average near $69.54 and its 25 day moving average around $77.73. The SuperTrend remains bearish, while MACD continues to show a bearish death cross. These signals indicate that sellers still have the broader momentum advantage.
HYPE’s RSI is near 34.81, which is not deeply oversold but shows that momentum has weakened materially from stronger levels. Daily volume is around 82% of its recent 7 day average, meaning participation is below normal. Capital flow is also negative, with net outflow of approximately 112,784 HYPE. That combination suggests that the market has not yet demonstrated a decisive return of buyer conviction.
For HYPE, the key development to watch is whether volume can rebuild while price begins holding above its short term moving average. Without that confirmation, sharp intraday recoveries may remain vulnerable to renewed selling pressure.
ASTER is trading near $0.5630, down 0.57% over the latest 24 hour period. The asset has moved through a wide session range between approximately $0.5323 and $0.5998, which highlights the intensity of current volatility. ASTER briefly showed strong upside interest during the session but was unable to hold near the upper part of its range, signaling that sellers remain active.
The technical structure for ASTER remains fragile. The token is down 13.33% over the past 7 days and 19.90% over the past 30 days. It is trading below its 7 day moving average near $0.5892, its 25 day moving average near $0.6607, and its 99 day moving average near $0.6913. This alignment keeps the broader trend bearish.
ASTER’s RSI is near 37.62, which suggests it is recovering from weaker momentum but has not yet entered a convincing bullish phase. MACD remains bearish, with a death cross still active, and SuperTrend continues to point lower. Unlike HYPE, ASTER is trading with elevated volume. Its latest volume is around 148% of the 7 day average, showing that traders are actively engaging with the asset during this period of price instability.
However, high volume alone is not always a bullish sign. ASTER is showing net capital outflow of roughly 9.42 million tokens, with an outflow rate near 26.45%. This suggests that despite active trading, supply is still outweighing demand. The market will need to see sustained buying pressure and improving capital flow before the structure can become more constructive.
TRX is trading near $0.3077, up 0.52% over the latest 24 hour period. Among these three assets, TRX is showing the most stable current behavior. It reached a high around $0.3087 and a low near $0.3048, reflecting a tighter trading range compared with HYPE and ASTER. That relative stability is notable in a market where volatility remains elevated.
TRX is down 3.15% over the past 7 days and 7.79% over the past 30 days, which is a milder decline than the moves seen in HYPE and ASTER. The technical structure is still bearish because TRX remains below its 7 day, 25 day, and 99 day moving averages. MACD retains a bearish death cross, while SuperTrend remains downward.
Yet TRX is showing signs of improving short term momentum. Its RSI has recovered to 32.46 from 18.30, suggesting selling pressure has eased significantly. More importantly, TRX is recording net capital inflow of approximately 8.53 million TRX, with an inflow rate near 15.53%. This is a meaningful contrast with the outflows visible in HYPE and ASTER.
TRX volume is around 80% of the 7 day average, so the recovery still requires stronger participation to become more convincing. But relative to the other two assets, TRX is currently presenting a more defensive profile, with smaller weekly losses, improving RSI, and positive capital flow.
The broader conclusion is not about declaring a winner. HYPE remains a high interest asset but needs stronger volume and a reversal in capital flow. ASTER is seeing heavy activity, but sellers are still dominating the latest flow data. TRX is showing relative resilience and positive inflows, although its major technical trend has not yet turned bullish.
In the current market, volatility can produce rapid reversals in both directions. A durable recovery would require sustained demand, improving market participation, and a clear shift in price structure. Until those signals appear, discipline and risk awareness remain more important than chasing short term moves.
#HYPE #ASTER #TRX #CryptoMarket #MarketAnalysis
$HYPE
{spot}(HYPEUSDT)
$ASTER
{spot}(ASTERUSDT)
$TRX
{spot}(TRXUSDT)
HYPE, ASTER and TRX: Three Market Narratives in a Volatile Crypto Landscape
The latest market data shows a clear divide between HYPE, ASTER and TRX. While all three assets are operating in a cautious technical environment, their price behavior, volume participation, and capital flow are telling very different stories. This is the type of market where traders need to look beyond a single green or red candle and focus on whether demand is strong enough to change the broader trend.
HYPE is trading near $67.85, up 0.34% over the latest 24 hour period based on spot market data. The asset reached a high near $71.05 and a low around $67.33 during the session, showing that it remains highly reactive to intraday liquidity shifts. Despite the modest 24 hour gain, the current daily candle is weaker, with price down 2.79% versus the previous close.
The wider picture for HYPE remains under pressure. It is down 9.75% over the past 7 days and 13.10% over the past 30 days. HYPE is currently trading below its 7 day moving average near $69.54 and its 25 day moving average around $77.73. The SuperTrend remains bearish, while MACD continues to show a bearish death cross. These signals indicate that sellers still have the broader momentum advantage.
HYPE’s RSI is near 34.81, which is not deeply oversold but shows that momentum has weakened materially from stronger levels. Daily volume is around 82% of its recent 7 day average, meaning participation is below normal. Capital flow is also negative, with net outflow of approximately 112,784 HYPE. That combination suggests that the market has not yet demonstrated a decisive return of buyer conviction.
For HYPE, the key development to watch is whether volume can rebuild while price begins holding above its short term moving average. Without that confirmation, sharp intraday recoveries may remain vulnerable to renewed selling pressure.
ASTER is trading near $0.5630, down 0.57% over the latest 24 hour period. The asset has moved through a wide session range between approximately $0.5323 and $0.5998, which highlights the intensity of current volatility. ASTER briefly showed strong upside interest during the session but was unable to hold near the upper part of its range, signaling that sellers remain active.
The technical structure for ASTER remains fragile. The token is down 13.33% over the past 7 days and 19.90% over the past 30 days. It is trading below its 7 day moving average near $0.5892, its 25 day moving average near $0.6607, and its 99 day moving average near $0.6913. This alignment keeps the broader trend bearish.
ASTER’s RSI is near 37.62, which suggests it is recovering from weaker momentum but has not yet entered a convincing bullish phase. MACD remains bearish, with a death cross still active, and SuperTrend continues to point lower. Unlike HYPE, ASTER is trading with elevated volume. Its latest volume is around 148% of the 7 day average, showing that traders are actively engaging with the asset during this period of price instability.
However, high volume alone is not always a bullish sign. ASTER is showing net capital outflow of roughly 9.42 million tokens, with an outflow rate near 26.45%. This suggests that despite active trading, supply is still outweighing demand. The market will need to see sustained buying pressure and improving capital flow before the structure can become more constructive.
TRX is trading near $0.3077, up 0.52% over the latest 24 hour period. Among these three assets, TRX is showing the most stable current behavior. It reached a high around $0.3087 and a low near $0.3048, reflecting a tighter trading range compared with HYPE and ASTER. That relative stability is notable in a market where volatility remains elevated.
TRX is down 3.15% over the past 7 days and 7.79% over the past 30 days, which is a milder decline than the moves seen in HYPE and ASTER. The technical structure is still bearish because TRX remains below its 7 day, 25 day, and 99 day moving averages. MACD retains a bearish death cross, while SuperTrend remains downward.
Yet TRX is showing signs of improving short term momentum. Its RSI has recovered to 32.46 from 18.30, suggesting selling pressure has eased significantly. More importantly, TRX is recording net capital inflow of approximately 8.53 million TRX, with an inflow rate near 15.53%. This is a meaningful contrast with the outflows visible in HYPE and ASTER.
TRX volume is around 80% of the 7 day average, so the recovery still requires stronger participation to become more convincing. But relative to the other two assets, TRX is currently presenting a more defensive profile, with smaller weekly losses, improving RSI, and positive capital flow.
The broader conclusion is not about declaring a winner. HYPE remains a high interest asset but needs stronger volume and a reversal in capital flow. ASTER is seeing heavy activity, but sellers are still dominating the latest flow data. TRX is showing relative resilience and positive inflows, although its major technical trend has not yet turned bullish.
In the current market, volatility can produce rapid reversals in both directions. A durable recovery would require sustained demand, improving market participation, and a clear shift in price structure. Until those signals appear, discipline and risk awareness remain more important than chasing short term moves.
#HYPE #ASTER #TRX #CryptoMarket #MarketAnalysis
$HYPE
$ASTER
$TRX
HYPE is trading near $67.85, up 0.34% over the latest 24 hour period based on spot market data. The asset reached a high near $71.05 and a low around $67.33 during the session, showing that it remains highly reactive to intraday liquidity shifts. Despite the modest 24 hour gain, the current daily candle is weaker, with price down 2.79% versus the previous close.
The wider picture for HYPE remains under pressure. It is down 9.75% over the past 7 days and 13.10% over the past 30 days. HYPE is currently trading below its 7 day moving average near $69.54 and its 25 day moving average around $77.73. The SuperTrend remains bearish, while MACD continues to show a bearish death cross. These signals indicate that sellers still have the broader momentum advantage.
HYPE’s RSI is near 34.81, which is not deeply oversold but shows that momentum has weakened materially from stronger levels. Daily volume is around 82% of its recent 7 day average, meaning participation is below normal. Capital flow is also negative, with net outflow of approximately 112,784 HYPE. That combination suggests that the market has not yet demonstrated a decisive return of buyer conviction.
For HYPE, the key development to watch is whether volume can rebuild while price begins holding above its short term moving average. Without that confirmation, sharp intraday recoveries may remain vulnerable to renewed selling pressure.
ASTER is trading near $0.5630, down 0.57% over the latest 24 hour period. The asset has moved through a wide session range between approximately $0.5323 and $0.5998, which highlights the intensity of current volatility. ASTER briefly showed strong upside interest during the session but was unable to hold near the upper part of its range, signaling that sellers remain active.
The technical structure for ASTER remains fragile. The token is down 13.33% over the past 7 days and 19.90% over the past 30 days. It is trading below its 7 day moving average near $0.5892, its 25 day moving average near $0.6607, and its 99 day moving average near $0.6913. This alignment keeps the broader trend bearish.
ASTER’s RSI is near 37.62, which suggests it is recovering from weaker momentum but has not yet entered a convincing bullish phase. MACD remains bearish, with a death cross still active, and SuperTrend continues to point lower. Unlike HYPE, ASTER is trading with elevated volume. Its latest volume is around 148% of the 7 day average, showing that traders are actively engaging with the asset during this period of price instability.
However, high volume alone is not always a bullish sign. ASTER is showing net capital outflow of roughly 9.42 million tokens, with an outflow rate near 26.45%. This suggests that despite active trading, supply is still outweighing demand. The market will need to see sustained buying pressure and improving capital flow before the structure can become more constructive.
TRX is trading near $0.3077, up 0.52% over the latest 24 hour period. Among these three assets, TRX is showing the most stable current behavior. It reached a high around $0.3087 and a low near $0.3048, reflecting a tighter trading range compared with HYPE and ASTER. That relative stability is notable in a market where volatility remains elevated.
TRX is down 3.15% over the past 7 days and 7.79% over the past 30 days, which is a milder decline than the moves seen in HYPE and ASTER. The technical structure is still bearish because TRX remains below its 7 day, 25 day, and 99 day moving averages. MACD retains a bearish death cross, while SuperTrend remains downward.
Yet TRX is showing signs of improving short term momentum. Its RSI has recovered to 32.46 from 18.30, suggesting selling pressure has eased significantly. More importantly, TRX is recording net capital inflow of approximately 8.53 million TRX, with an inflow rate near 15.53%. This is a meaningful contrast with the outflows visible in HYPE and ASTER.
TRX volume is around 80% of the 7 day average, so the recovery still requires stronger participation to become more convincing. But relative to the other two assets, TRX is currently presenting a more defensive profile, with smaller weekly losses, improving RSI, and positive capital flow.
The broader conclusion is not about declaring a winner. HYPE remains a high interest asset but needs stronger volume and a reversal in capital flow. ASTER is seeing heavy activity, but sellers are still dominating the latest flow data. TRX is showing relative resilience and positive inflows, although its major technical trend has not yet turned bullish.
In the current market, volatility can produce rapid reversals in both directions. A durable recovery would require sustained demand, improving market participation, and a clear shift in price structure. Until those signals appear, discipline and risk awareness remain more important than chasing short term moves.
#HYPE #ASTER #TRX #CryptoMarket #MarketAnalysis
$HYPE
$ASTER
$TRX
8


·
--
$HYPE +2.91% | $ASTER -3.73% | $SPCXB +3.03%
#HYPE trades at $68.66, up +2.91% on $50.6 M volume. The layer‑1 focused on perpetual futures shows solid buying pressure, though the move is modest.
#ASTER is at $0.5494, down ‑3.73% with $39.3 M traded. The decline comes despite decent volume, hinting at a short‑term pullback.
#SPCXB sits at $140.93, up +3.03% on $37.6 M volume. The rise is backed by a healthy turnover, suggesting interest may be building.
👀 Keep an eye on whether HYPE’s volume can keep pace with its price rise, as that could indicate sustained momentum.
#Write2Earn #Binance
$HYPE +2.91% | $ASTER -3.73% | $SPCXB +3.03%
#HYPE trades at $68.66, up +2.91% on $50.6 M volume. The layer‑1 focused on perpetual futures shows solid buying pressure, though the move is modest.
#ASTER is at $0.5494, down ‑3.73% with $39.3 M traded. The decline comes despite decent volume, hinting at a short‑term pullback.
#SPCXB sits at $140.93, up +3.03% on $37.6 M volume. The rise is backed by a healthy turnover, suggesting interest may be building.
👀 Keep an eye on whether HYPE’s volume can keep pace with its price rise, as that could indicate sustained momentum.
#Write2Earn #Binance
#HYPE trades at $68.66, up +2.91% on $50.6 M volume. The layer‑1 focused on perpetual futures shows solid buying pressure, though the move is modest.
#ASTER is at $0.5494, down ‑3.73% with $39.3 M traded. The decline comes despite decent volume, hinting at a short‑term pullback.
#SPCXB sits at $140.93, up +3.03% on $37.6 M volume. The rise is backed by a healthy turnover, suggesting interest may be building.
👀 Keep an eye on whether HYPE’s volume can keep pace with its price rise, as that could indicate sustained momentum.
#Write2Earn #Binance
10

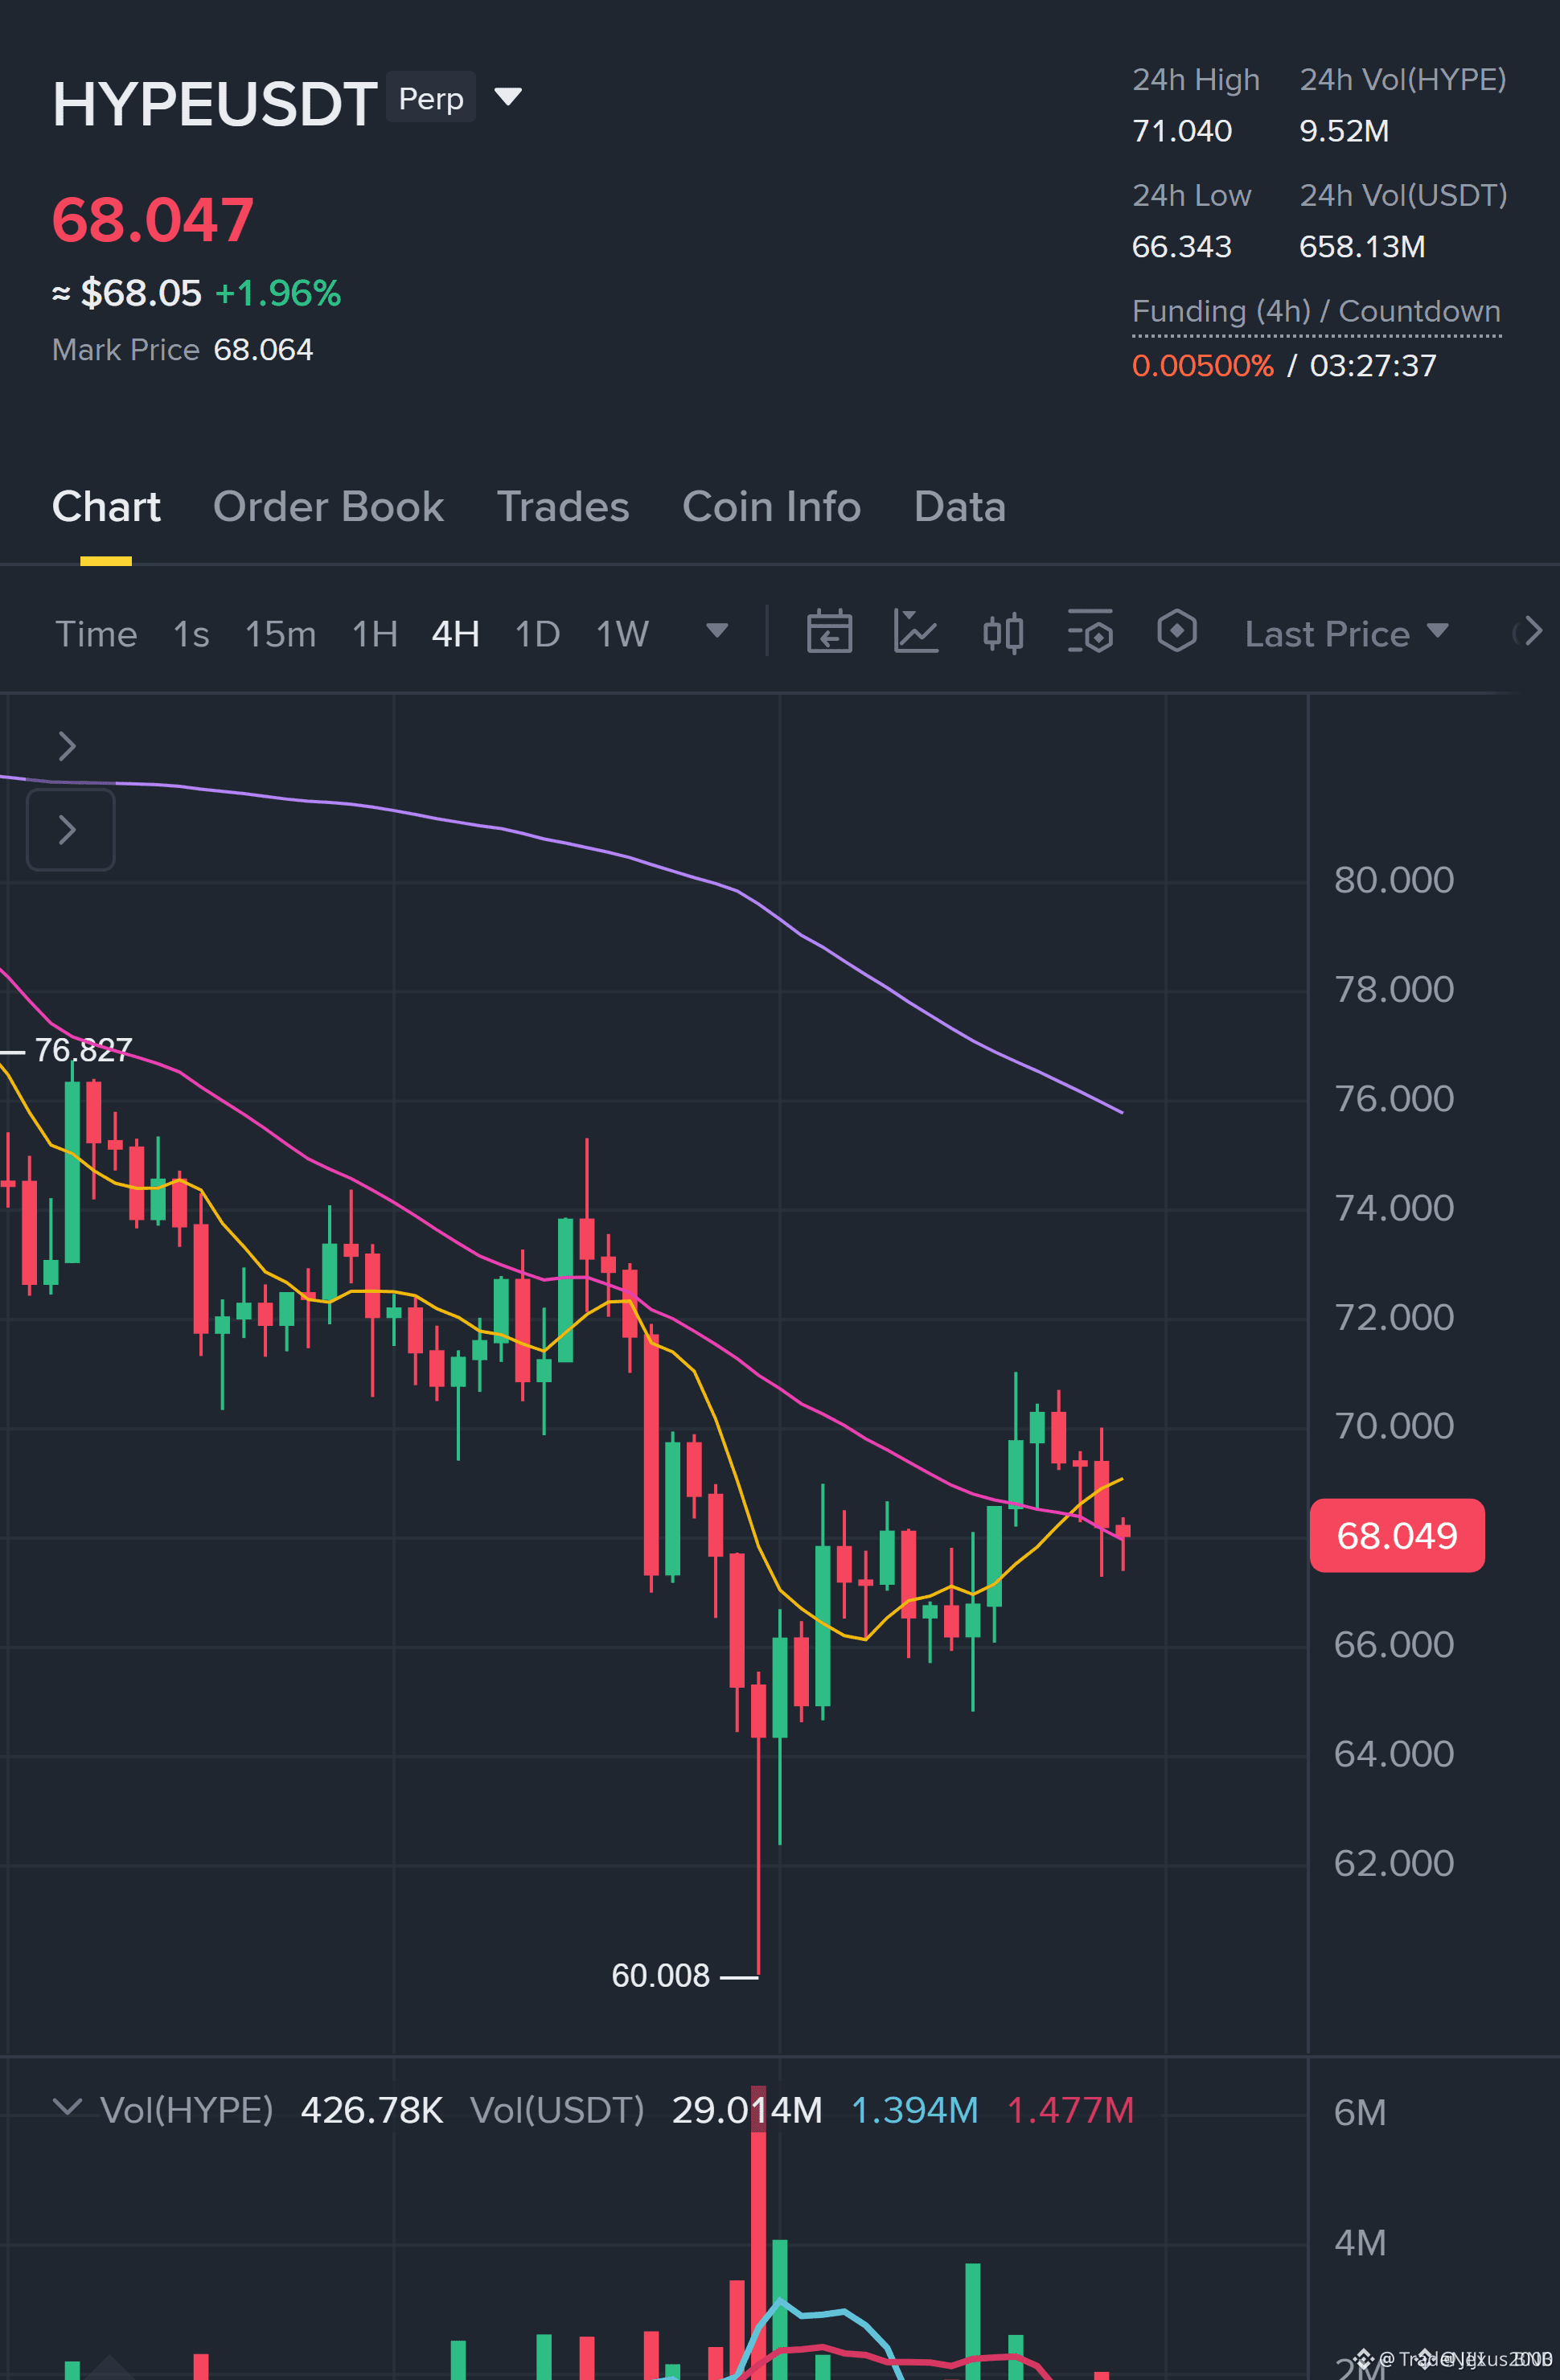
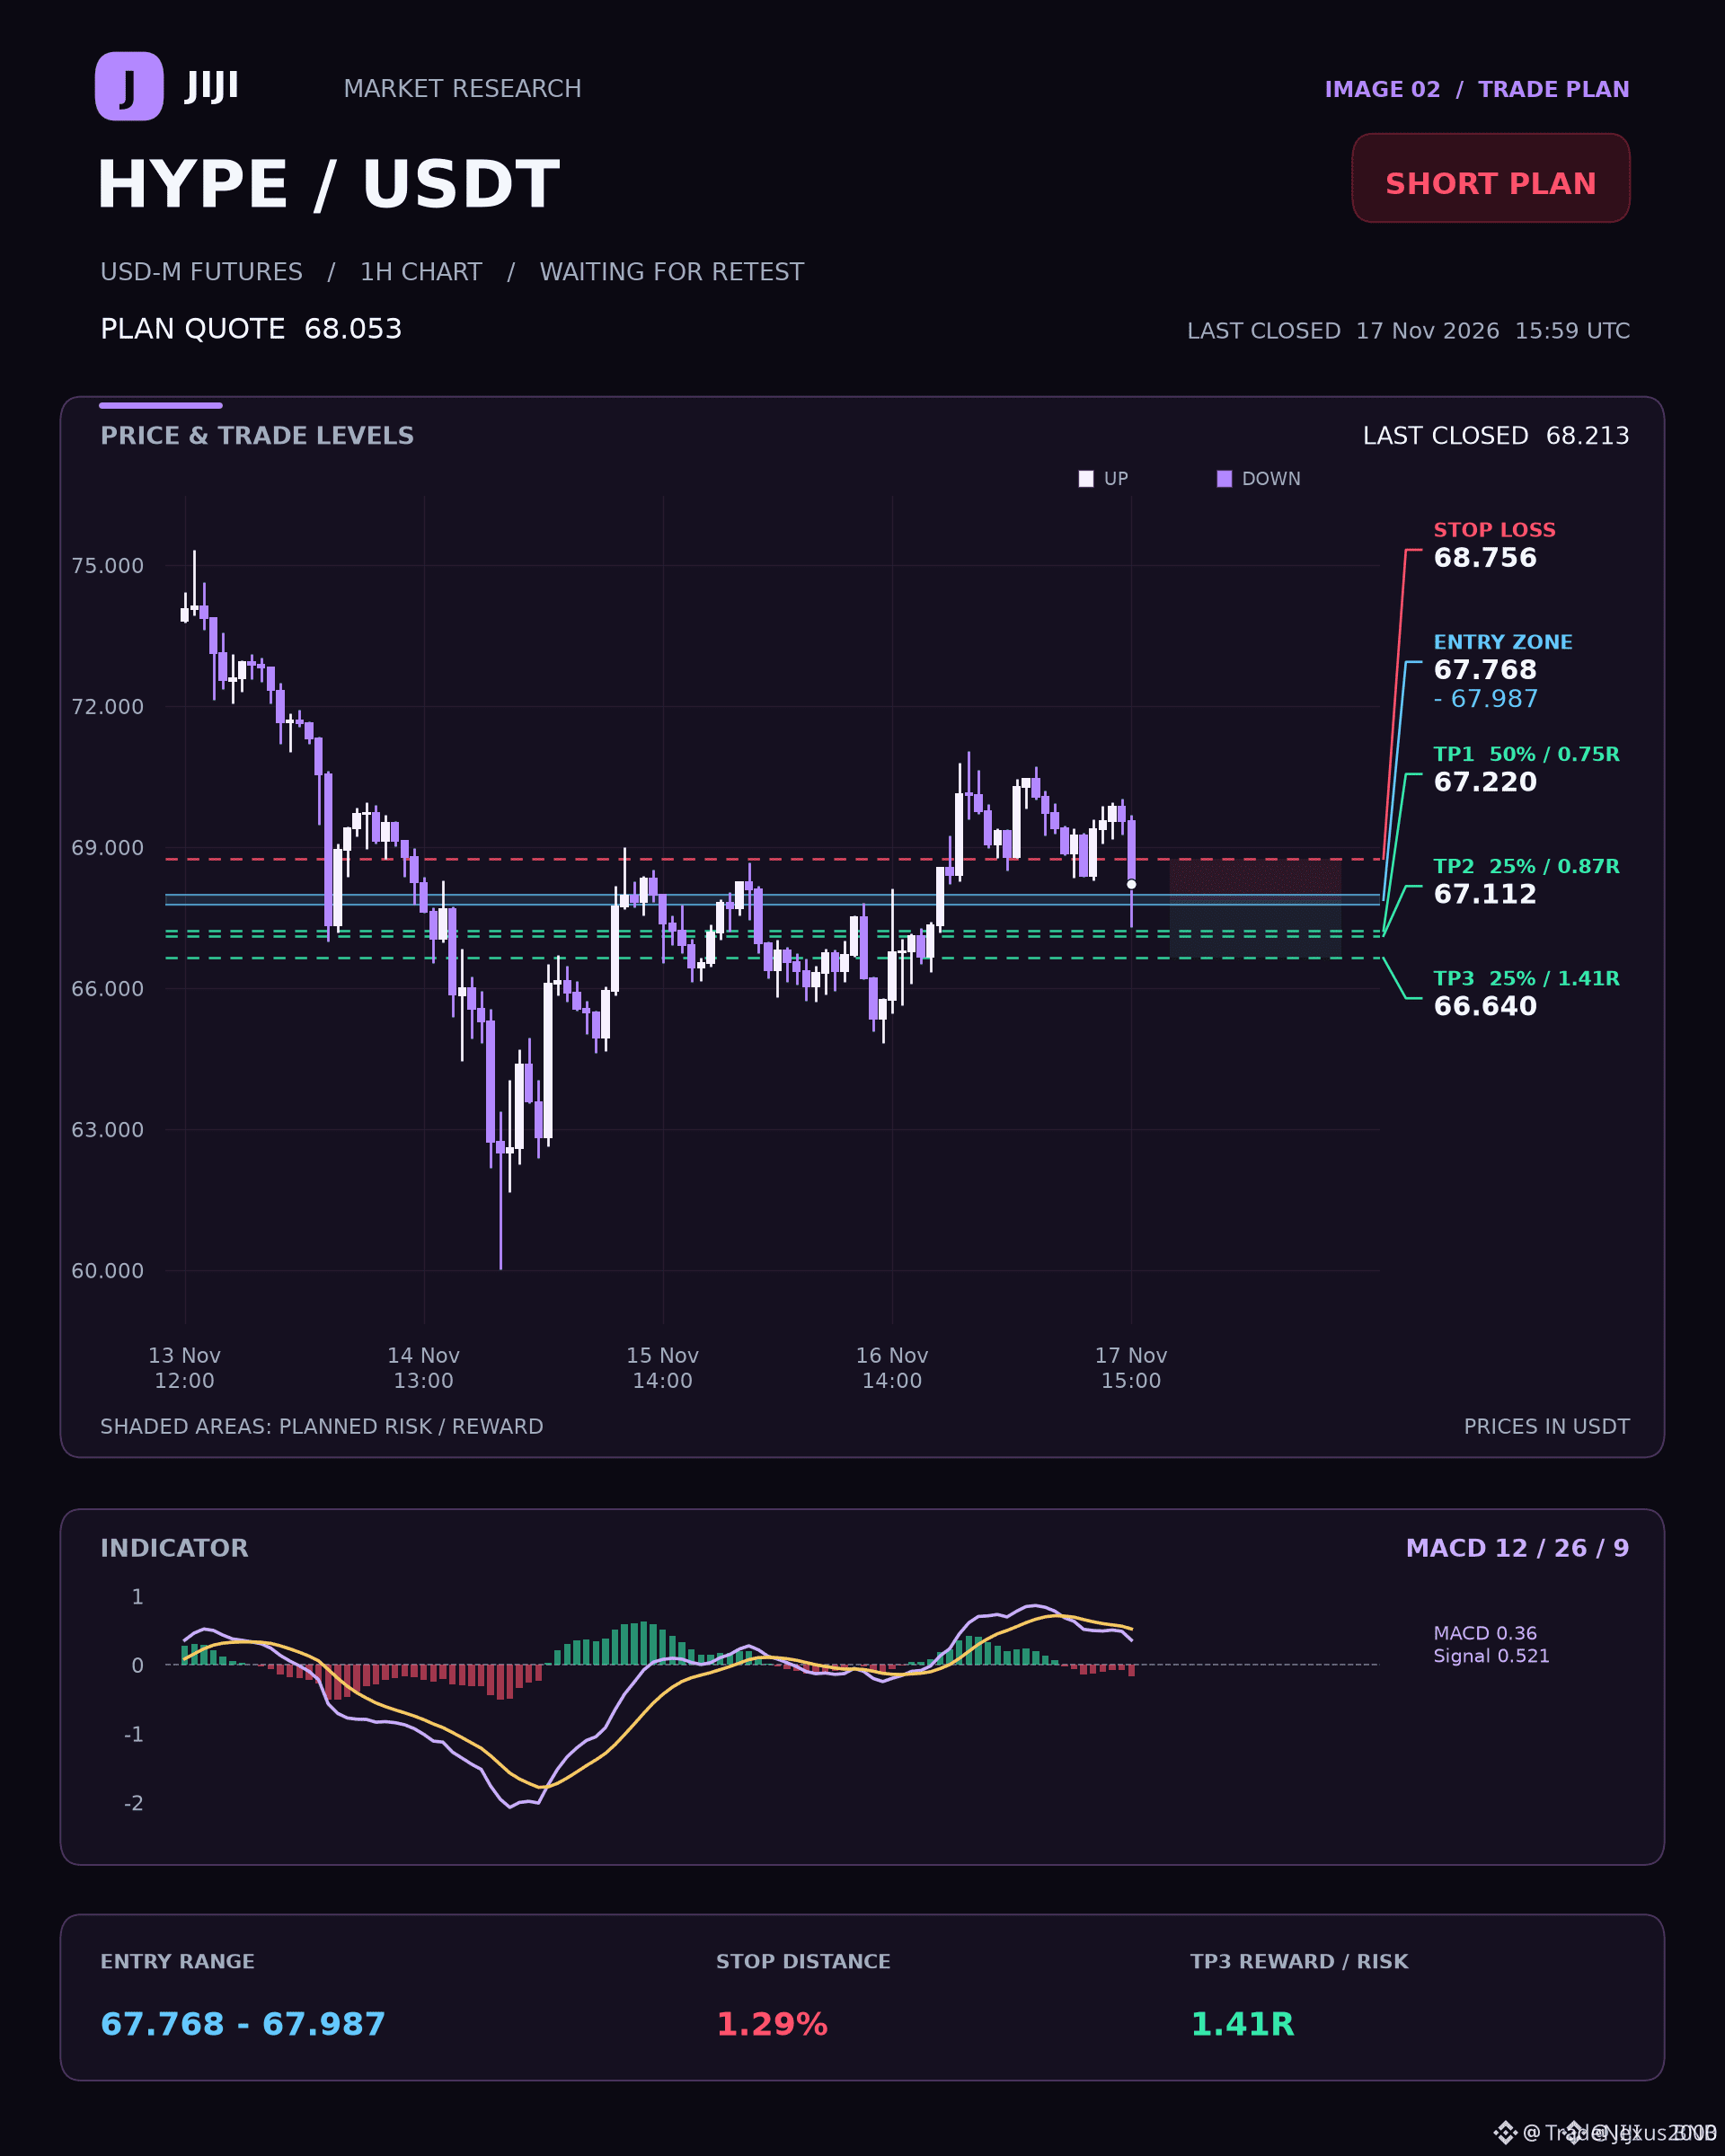
🔴 $HYPE BEARISH STRUCTURE ALIGNING FOR A CLEAN INSTITUTIONAL DISTRIBUTION WAVE 📉
Entry: 67.768 – 67.987 ⚡
Target: 66.64 🚀
Stop Loss: 68.756 ⚠️
The 4h Exponential Moving Average structure firmly favors downside continuation as smart money seeks lower liquidity pools. We are monitoring a retest and reclaim of the entry zone paired with a closed 15m confirmation candle before committing capital. 📊
Downside momentum targets the structural inefficiencies below, though we must respect the confirmed 4h support level sitting right at 67.002 which could temporarily stall price action. 💡
Are you waiting for the 15m structural confirmation before executing, or positioning early inside the zone? 🤔
⚠️ Not financial advice. Always manage your risk. 🛡️
🏷️ #HYPE #ShortSetup #CryptoFutures #MarketStructure
🦈 📉
🔴 $HYPE BEARISH STRUCTURE ALIGNING FOR A CLEAN INSTITUTIONAL DISTRIBUTION WAVE 📉
Entry: 67.768 – 67.987 ⚡
Target: 66.64 🚀
Stop Loss: 68.756 ⚠️
The 4h Exponential Moving Average structure firmly favors downside continuation as smart money seeks lower liquidity pools. We are monitoring a retest and reclaim of the entry zone paired with a closed 15m confirmation candle before committing capital. 📊
Downside momentum targets the structural inefficiencies below, though we must respect the confirmed 4h support level sitting right at 67.002 which could temporarily stall price action. 💡
Are you waiting for the 15m structural confirmation before executing, or positioning early inside the zone? 🤔
⚠️ Not financial advice. Always manage your risk. 🛡️
🏷️ #HYPE #ShortSetup #CryptoFutures #MarketStructure
🦈 📉
Entry: 67.768 – 67.987 ⚡
Target: 66.64 🚀
Stop Loss: 68.756 ⚠️
The 4h Exponential Moving Average structure firmly favors downside continuation as smart money seeks lower liquidity pools. We are monitoring a retest and reclaim of the entry zone paired with a closed 15m confirmation candle before committing capital. 📊
Downside momentum targets the structural inefficiencies below, though we must respect the confirmed 4h support level sitting right at 67.002 which could temporarily stall price action. 💡
Are you waiting for the 15m structural confirmation before executing, or positioning early inside the zone? 🤔
⚠️ Not financial advice. Always manage your risk. 🛡️
🏷️ #HYPE #ShortSetup #CryptoFutures #MarketStructure
🦈 📉
11

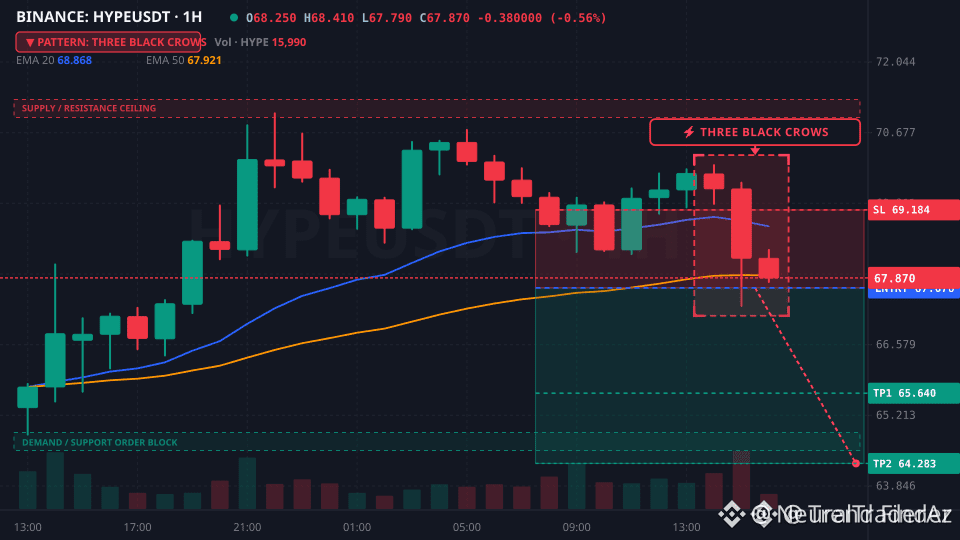
🚨 $HYPE INSTITUTIONAL ORDER FLOW SHIFTS AS THE EMA20 FAILS ON HIGH VOLUME 📉
Entry: 67.676 ⚡
Target: 65.64 🚀
Stop Loss: 69.184 ⚠️
Smart money is orchestrating a classic liquidity sweep on the lower timeframe structure. As $BTC consolidates, the recent three black crows pattern exposes a textbook trap for retail breakout chasers above the 20-period exponential moving average. 🦈
Volume profile expansion confirms institutional distribution rather than genuine accumulation, shifting the 1H bias firmly toward the downside. Managing $USDC exposure tightly around these imbalances protects capital while order flow resolves. 📊
💬 Are you positioning for the impulsive sweep into the primary liquidity pool below, or waiting for a deeper retest? 👇
⚠️ Not financial advice. Always manage your risk. 🛡️
🏷️ #HYPE #ShortSetup #LiquidityTrap #Crypto
🦈 📉
🚨 $HYPE INSTITUTIONAL ORDER FLOW SHIFTS AS THE EMA20 FAILS ON HIGH VOLUME 📉
Entry: 67.676 ⚡
Target: 65.64 🚀
Stop Loss: 69.184 ⚠️
Smart money is orchestrating a classic liquidity sweep on the lower timeframe structure. As $BTC consolidates, the recent three black crows pattern exposes a textbook trap for retail breakout chasers above the 20-period exponential moving average. 🦈
Volume profile expansion confirms institutional distribution rather than genuine accumulation, shifting the 1H bias firmly toward the downside. Managing $USDC exposure tightly around these imbalances protects capital while order flow resolves. 📊
💬 Are you positioning for the impulsive sweep into the primary liquidity pool below, or waiting for a deeper retest? 👇
⚠️ Not financial advice. Always manage your risk. 🛡️
🏷️ #HYPE #ShortSetup #LiquidityTrap #Crypto
🦈 📉
Entry: 67.676 ⚡
Target: 65.64 🚀
Stop Loss: 69.184 ⚠️
Smart money is orchestrating a classic liquidity sweep on the lower timeframe structure. As $BTC consolidates, the recent three black crows pattern exposes a textbook trap for retail breakout chasers above the 20-period exponential moving average. 🦈
Volume profile expansion confirms institutional distribution rather than genuine accumulation, shifting the 1H bias firmly toward the downside. Managing $USDC exposure tightly around these imbalances protects capital while order flow resolves. 📊
💬 Are you positioning for the impulsive sweep into the primary liquidity pool below, or waiting for a deeper retest? 👇
⚠️ Not financial advice. Always manage your risk. 🛡️
🏷️ #HYPE #ShortSetup #LiquidityTrap #Crypto
🦈 📉
5

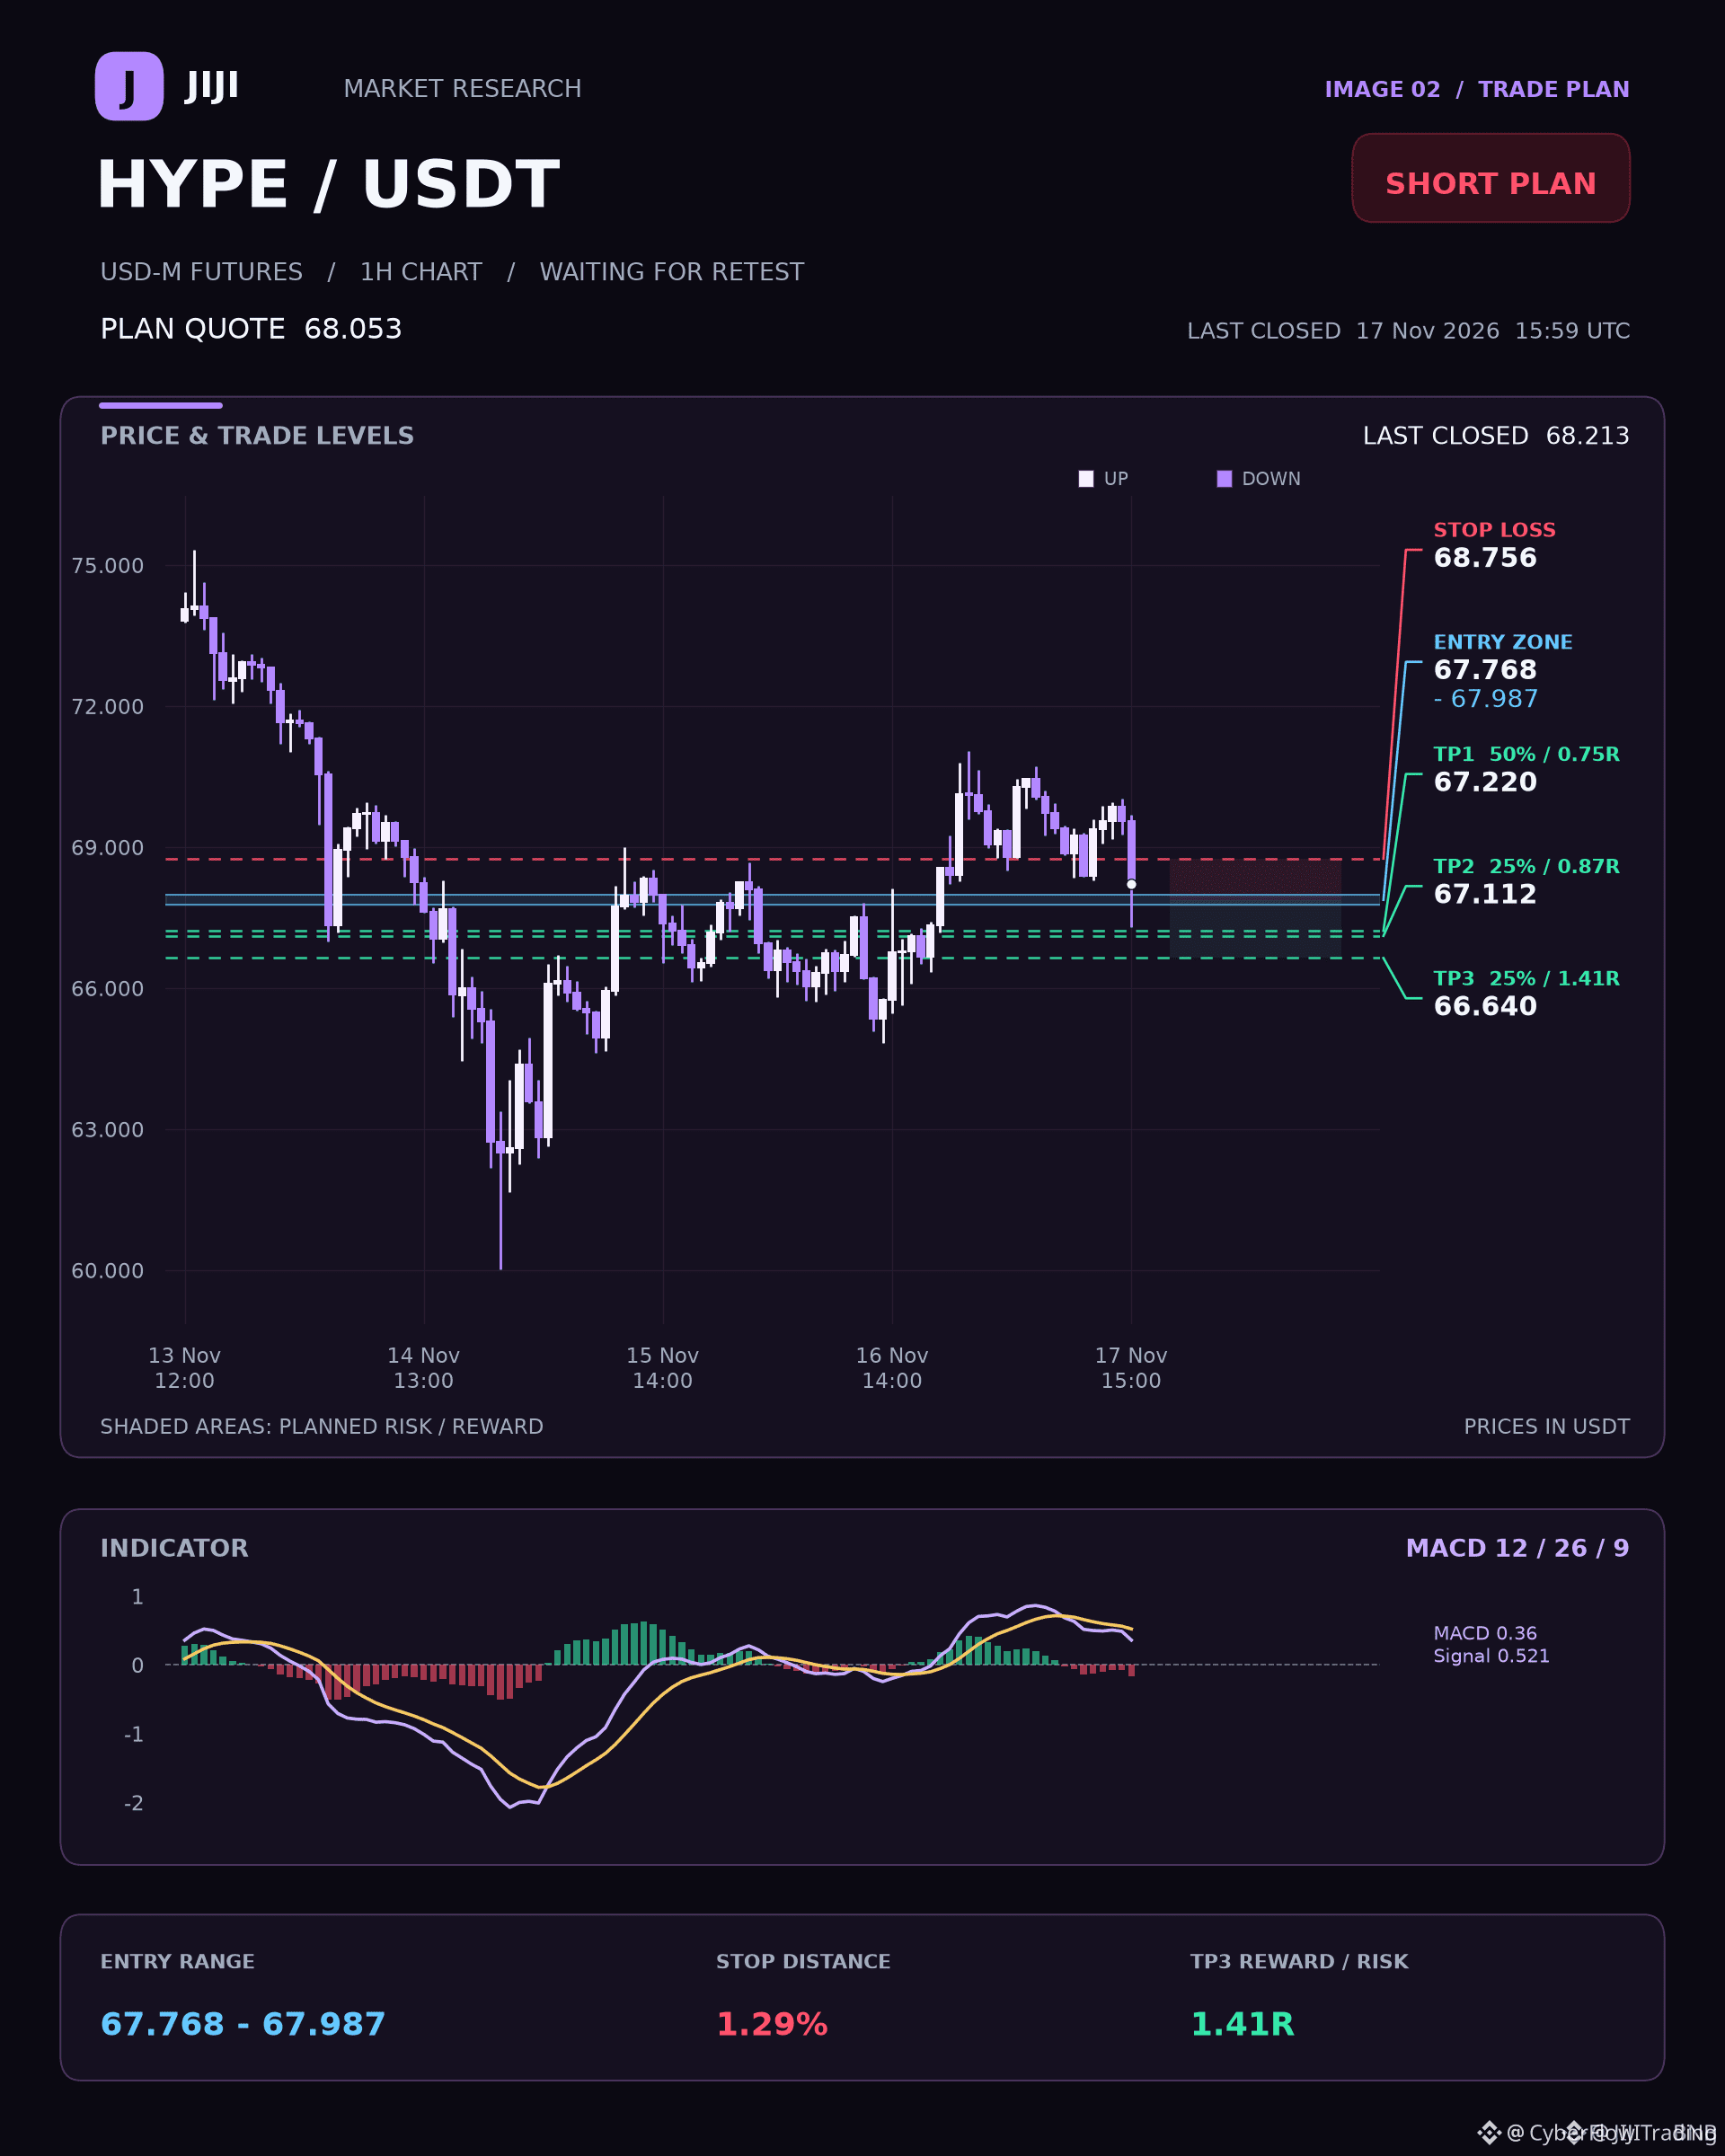
🚨 $HYPE BEARS CRUNCHING THE 4H STRUCTURE AS SHORT MOMENTUM BUILDS 📉
Entry: 67.768 – 67.987 ⚡
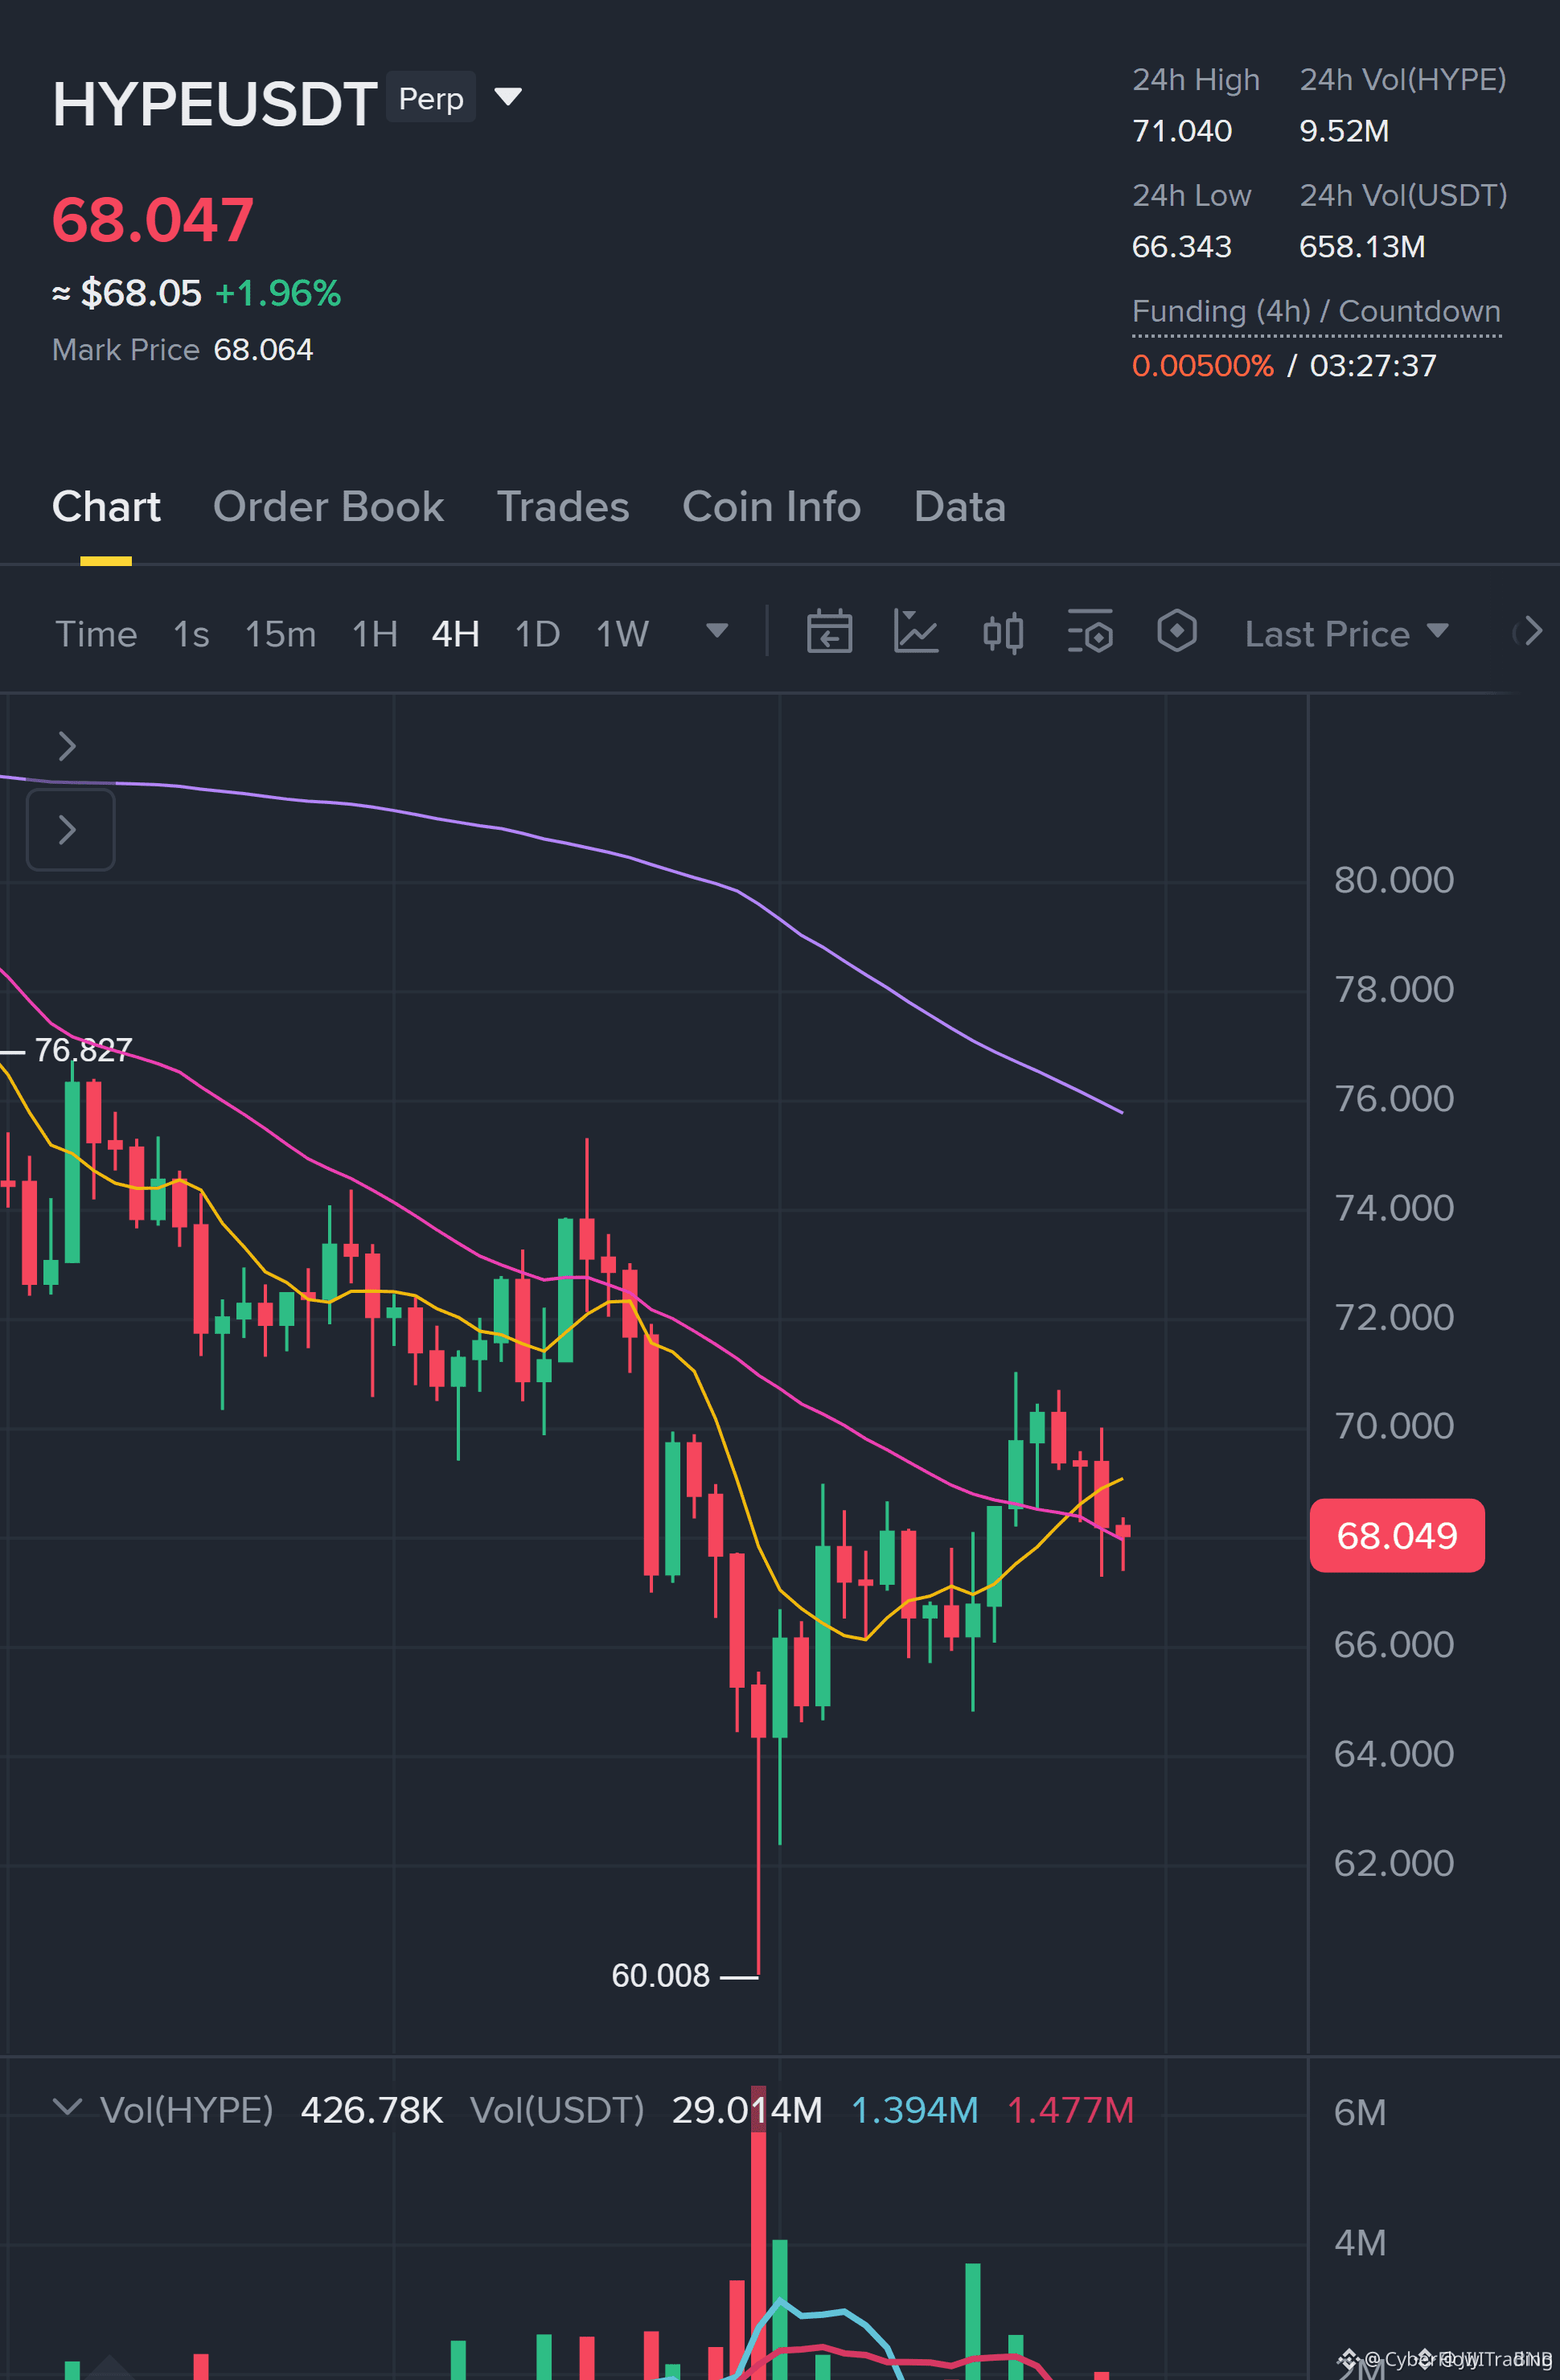
Target: 67.22 / 67.112 / 66.64 🎯
Stop Loss: 68.756 ⚠️
The 4h EMA structure leans heavily into bearish territory as sellers eye a clean rejection inside the overhead zone. 📊 Price action is currently consolidating below resistance while we wait for a confirmed 15m candle close to validate the downside expansion. ⚡
Watch that 67.002 level closely because lingering support there could stall momentum before hitting deeper targets. 🌊 Are you positioning for the short breakdown here or waiting for the lower timeframes to lock in confirmation first? 👇
⚠️ Not financial advice. Always manage your risk. 🛡️
🏷️ #HYPE #ShortSetup #CryptoFutures #Trading
📉 🐻
🚨 $HYPE BEARS CRUNCHING THE 4H STRUCTURE AS SHORT MOMENTUM BUILDS 📉
Entry: 67.768 – 67.987 ⚡
Target: 67.22 / 67.112 / 66.64 🎯
Stop Loss: 68.756 ⚠️
The 4h EMA structure leans heavily into bearish territory as sellers eye a clean rejection inside the overhead zone. 📊 Price action is currently consolidating below resistance while we wait for a confirmed 15m candle close to validate the downside expansion. ⚡
Watch that 67.002 level closely because lingering support there could stall momentum before hitting deeper targets. 🌊 Are you positioning for the short breakdown here or waiting for the lower timeframes to lock in confirmation first? 👇
⚠️ Not financial advice. Always manage your risk. 🛡️
🏷️ #HYPE #ShortSetup #CryptoFutures #Trading
📉 🐻
Entry: 67.768 – 67.987 ⚡
Target: 67.22 / 67.112 / 66.64 🎯
Stop Loss: 68.756 ⚠️
The 4h EMA structure leans heavily into bearish territory as sellers eye a clean rejection inside the overhead zone. 📊 Price action is currently consolidating below resistance while we wait for a confirmed 15m candle close to validate the downside expansion. ⚡
Watch that 67.002 level closely because lingering support there could stall momentum before hitting deeper targets. 🌊 Are you positioning for the short breakdown here or waiting for the lower timeframes to lock in confirmation first? 👇
⚠️ Not financial advice. Always manage your risk. 🛡️
🏷️ #HYPE #ShortSetup #CryptoFutures #Trading
📉 🐻
44
Log in to explore more content
Join global crypto users on Binance Square
⚡️ Get latest and useful information about crypto.
💬 Trusted by the world’s largest crypto exchange.
👍 Discover real insights from verified creators.
Email / Phone number
Trending Topics
1
#NvidiaEarningsTonight:AIStocks’NextMove?
112,973 views
1,240 Discussing
2
#A Packed Week of Earnings and Data Tests Markets
144,213 views
652 Discussing
3
#AnthropicIPOTestsInvestorAppetiteForAI
318,850 views
2,853 Discussing
4
#NvidiaBoardNotConsideringHuang’sReturnasCEO
113,199 views
943 Discussing
5
#KOSPIFalls2.59%ToLowestCloseSinceFebruary
28,432 views
306 Discussing
6
#AnthropicClearedToListOnNasdaqAsANT
25,429 views
264 Discussing
7
#WhatInvestmentSignalsDo13FFilingsReveal?
61,941 views
659 Discussing
8
#TetherCapitalMakesStrategicInvestmentInStables
14,108 views
112 Discussing
9
#EvernorthRecords$505MImpairmentOnPreListingXRP
1,725 views
20 Discussing
10
#GoldmanSachsReports$1.22BInEtherETFHoldings
1,271 views
17 Discussing