

#gold
gold
23.9M views
60,311 Discussing
Hot
Latest

·
--
$XAU Technical Update: Key Price Levels and Long Setup
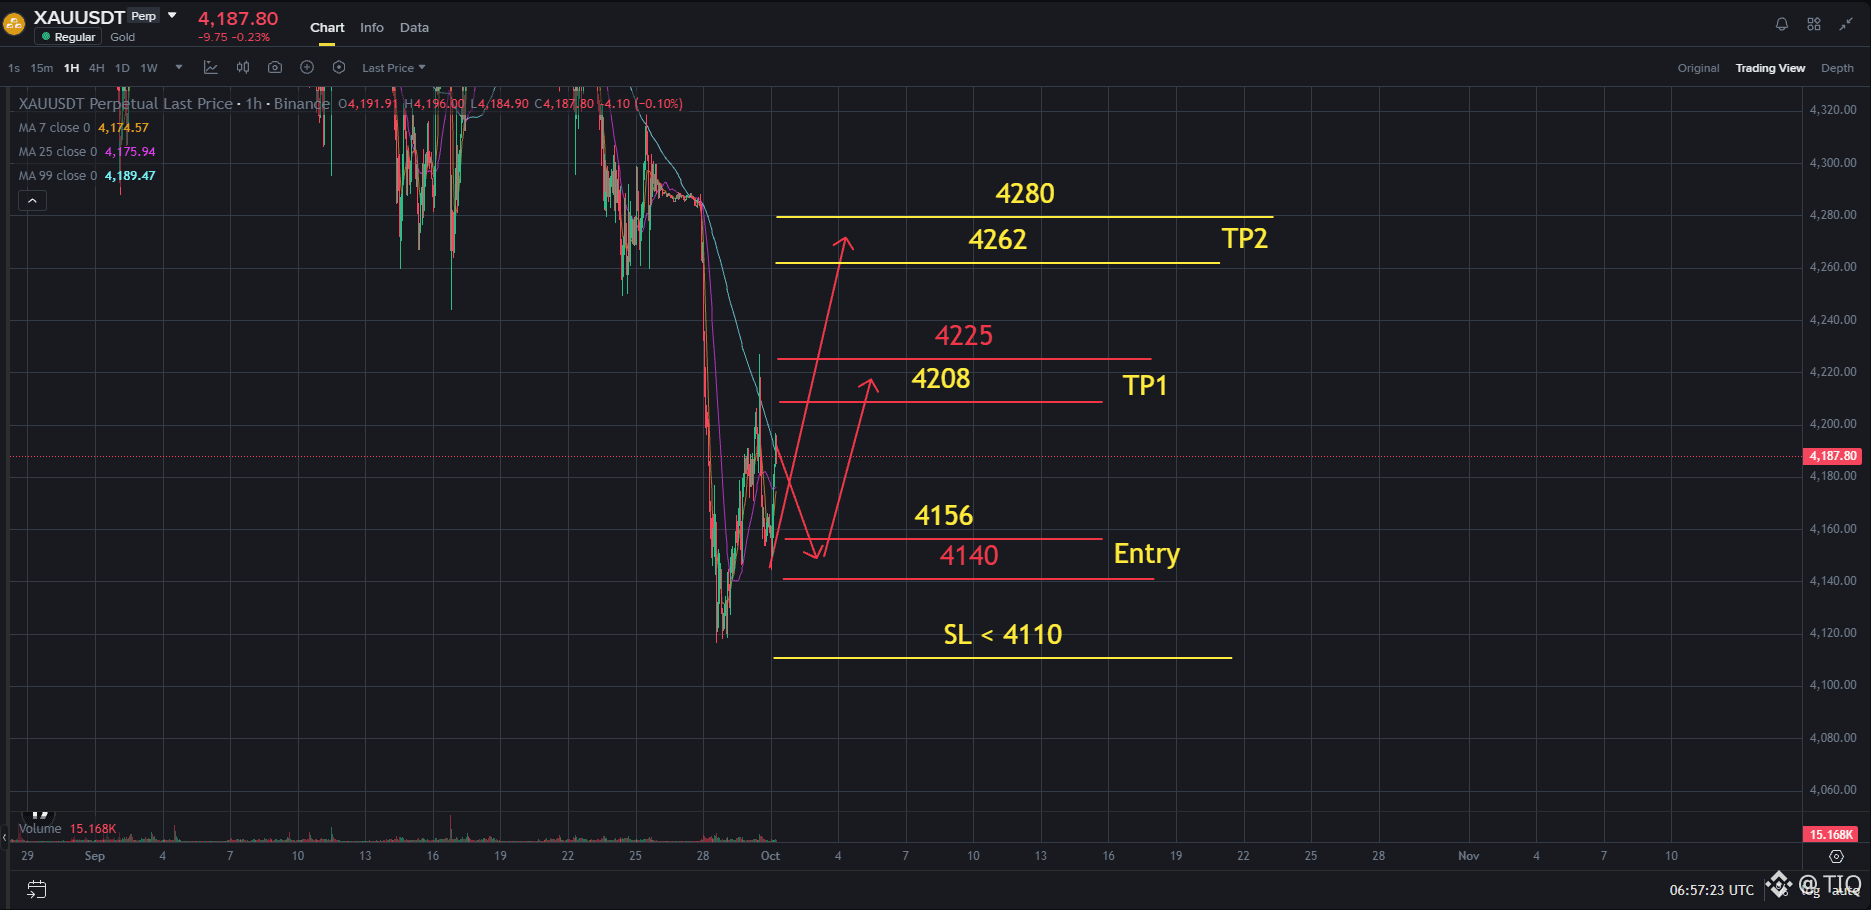
💥The XAU/USDT 1h chart shows gold stabilizing and attempting a bounce after a sharp sell-off from overhead resistance. The price is currently hovering around 4187, trading near its key short-term moving averages (MA 7 at 4174, MA 25 at 4175, and MA 99 at 4189). A slight pullback to retest support is expected to accumulate buying interest before price initiates a stronger recovery toward higher resistance targets
👉Entry Long: 4140 - 4156
💥Stop Loss - SL : < 4110
🎉TP1: 4208 - 4225
🎉TP2: 4262 - 4280
Disclaimer: This technical analysis is based on chart patterns and is intended for informational purposes only. Always practice strict risk management and set stop loss orders on every trade
Click here to view the chart #GOLD 👇️👇👇
{future}(XAUUSDT)
$XAU Technical Update: Key Price Levels and Long Setup
💥The XAU/USDT 1h chart shows gold stabilizing and attempting a bounce after a sharp sell-off from overhead resistance. The price is currently hovering around 4187, trading near its key short-term moving averages (MA 7 at 4174, MA 25 at 4175, and MA 99 at 4189). A slight pullback to retest support is expected to accumulate buying interest before price initiates a stronger recovery toward higher resistance targets
👉Entry Long: 4140 - 4156
💥Stop Loss - SL : < 4110
🎉TP1: 4208 - 4225
🎉TP2: 4262 - 4280
Disclaimer: This technical analysis is based on chart patterns and is intended for informational purposes only. Always practice strict risk management and set stop loss orders on every trade
Click here to view the chart #GOLD 👇️👇👇
💥The XAU/USDT 1h chart shows gold stabilizing and attempting a bounce after a sharp sell-off from overhead resistance. The price is currently hovering around 4187, trading near its key short-term moving averages (MA 7 at 4174, MA 25 at 4175, and MA 99 at 4189). A slight pullback to retest support is expected to accumulate buying interest before price initiates a stronger recovery toward higher resistance targets
👉Entry Long: 4140 - 4156
💥Stop Loss - SL : < 4110
🎉TP1: 4208 - 4225
🎉TP2: 4262 - 4280
Disclaimer: This technical analysis is based on chart patterns and is intended for informational purposes only. Always practice strict risk management and set stop loss orders on every trade
Click here to view the chart #GOLD 👇️👇👇
681

·
--
Bearish
$GOLD Update 👀
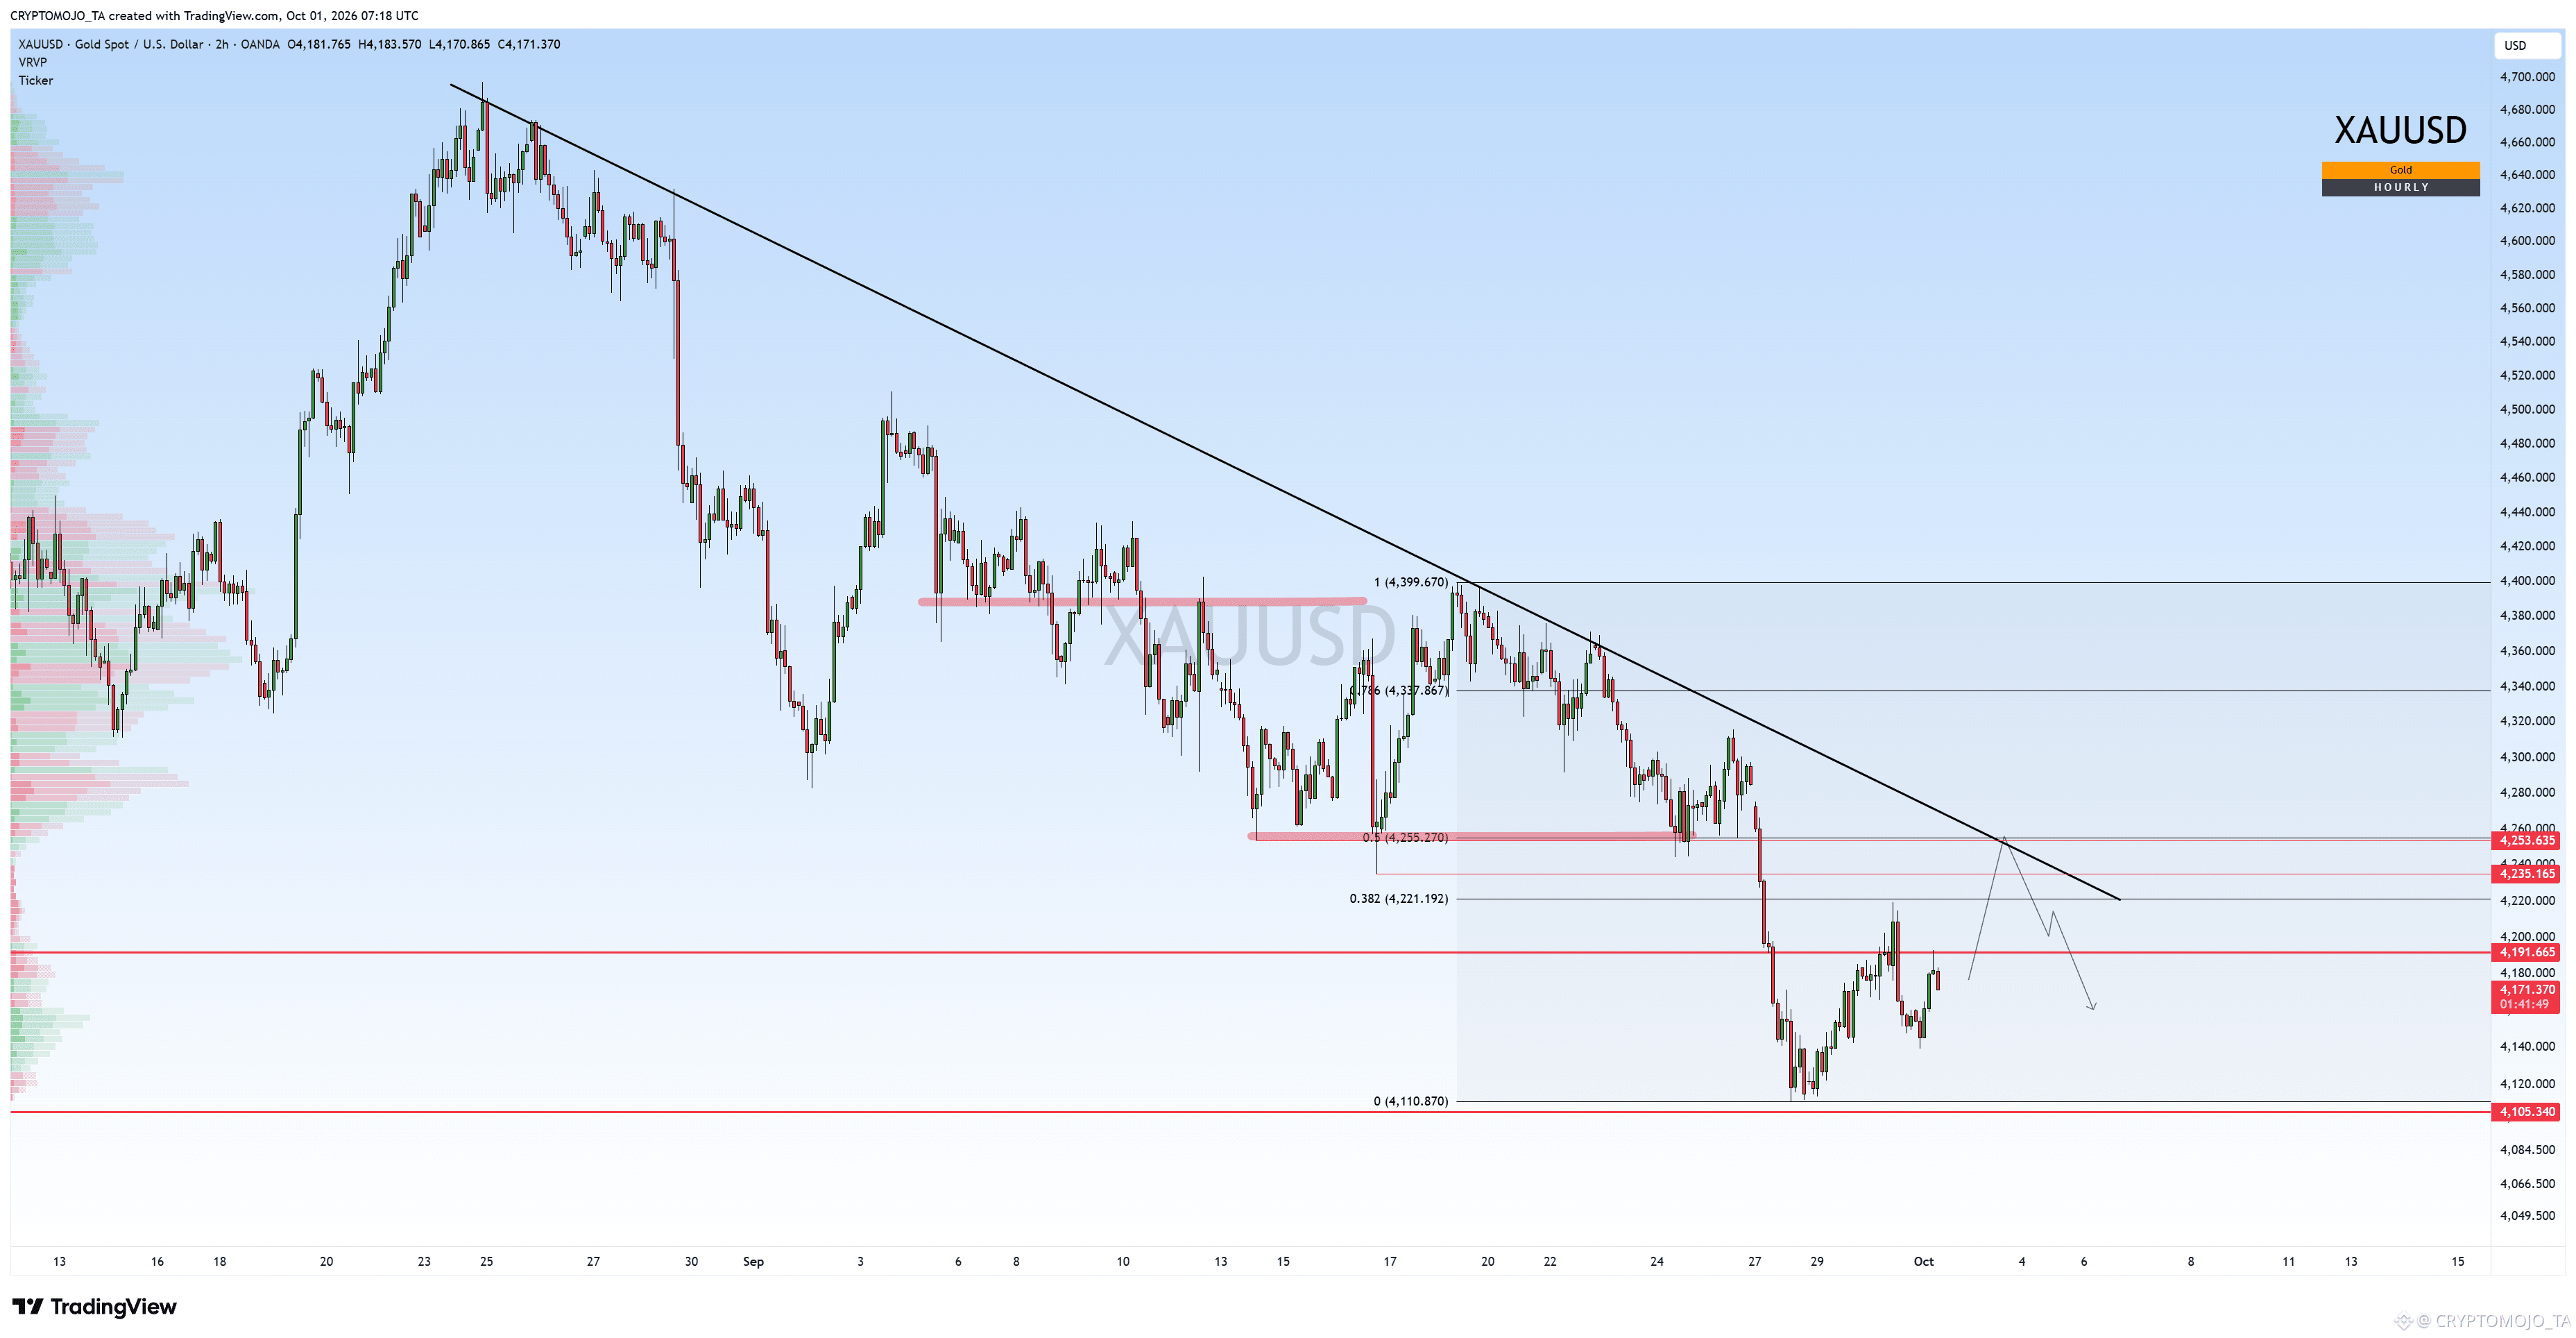
Gold is bouncing from the $4,140 area after the sharp breakdown, but for now this looks more like a counter-trend correction within the broader bearish structure.
The Fibonacci levels on the chart are also lining up well with the resistance areas:
0.382 Fib: ~$4,221
Key horizontal resistance: ~$4,235
0.5 Fib: ~$4,255
So the $4,220–$4,255 zone is a very important area for this bounce. It also lines up with the previous breakdown and the descending trendline, making it a strong area to watch for a possible rejection.
If Gold reaches this zone and fails to reclaim it, the downside levels remain $4,140, followed by the 0 Fib around $4,111 and the $4,100 area.
The broader fundamental backdrop also remains a headwind, with a stronger dollar, elevated yields and strong US data keeping pressure on gold. With important US economic data ahead, volatility could increase.
But if Gold manages to reclaim $4,255 and breaks back above the descending trendline, the bearish setup would start to weaken.
For now, $4,220–$4,255 is the main zone I’m watching. The reaction here could decide whether this is just a relief bounce or the start of a bigger recovery.
#GOLD
$GOLD Update 👀
Gold is bouncing from the $4,140 area after the sharp breakdown, but for now this looks more like a counter-trend correction within the broader bearish structure.
The Fibonacci levels on the chart are also lining up well with the resistance areas:
0.382 Fib: ~$4,221
Key horizontal resistance: ~$4,235
0.5 Fib: ~$4,255
So the $4,220–$4,255 zone is a very important area for this bounce. It also lines up with the previous breakdown and the descending trendline, making it a strong area to watch for a possible rejection.
If Gold reaches this zone and fails to reclaim it, the downside levels remain $4,140, followed by the 0 Fib around $4,111 and the $4,100 area.
The broader fundamental backdrop also remains a headwind, with a stronger dollar, elevated yields and strong US data keeping pressure on gold. With important US economic data ahead, volatility could increase.
But if Gold manages to reclaim $4,255 and breaks back above the descending trendline, the bearish setup would start to weaken.
For now, $4,220–$4,255 is the main zone I’m watching. The reaction here could decide whether this is just a relief bounce or the start of a bigger recovery.
#GOLD
Gold is bouncing from the $4,140 area after the sharp breakdown, but for now this looks more like a counter-trend correction within the broader bearish structure.
The Fibonacci levels on the chart are also lining up well with the resistance areas:
0.382 Fib: ~$4,221
Key horizontal resistance: ~$4,235
0.5 Fib: ~$4,255
So the $4,220–$4,255 zone is a very important area for this bounce. It also lines up with the previous breakdown and the descending trendline, making it a strong area to watch for a possible rejection.
If Gold reaches this zone and fails to reclaim it, the downside levels remain $4,140, followed by the 0 Fib around $4,111 and the $4,100 area.
The broader fundamental backdrop also remains a headwind, with a stronger dollar, elevated yields and strong US data keeping pressure on gold. With important US economic data ahead, volatility could increase.
But if Gold manages to reclaim $4,255 and breaks back above the descending trendline, the bearish setup would start to weaken.
For now, $4,220–$4,255 is the main zone I’m watching. The reaction here could decide whether this is just a relief bounce or the start of a bigger recovery.
#GOLD
289

·
--
Bullish
🔥 GOLD: ANOTHER MAJOR OPPORTUNITY MAY BE FORMING — START BUYING NOW $XAU $XAUT
Gold is pulling back, and I’m using this weakness to start accumulating through DCA.
I’m not trying to catch the exact bottom. I want to build my position gradually while keeping capital available for deeper corrections.
🥇 WHY GOLD?
• Central-bank demand remains a key structural driver
• Gold remains a hedge against economic & geopolitical uncertainty
• Interest rates and the U.S. dollar can create major opportunities in Gold
• Strong corrections can offer better long-term risk/reward
• Gold has repeatedly shown how quickly momentum can return after accumulation
📊 HISTORY CAN RHYME
We saw a similar opportunity in January 2026.
Gold found support around the $4,100–$4,300 area before eventually pushing toward $5,500+.
That doesn’t guarantee the same move will happen again.
But it reminds us why I prefer accumulating during weakness rather than chasing after a breakout.
🎯 MY DCA ZONES
🟢 $4,100–$4,200 — Start accumulating
🟢 $4,000–$4,100 — Add more
🟢 $3,850–$4,000 — Stronger DCA
🟢 Below $3,850 — Deeper accumulation if the long-term structure remains intact
💰 MY PLAN
Start buying → DCA lower → Hold → Let the market develop.
If Gold goes lower, I have capital to add.
If Gold moves higher, I’m already positioned.
I’m not looking for the perfect bottom — I’m preparing for the next major move.
⚠️ Gold can still correct further, so position sizing and risk management remain important.
Patience + positioning + DCA.
#GOLD #XAUUSD #TradeWithYota #xau
{spot}(XAUTUSDT)
{future}(XAUUSDT)
🔥 GOLD: ANOTHER MAJOR OPPORTUNITY MAY BE FORMING — START BUYING NOW $XAU $XAUT
Gold is pulling back, and I’m using this weakness to start accumulating through DCA.
I’m not trying to catch the exact bottom. I want to build my position gradually while keeping capital available for deeper corrections.
🥇 WHY GOLD?
• Central-bank demand remains a key structural driver
• Gold remains a hedge against economic & geopolitical uncertainty
• Interest rates and the U.S. dollar can create major opportunities in Gold
• Strong corrections can offer better long-term risk/reward
• Gold has repeatedly shown how quickly momentum can return after accumulation
📊 HISTORY CAN RHYME
We saw a similar opportunity in January 2026.
Gold found support around the $4,100–$4,300 area before eventually pushing toward $5,500+.
That doesn’t guarantee the same move will happen again.
But it reminds us why I prefer accumulating during weakness rather than chasing after a breakout.
🎯 MY DCA ZONES
🟢 $4,100–$4,200 — Start accumulating
🟢 $4,000–$4,100 — Add more
🟢 $3,850–$4,000 — Stronger DCA
🟢 Below $3,850 — Deeper accumulation if the long-term structure remains intact
💰 MY PLAN
Start buying → DCA lower → Hold → Let the market develop.
If Gold goes lower, I have capital to add.
If Gold moves higher, I’m already positioned.
I’m not looking for the perfect bottom — I’m preparing for the next major move.
⚠️ Gold can still correct further, so position sizing and risk management remain important.
Patience + positioning + DCA.
#GOLD #XAUUSD #TradeWithYota #xau
Gold is pulling back, and I’m using this weakness to start accumulating through DCA.
I’m not trying to catch the exact bottom. I want to build my position gradually while keeping capital available for deeper corrections.
🥇 WHY GOLD?
• Central-bank demand remains a key structural driver
• Gold remains a hedge against economic & geopolitical uncertainty
• Interest rates and the U.S. dollar can create major opportunities in Gold
• Strong corrections can offer better long-term risk/reward
• Gold has repeatedly shown how quickly momentum can return after accumulation
📊 HISTORY CAN RHYME
We saw a similar opportunity in January 2026.
Gold found support around the $4,100–$4,300 area before eventually pushing toward $5,500+.
That doesn’t guarantee the same move will happen again.
But it reminds us why I prefer accumulating during weakness rather than chasing after a breakout.
🎯 MY DCA ZONES
🟢 $4,100–$4,200 — Start accumulating
🟢 $4,000–$4,100 — Add more
🟢 $3,850–$4,000 — Stronger DCA
🟢 Below $3,850 — Deeper accumulation if the long-term structure remains intact
💰 MY PLAN
Start buying → DCA lower → Hold → Let the market develop.
If Gold goes lower, I have capital to add.
If Gold moves higher, I’m already positioned.
I’m not looking for the perfect bottom — I’m preparing for the next major move.
⚠️ Gold can still correct further, so position sizing and risk management remain important.
Patience + positioning + DCA.
#GOLD #XAUUSD #TradeWithYota #xau

372
Lina Trend Pro — Trend Analysis on XAUUSD
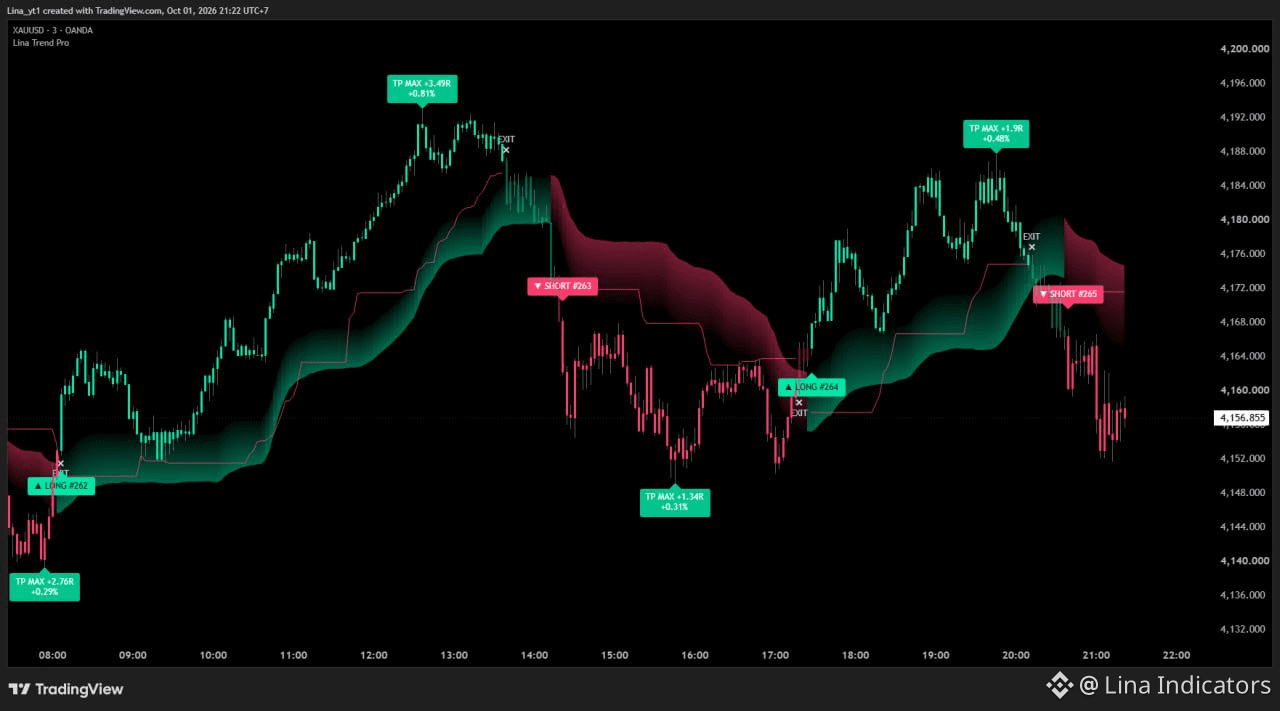
Testing the latest version on XAUUSD 3M.
The indicator combines trend structure, LONG/SHORT regime changes, protective levels, exit markers and maximum favorable movement after each signal.
The goal is simple: make trend conditions easier to read without overcrowding the chart.
This chart is shared for market analysis and educational purposes only. It is not financial advice.
#XAUUSD #GOLD #tradingview $XAU
{future}(XAUUSDT)
Lina Trend Pro — Trend Analysis on XAUUSD
Testing the latest version on XAUUSD 3M.
The indicator combines trend structure, LONG/SHORT regime changes, protective levels, exit markers and maximum favorable movement after each signal.
The goal is simple: make trend conditions easier to read without overcrowding the chart.
This chart is shared for market analysis and educational purposes only. It is not financial advice.
#XAUUSD #GOLD #tradingview $XAU
Testing the latest version on XAUUSD 3M.
The indicator combines trend structure, LONG/SHORT regime changes, protective levels, exit markers and maximum favorable movement after each signal.
The goal is simple: make trend conditions easier to read without overcrowding the chart.
This chart is shared for market analysis and educational purposes only. It is not financial advice.
#XAUUSD #GOLD #tradingview $XAU
1
249

GOLD (XAU/USD) — Signal Signs
Gold is around $4,160–$4,176 now.
🟢 BUY sign: 4H close above $4,220 → targets $4,265 / $4,300
🔴 SELL sign: rejection around $4,210–4,220 → targets $4,140 / $4,110
⚠️ Key support: $4,140–4,110. Current market remains volatile ahead of U.S. jobs data.
Best approach: wait for a confirmed 4H candle + retest before entry.
$BTC
{spot}(BTCUSDT)
#XAI/USDT
#BTC走势分析
#GOLD
GOLD (XAU/USD) — Signal Signs
Gold is around $4,160–$4,176 now.
🟢 BUY sign: 4H close above $4,220 → targets $4,265 / $4,300
🔴 SELL sign: rejection around $4,210–4,220 → targets $4,140 / $4,110
⚠️ Key support: $4,140–4,110. Current market remains volatile ahead of U.S. jobs data.
Best approach: wait for a confirmed 4H candle + retest before entry.
$BTC
#XAI/USDT
#BTC走势分析
#GOLD
Gold is around $4,160–$4,176 now.
🟢 BUY sign: 4H close above $4,220 → targets $4,265 / $4,300
🔴 SELL sign: rejection around $4,210–4,220 → targets $4,140 / $4,110
⚠️ Key support: $4,140–4,110. Current market remains volatile ahead of U.S. jobs data.
Best approach: wait for a confirmed 4H candle + retest before entry.
$BTC
#XAI/USDT
#BTC走势分析
#GOLD
93
XAU/USD — Expert-Style Signal Map
BTC$BTC
Gold is around $4,170, with $4,190–4,220 acting as the key resistance area and $4,140–4,110 as major support.
🔴 SELL setup: Rejection at $4,190–4,220
Entry: 4,185–4,205 | SL: 4,235 | TP: 4,140 → 4,110
🟢 BUY setup: 4H close above $4,220 + successful retest
Entry: 4,220–4,230 | SL: 4,190 | TP: 4,260 → 4,300
⚡ BREAKDOWN: 4H close below $4,110 → possible $4,044 target.
Key rule: Don't enter in the middle around $4,160–4,180; wait for rejection or confirmed breakout.
#GOLD
XAU/USD — Expert-Style Signal Map
BTC$BTC
Gold is around $4,170, with $4,190–4,220 acting as the key resistance area and $4,140–4,110 as major support.
🔴 SELL setup: Rejection at $4,190–4,220
Entry: 4,185–4,205 | SL: 4,235 | TP: 4,140 → 4,110
🟢 BUY setup: 4H close above $4,220 + successful retest
Entry: 4,220–4,230 | SL: 4,190 | TP: 4,260 → 4,300
⚡ BREAKDOWN: 4H close below $4,110 → possible $4,044 target.
Key rule: Don't enter in the middle around $4,160–4,180; wait for rejection or confirmed breakout.
#GOLD
BTC$BTC
Gold is around $4,170, with $4,190–4,220 acting as the key resistance area and $4,140–4,110 as major support.
🔴 SELL setup: Rejection at $4,190–4,220
Entry: 4,185–4,205 | SL: 4,235 | TP: 4,140 → 4,110
🟢 BUY setup: 4H close above $4,220 + successful retest
Entry: 4,220–4,230 | SL: 4,190 | TP: 4,260 → 4,300
⚡ BREAKDOWN: 4H close below $4,110 → possible $4,044 target.
Key rule: Don't enter in the middle around $4,160–4,180; wait for rejection or confirmed breakout.
#GOLD
42

·
--

Article
Gold Market 2026: Why Gold Still Matters in a Changing Financial World🪙 WHY GOLD STILL MATTERS IN TODAY’S MARKET
Gold has remained one of the world’s most recognized stores of value for thousands of years. Even as digital assets and modern financial markets continue to grow, gold still plays an important role in the global economy.
📈 Why do investors watch gold?
Gold often attracts attention during periods of economic uncertainty, inflation concerns, currency weakness, and geopolitical tensions. Central banks also hold gold as part of their reserves, making the metal an important part of the global financial system.
But gold is not risk-free. Its price can move up or down depending on interest rates, the strength of major currencies, investor demand, central-bank activity, and global economic conditions.
🔍 The key takeaway:
Gold isn't simply a shiny metal—it is a major global financial asset with a long history.
The big question is:
Will gold continue to play the same role in the next decade, or will new assets change the way people preserve wealth?
💬 What do you think—will gold remain one of the most important assets in the future?
#Gold #goldmarket #Investing #Finance #PreciousMetals $GOLD.US
Gold Market 2026: Why Gold Still Matters in a Changing Financial World
🪙 WHY GOLD STILL MATTERS IN TODAY’S MARKET
Gold has remained one of the world’s most recognized stores of value for thousands of years. Even as digital assets and modern financial markets continue to grow, gold still plays an important role in the global economy.
📈 Why do investors watch gold?
Gold often attracts attention during periods of economic uncertainty, inflation concerns, currency weakness, and geopolitical tensions. Central banks also hold gold as part of their reserves, making the metal an important part of the global financial system.
But gold is not risk-free. Its price can move up or down depending on interest rates, the strength of major currencies, investor demand, central-bank activity, and global economic conditions.
🔍 The key takeaway:
Gold isn't simply a shiny metal—it is a major global financial asset with a long history.
The big question is:
Will gold continue to play the same role in the next decade, or will new assets change the way people preserve wealth?
💬 What do you think—will gold remain one of the most important assets in the future?
#Gold #goldmarket #Investing #Finance #PreciousMetals $GOLD.US
Gold has remained one of the world’s most recognized stores of value for thousands of years. Even as digital assets and modern financial markets continue to grow, gold still plays an important role in the global economy.
📈 Why do investors watch gold?
Gold often attracts attention during periods of economic uncertainty, inflation concerns, currency weakness, and geopolitical tensions. Central banks also hold gold as part of their reserves, making the metal an important part of the global financial system.
But gold is not risk-free. Its price can move up or down depending on interest rates, the strength of major currencies, investor demand, central-bank activity, and global economic conditions.
🔍 The key takeaway:
Gold isn't simply a shiny metal—it is a major global financial asset with a long history.
The big question is:
Will gold continue to play the same role in the next decade, or will new assets change the way people preserve wealth?
💬 What do you think—will gold remain one of the most important assets in the future?
#Gold #goldmarket #Investing #Finance #PreciousMetals $GOLD.US
36

·
--
Bullish
#Gold is trading around $4,160–$4,175 per ounce today.
After a strong drop in September, gold is showing some signs of stabilization. Softer-than-expected US inflation has reduced expectations of an October Fed rate hike, which is giving some support to gold.
For traders, I’m watching the $4,200 area closely. A clear break above it could improve bullish momentum, while rejection may bring another pullback.
Gold is still volatile, so confirmation matters more than chasing the move.
What are you watching — bullish or bearish?
#Gold #XAUUSD #GoldPrice #Trading #Forex
#Gold is trading around $4,160–$4,175 per ounce today.
After a strong drop in September, gold is showing some signs of stabilization. Softer-than-expected US inflation has reduced expectations of an October Fed rate hike, which is giving some support to gold.
For traders, I’m watching the $4,200 area closely. A clear break above it could improve bullish momentum, while rejection may bring another pullback.
Gold is still volatile, so confirmation matters more than chasing the move.
What are you watching — bullish or bearish?
#Gold #XAUUSD #GoldPrice #Trading #Forex
After a strong drop in September, gold is showing some signs of stabilization. Softer-than-expected US inflation has reduced expectations of an October Fed rate hike, which is giving some support to gold.
For traders, I’m watching the $4,200 area closely. A clear break above it could improve bullish momentum, while rejection may bring another pullback.
Gold is still volatile, so confirmation matters more than chasing the move.
What are you watching — bullish or bearish?
#Gold #XAUUSD #GoldPrice #Trading #Forex
141

·
--
Article
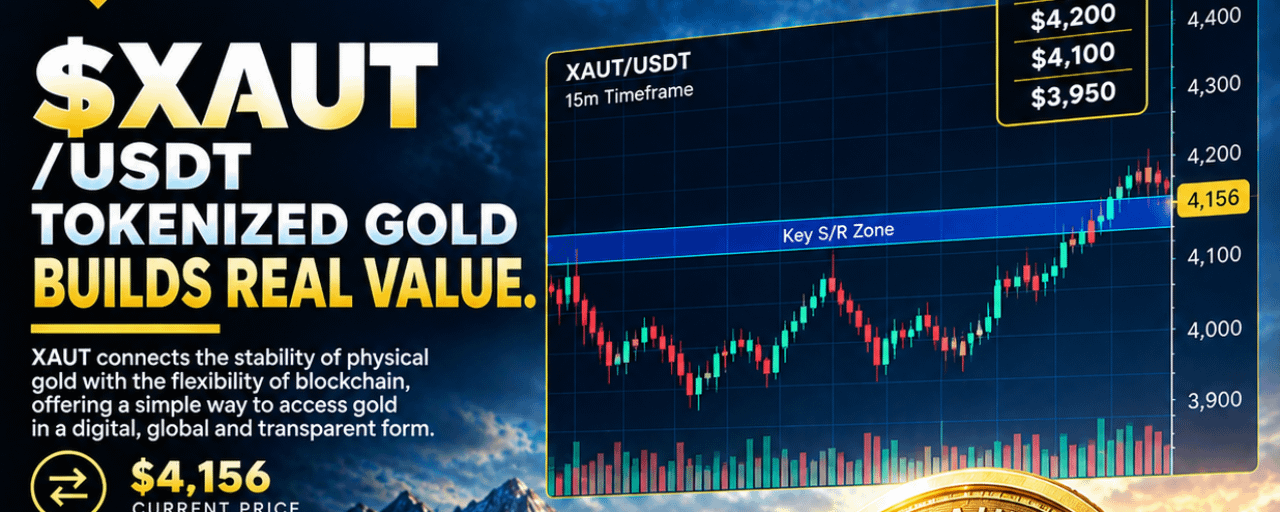
XAUT is showing why tokenized gold is becoming more than just a crypto version of holding bullionI’m watching the $4,100–$4,200 zone closely because XAUT recently pulled back with gold, closing around $4,156 on September 30 after trading near $4,375 earlier in the month. Daily trading volume has remained active, with roughly $192M recorded on October 1, while XAUT’s market cap is around $3.36B.
The part that really stands out to me is what is happening underneath the token
XAUT represents one fine troy ounce of physical gold held in allocated form, with the underlying bullion stored in Switzerland. Tether reported that XAUT holdings increased 9.5% during Q2 2026 even while gold prices fell 14.1% during the quarter, showing that demand for tokenized gold continued during a correction.
That creates a different setup from a normal crypto asset
XAUT is directly tied to the gold market, so its next move depends heavily on macro conditions rather than crypto momentum alone. Recent gold weakness has been linked to rising U.S. Treasury yields and expectations for additional Federal Reserve rate hikes, with spot gold falling as low as $4,111 on September 28.
There is also an interesting adoption angle
Tether recently announced a collaboration with Shiga to support self-custodial financial products across Africa and the GCC using USD₮, Bitcoin and XAU₮. The products are designed to let individuals, businesses and institutions hold and transfer XAU₮ directly, while financial institutions can build payment and treasury services around the infrastructure.
That matters because XAUT is increasingly being positioned as usable financial infrastructure rather than simply a digital representation of gold
Tether’s latest finance data shows about 22,168.9 kg of gold associated with XAU₮, while the token’s market cap is listed around $2.95B on its finance page.
From the chart, I’d keep the levels simple
Bullish confirmation: XAUT holds the $4,100–$4,150 area and then reclaims $4,200 with stronger buying volume. Acceptance above that zone would suggest the recent gold correction is finding demand rather than turning into a deeper breakdown
Bearish confirmation: losing $4,100 and failing to reclaim it would keep the short-term structure under pressure and expose the next downside area around $4,000
The bigger story here is not just whether XAUT moves higher or lower
It is whether tokenized gold can continue gaining real utility while physical gold remains an important macro asset. XAUT already combines blockchain transferability with allocated physical gold, and expanding self-custodial and institutional use could make that structure increasingly relevant
For now, I’m watching the $4,100 support and $4,200 reclaim more closely than the headline price because that should tell us whether buyers are actually returning or simply defending the recent correction
$XAUT #XAUT #GOLD
XAUT is showing why tokenized gold is becoming more than just a crypto version of holding bullion
I’m watching the $4,100–$4,200 zone closely because XAUT recently pulled back with gold, closing around $4,156 on September 30 after trading near $4,375 earlier in the month. Daily trading volume has remained active, with roughly $192M recorded on October 1, while XAUT’s market cap is around $3.36B.
The part that really stands out to me is what is happening underneath the token
XAUT represents one fine troy ounce of physical gold held in allocated form, with the underlying bullion stored in Switzerland. Tether reported that XAUT holdings increased 9.5% during Q2 2026 even while gold prices fell 14.1% during the quarter, showing that demand for tokenized gold continued during a correction.
That creates a different setup from a normal crypto asset
XAUT is directly tied to the gold market, so its next move depends heavily on macro conditions rather than crypto momentum alone. Recent gold weakness has been linked to rising U.S. Treasury yields and expectations for additional Federal Reserve rate hikes, with spot gold falling as low as $4,111 on September 28.
There is also an interesting adoption angle
Tether recently announced a collaboration with Shiga to support self-custodial financial products across Africa and the GCC using USD₮, Bitcoin and XAU₮. The products are designed to let individuals, businesses and institutions hold and transfer XAU₮ directly, while financial institutions can build payment and treasury services around the infrastructure.
That matters because XAUT is increasingly being positioned as usable financial infrastructure rather than simply a digital representation of gold
Tether’s latest finance data shows about 22,168.9 kg of gold associated with XAU₮, while the token’s market cap is listed around $2.95B on its finance page.
From the chart, I’d keep the levels simple
Bullish confirmation: XAUT holds the $4,100–$4,150 area and then reclaims $4,200 with stronger buying volume. Acceptance above that zone would suggest the recent gold correction is finding demand rather than turning into a deeper breakdown
Bearish confirmation: losing $4,100 and failing to reclaim it would keep the short-term structure under pressure and expose the next downside area around $4,000
The bigger story here is not just whether XAUT moves higher or lower
It is whether tokenized gold can continue gaining real utility while physical gold remains an important macro asset. XAUT already combines blockchain transferability with allocated physical gold, and expanding self-custodial and institutional use could make that structure increasingly relevant
For now, I’m watching the $4,100 support and $4,200 reclaim more closely than the headline price because that should tell us whether buyers are actually returning or simply defending the recent correction
$XAUT #XAUT #GOLD
The part that really stands out to me is what is happening underneath the token
XAUT represents one fine troy ounce of physical gold held in allocated form, with the underlying bullion stored in Switzerland. Tether reported that XAUT holdings increased 9.5% during Q2 2026 even while gold prices fell 14.1% during the quarter, showing that demand for tokenized gold continued during a correction.
That creates a different setup from a normal crypto asset
XAUT is directly tied to the gold market, so its next move depends heavily on macro conditions rather than crypto momentum alone. Recent gold weakness has been linked to rising U.S. Treasury yields and expectations for additional Federal Reserve rate hikes, with spot gold falling as low as $4,111 on September 28.
There is also an interesting adoption angle
Tether recently announced a collaboration with Shiga to support self-custodial financial products across Africa and the GCC using USD₮, Bitcoin and XAU₮. The products are designed to let individuals, businesses and institutions hold and transfer XAU₮ directly, while financial institutions can build payment and treasury services around the infrastructure.
That matters because XAUT is increasingly being positioned as usable financial infrastructure rather than simply a digital representation of gold
Tether’s latest finance data shows about 22,168.9 kg of gold associated with XAU₮, while the token’s market cap is listed around $2.95B on its finance page.
From the chart, I’d keep the levels simple
Bullish confirmation: XAUT holds the $4,100–$4,150 area and then reclaims $4,200 with stronger buying volume. Acceptance above that zone would suggest the recent gold correction is finding demand rather than turning into a deeper breakdown
Bearish confirmation: losing $4,100 and failing to reclaim it would keep the short-term structure under pressure and expose the next downside area around $4,000
The bigger story here is not just whether XAUT moves higher or lower
It is whether tokenized gold can continue gaining real utility while physical gold remains an important macro asset. XAUT already combines blockchain transferability with allocated physical gold, and expanding self-custodial and institutional use could make that structure increasingly relevant
For now, I’m watching the $4,100 support and $4,200 reclaim more closely than the headline price because that should tell us whether buyers are actually returning or simply defending the recent correction
$XAUT #XAUT #GOLD
56

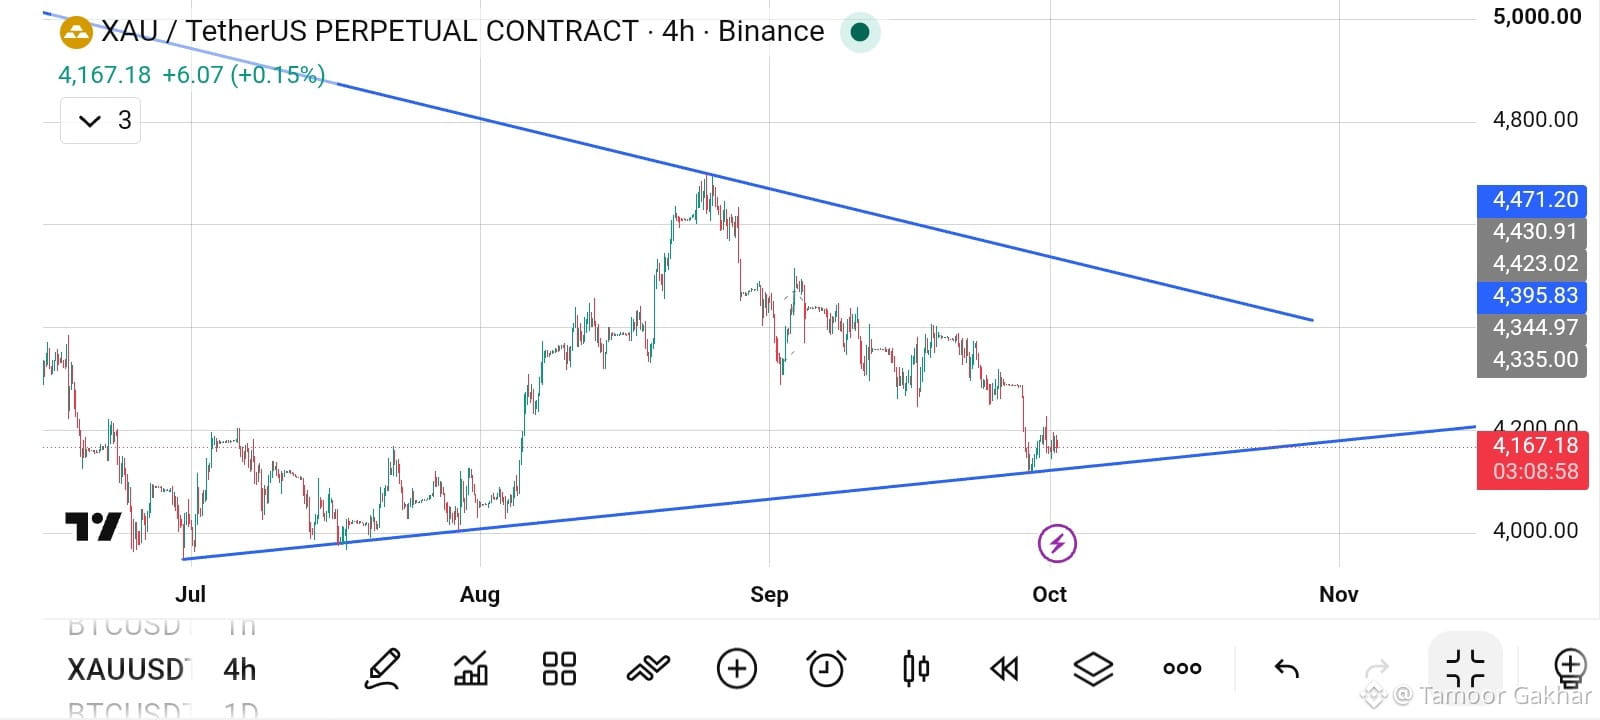
$XAU is sitting right on triangle support on the 4H. 🚨
Support: ~4,150 | Resistance: ~4,400
If the price Break TrendLine so i am Bearish Otherwise If Price Retest 4k - 4100 Level We see XAU at 44k first then 5k to 6k Final Rally.
Hold = bounce toward 4,300. Break = 4,000 in play. I'm waiting for the 4H close.
#Gold #XAU #TechnicalAnalys #TaimoorGakhar
{future}(XAUUSDT)
$XAU is sitting right on triangle support on the 4H. 🚨
Support: ~4,150 | Resistance: ~4,400
If the price Break TrendLine so i am Bearish Otherwise If Price Retest 4k - 4100 Level We see XAU at 44k first then 5k to 6k Final Rally.
Hold = bounce toward 4,300. Break = 4,000 in play. I'm waiting for the 4H close.
#Gold #XAU #TechnicalAnalys #TaimoorGakhar
Support: ~4,150 | Resistance: ~4,400
If the price Break TrendLine so i am Bearish Otherwise If Price Retest 4k - 4100 Level We see XAU at 44k first then 5k to 6k Final Rally.
Hold = bounce toward 4,300. Break = 4,000 in play. I'm waiting for the 4H close.
#Gold #XAU #TechnicalAnalys #TaimoorGakhar
140

·
--
Bearish
30D trade $XAU 26 USDT
🚨 $XAU (gold) is sitting at a level where the next move could reveal whether this sell-off is a correction or the start of a deeper trend shift.
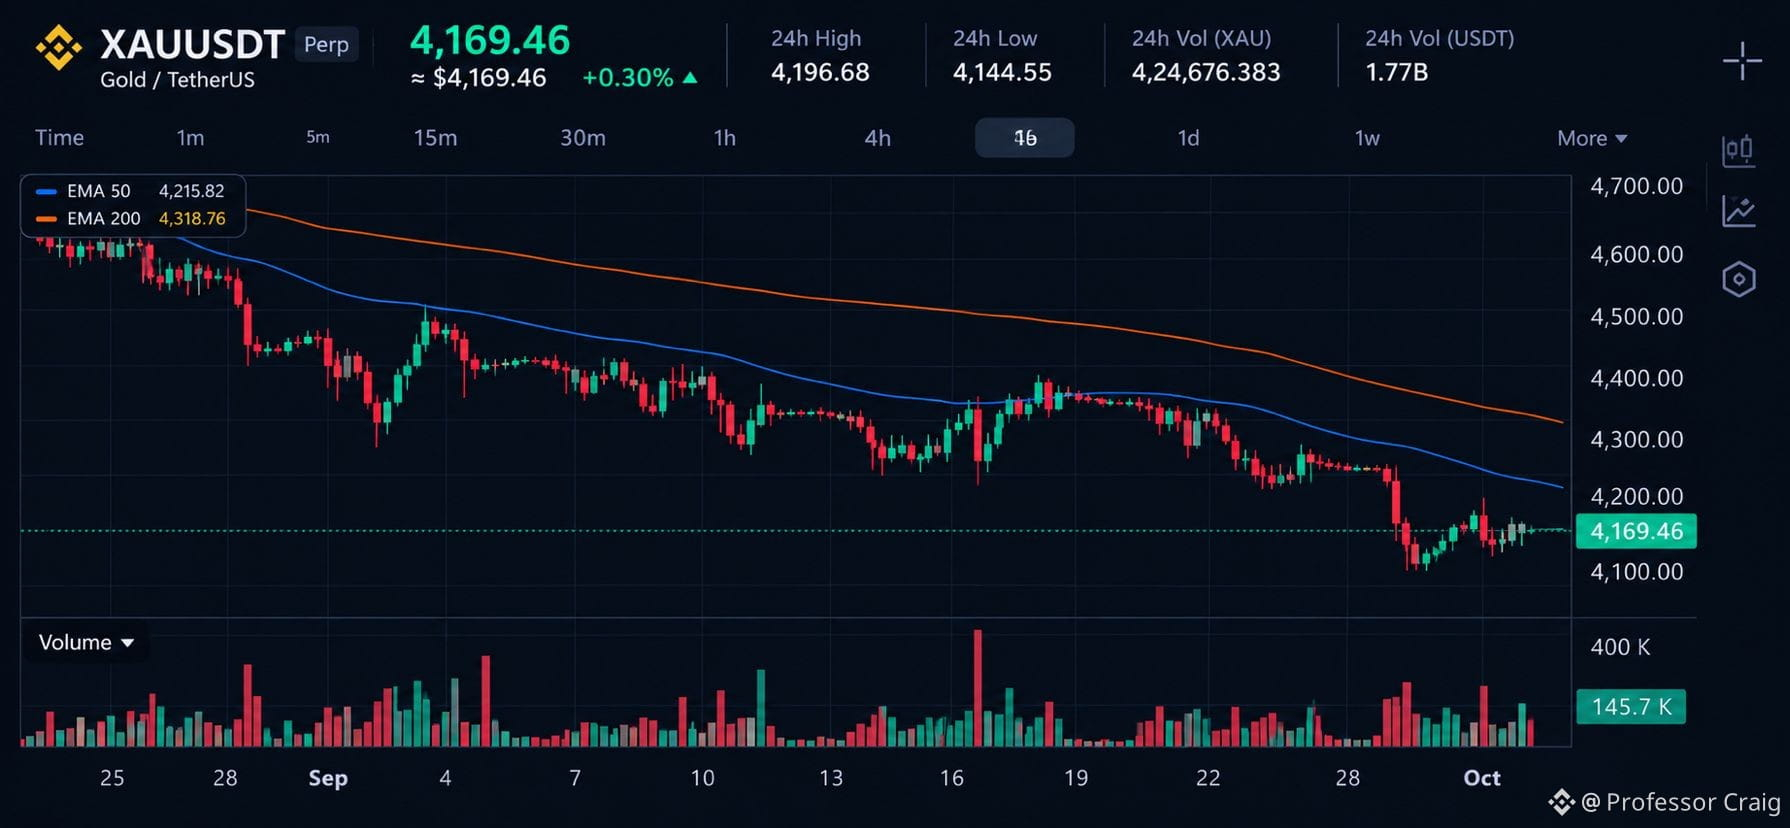
XAUUSDT is trading around $4,169 after a sharp breakdown from the $4,300–$4,400 region. The 4H structure has progressively weakened, with lower highs developing throughout the decline. The most important change is that price is now trading below both the 50 EMA and 200 EMA, while both averages are pointing downward. That combination shows that the market is no longer simply consolidating near its highs; momentum has shifted decisively toward the downside.
The recent drop below $4,200 was accompanied by increased volume, suggesting that the move had meaningful participation rather than being purely a low-liquidity move. Price then reached the $4,100 area and produced a modest rebound, but the recovery remains limited. Until XAUUSDT can reclaim $4,200 and establish acceptance above it, this bounce can still be viewed as a reaction inside a broader bearish structure.
The key area now is the $4,100–$4,200 zone. Holding above the recent low could allow gold to build a base and attempt a recovery toward the moving averages. However, another strong rejection around $4,200 would reinforce the lower-high structure and keep downside pressure active. The next few 4H candles are therefore important not because of one isolated price level, but because they will show whether buyers can actually reclaim lost structure or whether sellers remain in control.
{future}(XAUUSDT)
#xauusdt #GOLD #XAU
🚨 $XAU (gold) is sitting at a level where the next move could reveal whether this sell-off is a correction or the start of a deeper trend shift.
XAUUSDT is trading around $4,169 after a sharp breakdown from the $4,300–$4,400 region. The 4H structure has progressively weakened, with lower highs developing throughout the decline. The most important change is that price is now trading below both the 50 EMA and 200 EMA, while both averages are pointing downward. That combination shows that the market is no longer simply consolidating near its highs; momentum has shifted decisively toward the downside.
The recent drop below $4,200 was accompanied by increased volume, suggesting that the move had meaningful participation rather than being purely a low-liquidity move. Price then reached the $4,100 area and produced a modest rebound, but the recovery remains limited. Until XAUUSDT can reclaim $4,200 and establish acceptance above it, this bounce can still be viewed as a reaction inside a broader bearish structure.
The key area now is the $4,100–$4,200 zone. Holding above the recent low could allow gold to build a base and attempt a recovery toward the moving averages. However, another strong rejection around $4,200 would reinforce the lower-high structure and keep downside pressure active. The next few 4H candles are therefore important not because of one isolated price level, but because they will show whether buyers can actually reclaim lost structure or whether sellers remain in control.
#xauusdt #GOLD #XAU
XAUUSDT is trading around $4,169 after a sharp breakdown from the $4,300–$4,400 region. The 4H structure has progressively weakened, with lower highs developing throughout the decline. The most important change is that price is now trading below both the 50 EMA and 200 EMA, while both averages are pointing downward. That combination shows that the market is no longer simply consolidating near its highs; momentum has shifted decisively toward the downside.
The recent drop below $4,200 was accompanied by increased volume, suggesting that the move had meaningful participation rather than being purely a low-liquidity move. Price then reached the $4,100 area and produced a modest rebound, but the recovery remains limited. Until XAUUSDT can reclaim $4,200 and establish acceptance above it, this bounce can still be viewed as a reaction inside a broader bearish structure.
The key area now is the $4,100–$4,200 zone. Holding above the recent low could allow gold to build a base and attempt a recovery toward the moving averages. However, another strong rejection around $4,200 would reinforce the lower-high structure and keep downside pressure active. The next few 4H candles are therefore important not because of one isolated price level, but because they will show whether buyers can actually reclaim lost structure or whether sellers remain in control.
#xauusdt #GOLD #XAU
61

·
--
Bullish
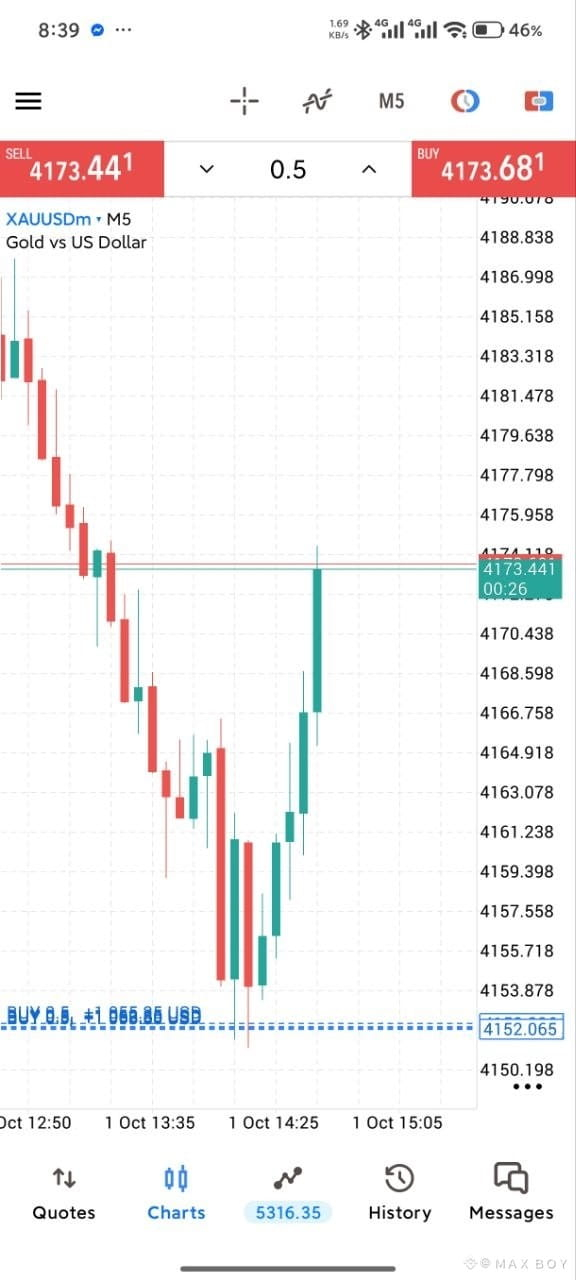
GOLD BUY NOW ❗
@4149-4151
SL 4147
TP1 4157- TP2 4060- TP3 running
$XAUT
{future}(XAUTUSDT)
#XUAUSD #tred #Gold #TrederMaxBoy
GOLD BUY NOW ❗
@4149-4151
SL 4147
TP1 4157- TP2 4060- TP3 running
$XAUT
#XUAUSD #tred #Gold #TrederMaxBoy
@4149-4151
SL 4147
TP1 4157- TP2 4060- TP3 running
$XAUT
#XUAUSD #tred #Gold #TrederMaxBoy
1
80

·
--
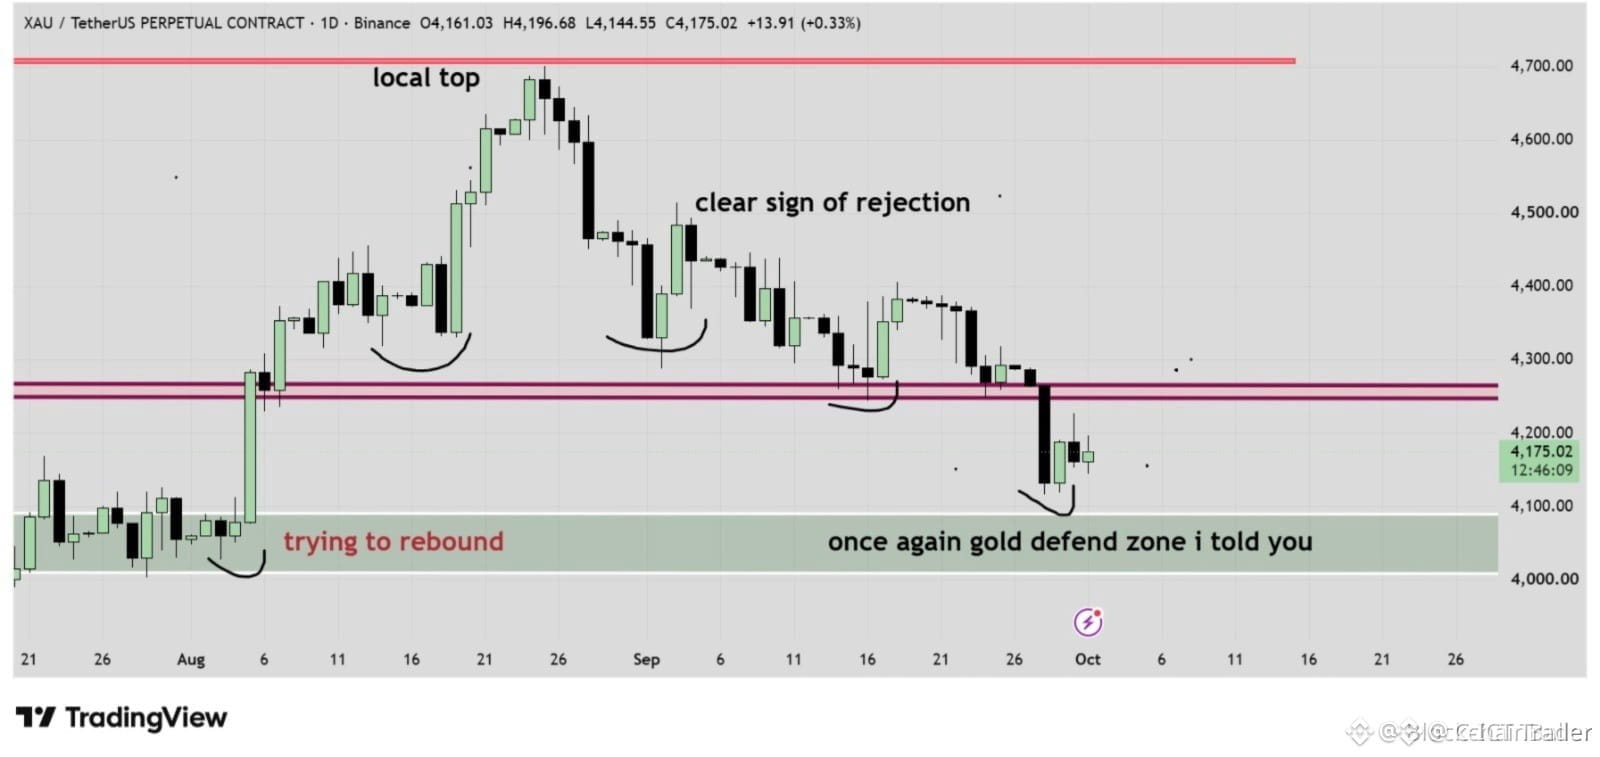
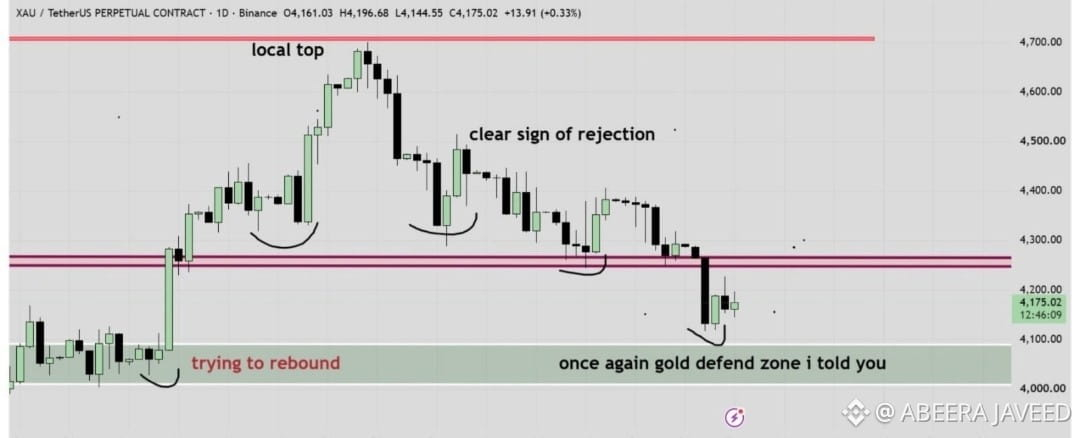
🚨 $XAU DEFENDS CRITICAL DEMAND BLOCK WITH AN EYE ON $4,280 LIQUIDITY! 🎯
Entry: 4,050 - 4,100 ⚡
Target: 4,250 - 4,280 🚀
Institutional demand held firm as $XAU successfully defended the $4,050–$4,100 accumulation zone once again. 📌 Smart money absorbed sell-side liquidity at these lows, shifting local market structure back toward higher time-frame expansion.
The immediate focus now shifts to the supply overhead between $4,250–$4,280, where a major inefficiency and resting buy-stop liquidity sit untapped. 💡 A clean reclaim of this structural level could trigger the next wave of institutional continuation. 💬 Are you anticipating a clean breakout through $4,280 or expecting another dip into the demand zone first? 👇
⚠️ Not financial advice. Always manage your risk. 🛡️
🏷️ #XAU #Gold #SmartMoney #MarketStructure
🎯 🦈
🚨 $XAU DEFENDS CRITICAL DEMAND BLOCK WITH AN EYE ON $4,280 LIQUIDITY! 🎯
Entry: 4,050 - 4,100 ⚡
Target: 4,250 - 4,280 🚀
Institutional demand held firm as $XAU successfully defended the $4,050–$4,100 accumulation zone once again. 📌 Smart money absorbed sell-side liquidity at these lows, shifting local market structure back toward higher time-frame expansion.
The immediate focus now shifts to the supply overhead between $4,250–$4,280, where a major inefficiency and resting buy-stop liquidity sit untapped. 💡 A clean reclaim of this structural level could trigger the next wave of institutional continuation. 💬 Are you anticipating a clean breakout through $4,280 or expecting another dip into the demand zone first? 👇
⚠️ Not financial advice. Always manage your risk. 🛡️
🏷️ #XAU #Gold #SmartMoney #MarketStructure
🎯 🦈
Entry: 4,050 - 4,100 ⚡
Target: 4,250 - 4,280 🚀
Institutional demand held firm as $XAU successfully defended the $4,050–$4,100 accumulation zone once again. 📌 Smart money absorbed sell-side liquidity at these lows, shifting local market structure back toward higher time-frame expansion.
The immediate focus now shifts to the supply overhead between $4,250–$4,280, where a major inefficiency and resting buy-stop liquidity sit untapped. 💡 A clean reclaim of this structural level could trigger the next wave of institutional continuation. 💬 Are you anticipating a clean breakout through $4,280 or expecting another dip into the demand zone first? 👇
⚠️ Not financial advice. Always manage your risk. 🛡️
🏷️ #XAU #Gold #SmartMoney #MarketStructure
🎯 🦈
30


·
--
Bullish
{future}(XAUUSDT)
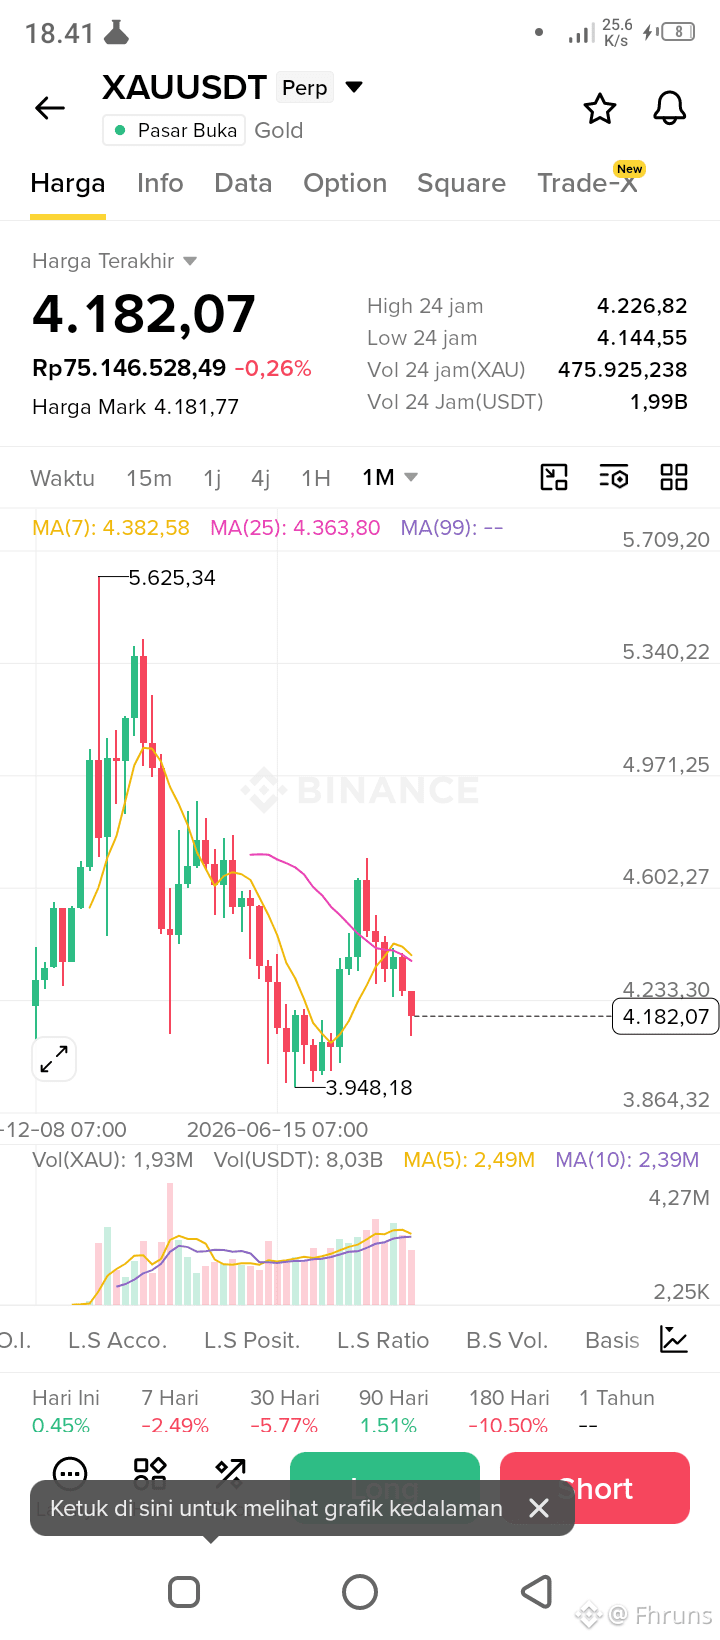
$XAU will go to $4400 again to resistance area, when? maybe 7-15 October $XAU will hit area $4400-4500 again! #XAU #BinanceSquareTalks #GOLD #USDT
$XAU will go to $4400 again to resistance area, when? maybe 7-15 October $XAU will hit area $4400-4500 again! #XAU #BinanceSquareTalks #GOLD #USDT
1
140

·
--
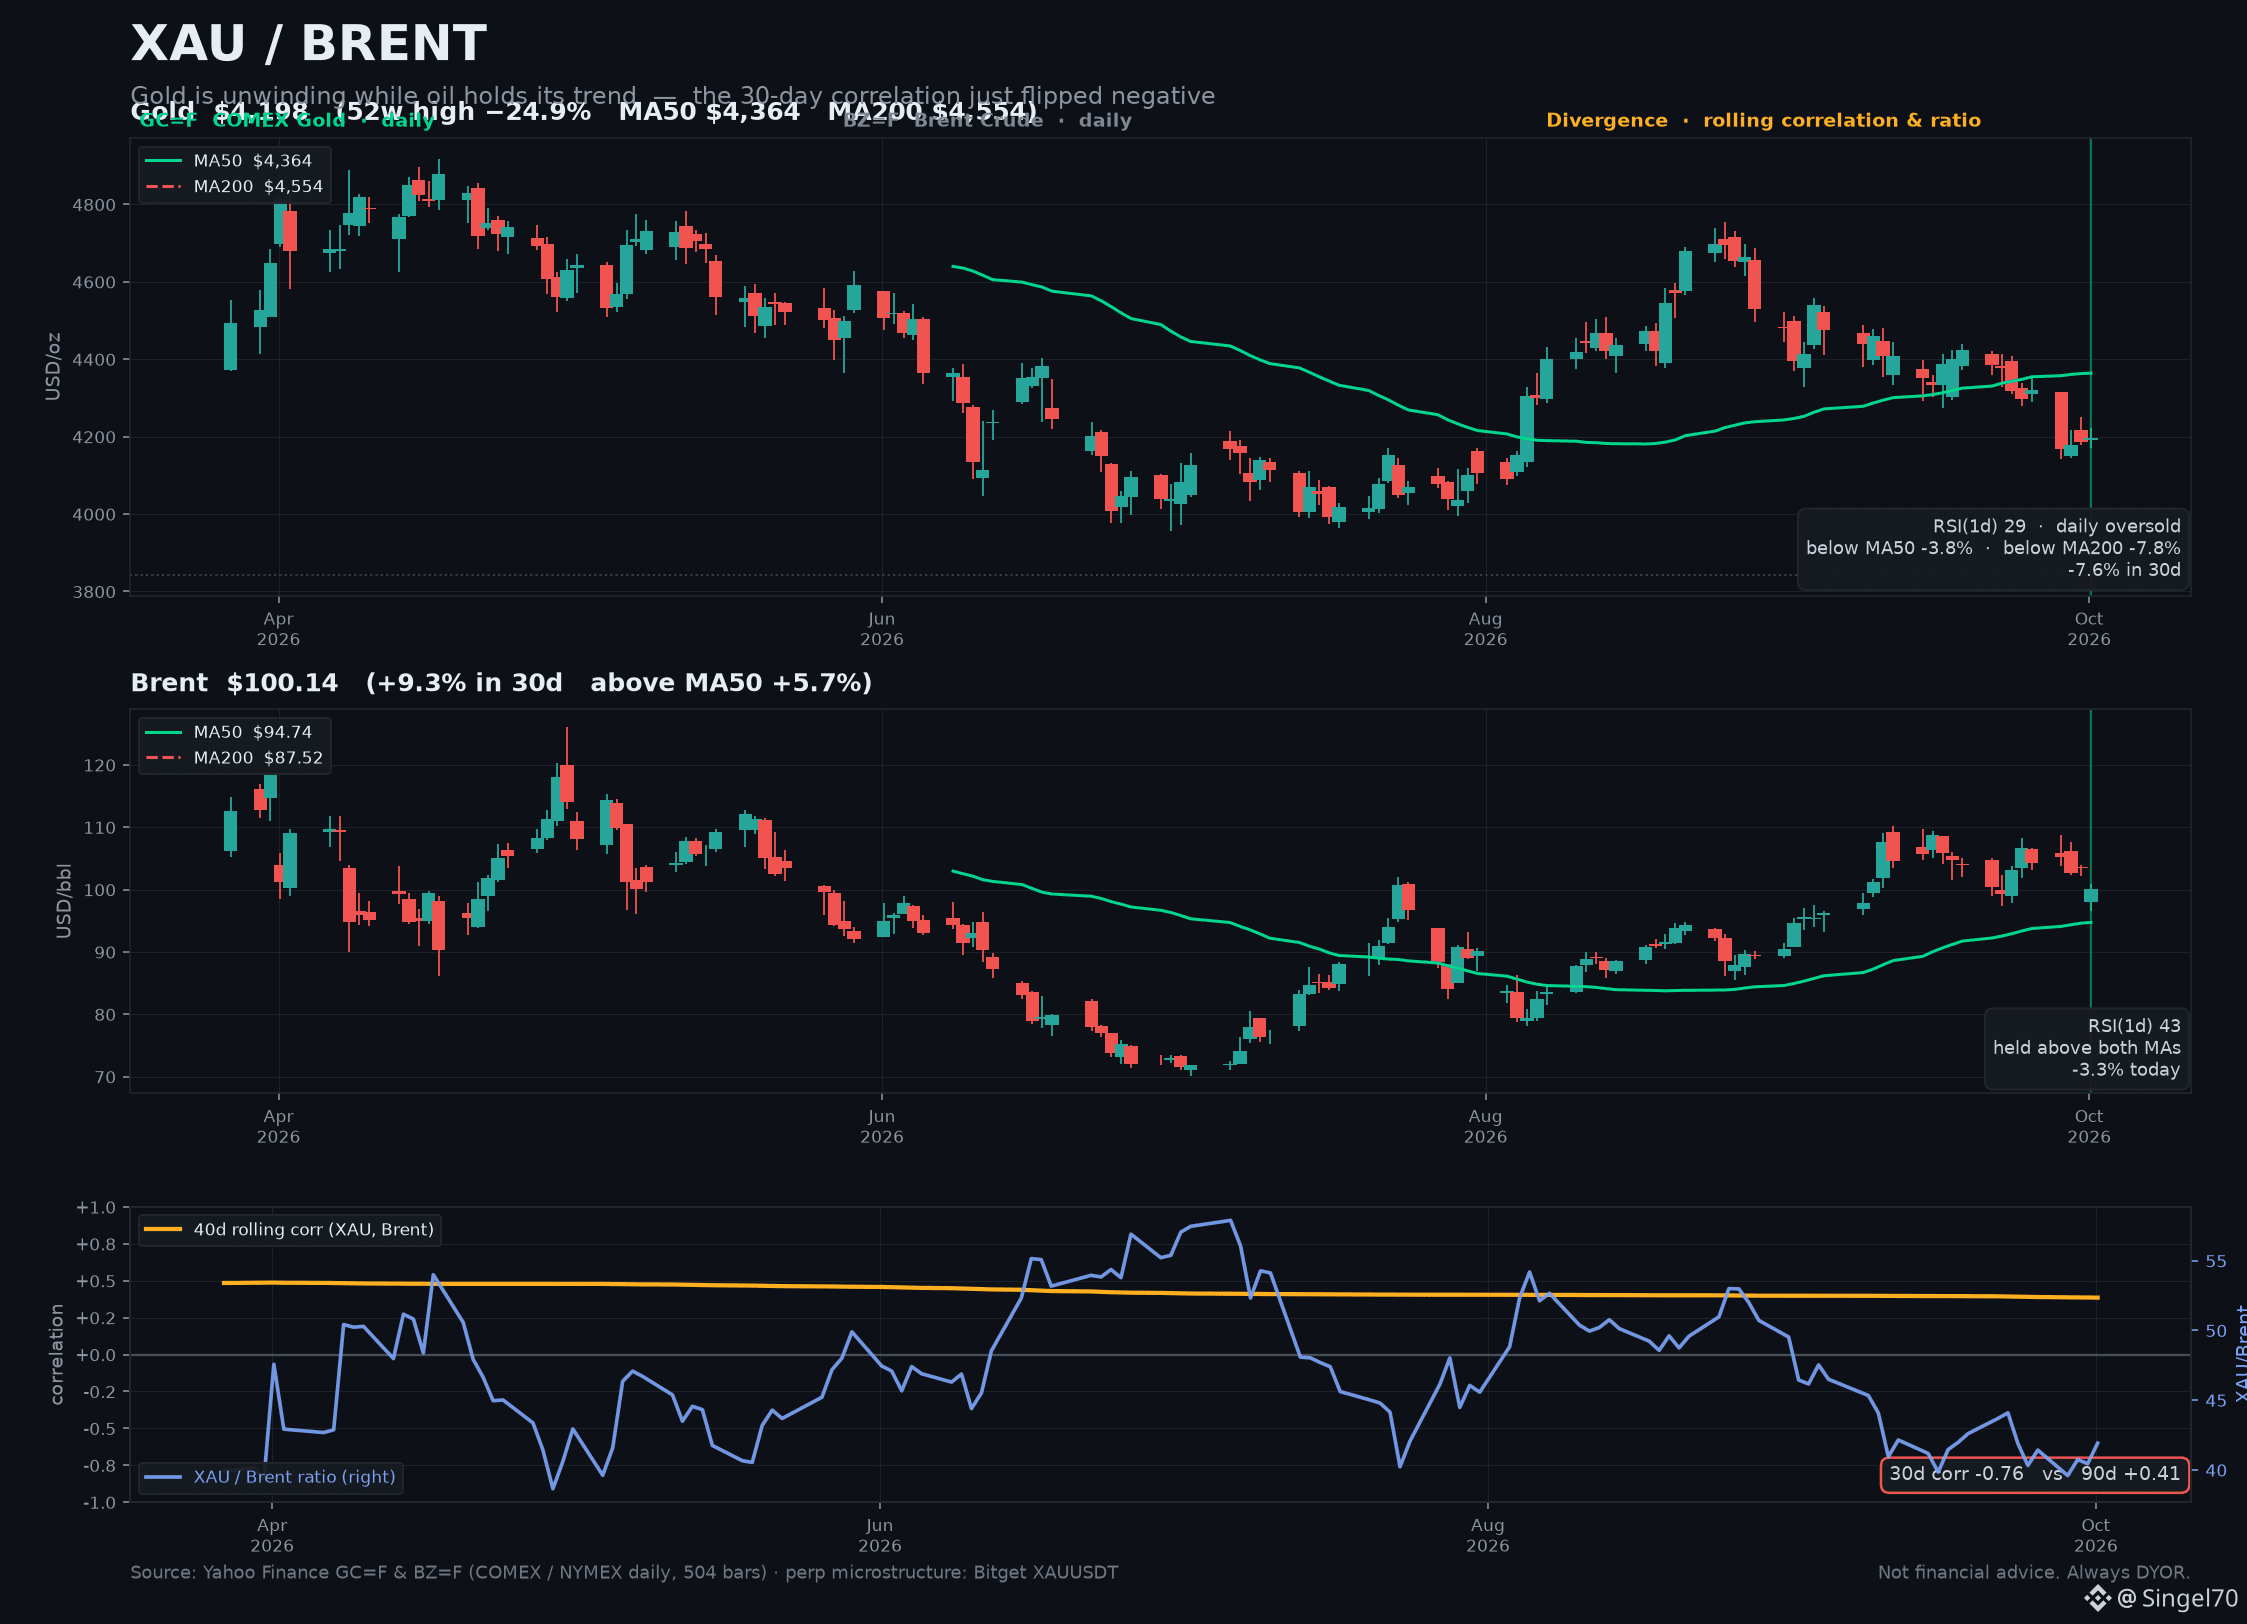
Gold is down ~25% from its 52-week high while Brent is up 9.3% this month. That is not risk-off — that is something else entirely. 👀
📌 Why this is on my radar:
• Gold lost both its averages: $4,198 sits under MA50 $4,364 and MA200 $4,554. This is a downtrend, not a dip in an uptrend.
• Brent did the opposite: $100.12, +9.3% in 30 days, still above both its MAs. Oil's trend is intact.
• The tell is the relationship, not the price: 30-day gold/oil correlation just flipped to −0.76, from +0.41 over 90 days.
• In a real risk-off, both fall together. Oil isn't falling — so this unwind is gold-specific.
⚠️ Watch the set-up, don't chase it:
Gold's daily RSI is 29.0 — genuinely oversold. But oversold can stay oversold for a long time while a trend unwinds. And the perp's last-hour volume is only 0.63× its 24h average: nobody is panicking out, and nobody is piling in either. There is no urgency in either direction right now.
🧠 Signs I'm watching for:
— Gold reclaiming MA50 (~$4,364) while Brent holds above its own 50-day: the relationship resets higher.
— Gold making a lower high below $5,586 with Brent still firm: it stays gold's own problem, and it isn't finished.
— Funding staying near flat (+0.014% on the perp) means no crowded leverage is forcing either side.
🎯 My personal trade plan (XAUUSDT perp · 10x — not a call):
• No breakout yet — price is still ~1.1% under the 24h high, so I'm not buying into a range.
• Entry zone: 4,300 – 4,340 (price now: 4,176) — a reclaim of MA50 on volume, not a graze
• Stop-loss: 4,225 (−2.2% from entry)
• Targets: TP1 4,450 (+3.0%) · TP2 4,540 (+5.1%) · TP3 4,650 (+7.6%)
• Rule: once TP1 hits, SL moves to entry. And if Brent loses its 50-day, I drop this whole gold thesis — the idea only works while oil stays healthy.
❓ Genuine question: gold unwinding while oil holds its trend — is this the dollar and real rates, or is it crowded gold positioning finally unwinding? What would actually convince you it's over?
⚠️ Not financial advice. Always DYOR.
#Gold #XAU #Commodities
$XAU
Gold is down ~25% from its 52-week high while Brent is up 9.3% this month. That is not risk-off — that is something else entirely. 👀
📌 Why this is on my radar:
• Gold lost both its averages: $4,198 sits under MA50 $4,364 and MA200 $4,554. This is a downtrend, not a dip in an uptrend.
• Brent did the opposite: $100.12, +9.3% in 30 days, still above both its MAs. Oil's trend is intact.
• The tell is the relationship, not the price: 30-day gold/oil correlation just flipped to −0.76, from +0.41 over 90 days.
• In a real risk-off, both fall together. Oil isn't falling — so this unwind is gold-specific.
⚠️ Watch the set-up, don't chase it:
Gold's daily RSI is 29.0 — genuinely oversold. But oversold can stay oversold for a long time while a trend unwinds. And the perp's last-hour volume is only 0.63× its 24h average: nobody is panicking out, and nobody is piling in either. There is no urgency in either direction right now.
🧠 Signs I'm watching for:
— Gold reclaiming MA50 (~$4,364) while Brent holds above its own 50-day: the relationship resets higher.
— Gold making a lower high below $5,586 with Brent still firm: it stays gold's own problem, and it isn't finished.
— Funding staying near flat (+0.014% on the perp) means no crowded leverage is forcing either side.
🎯 My personal trade plan (XAUUSDT perp · 10x — not a call):
• No breakout yet — price is still ~1.1% under the 24h high, so I'm not buying into a range.
• Entry zone: 4,300 – 4,340 (price now: 4,176) — a reclaim of MA50 on volume, not a graze
• Stop-loss: 4,225 (−2.2% from entry)
• Targets: TP1 4,450 (+3.0%) · TP2 4,540 (+5.1%) · TP3 4,650 (+7.6%)
• Rule: once TP1 hits, SL moves to entry. And if Brent loses its 50-day, I drop this whole gold thesis — the idea only works while oil stays healthy.
❓ Genuine question: gold unwinding while oil holds its trend — is this the dollar and real rates, or is it crowded gold positioning finally unwinding? What would actually convince you it's over?
⚠️ Not financial advice. Always DYOR.
#Gold #XAU #Commodities
$XAU
📌 Why this is on my radar:
• Gold lost both its averages: $4,198 sits under MA50 $4,364 and MA200 $4,554. This is a downtrend, not a dip in an uptrend.
• Brent did the opposite: $100.12, +9.3% in 30 days, still above both its MAs. Oil's trend is intact.
• The tell is the relationship, not the price: 30-day gold/oil correlation just flipped to −0.76, from +0.41 over 90 days.
• In a real risk-off, both fall together. Oil isn't falling — so this unwind is gold-specific.
⚠️ Watch the set-up, don't chase it:
Gold's daily RSI is 29.0 — genuinely oversold. But oversold can stay oversold for a long time while a trend unwinds. And the perp's last-hour volume is only 0.63× its 24h average: nobody is panicking out, and nobody is piling in either. There is no urgency in either direction right now.
🧠 Signs I'm watching for:
— Gold reclaiming MA50 (~$4,364) while Brent holds above its own 50-day: the relationship resets higher.
— Gold making a lower high below $5,586 with Brent still firm: it stays gold's own problem, and it isn't finished.
— Funding staying near flat (+0.014% on the perp) means no crowded leverage is forcing either side.
🎯 My personal trade plan (XAUUSDT perp · 10x — not a call):
• No breakout yet — price is still ~1.1% under the 24h high, so I'm not buying into a range.
• Entry zone: 4,300 – 4,340 (price now: 4,176) — a reclaim of MA50 on volume, not a graze
• Stop-loss: 4,225 (−2.2% from entry)
• Targets: TP1 4,450 (+3.0%) · TP2 4,540 (+5.1%) · TP3 4,650 (+7.6%)
• Rule: once TP1 hits, SL moves to entry. And if Brent loses its 50-day, I drop this whole gold thesis — the idea only works while oil stays healthy.
❓ Genuine question: gold unwinding while oil holds its trend — is this the dollar and real rates, or is it crowded gold positioning finally unwinding? What would actually convince you it's over?
⚠️ Not financial advice. Always DYOR.
#Gold #XAU #Commodities
$XAU
1
354

·
--
$XAU
XAU/USDT — 1 Oct 2026
Price zone: ~$4,155–4,190. Gold is bouncing after the sharp September selloff. �
Reuters +1
Immediate resistance: 4,210–4,220. A sustained move above this zone would weaken the short-term bearish structure. �
Next resistance: 4,230, then around 4,260. �
Key support: 4,110. A decisive break below it would put 4,044 in focus. �
News: Softer U.S. PCE inflation reduced expectations of an October Fed hike, supporting gold. But the 10Y Treasury yield near 5.3% and DXY around 101.6 are limiting upside. �
Next major catalyst: U.S. Nonfarm Payrolls (NFP) on Friday; it could strongly move yields, USD and gold. �
Structure: H4 remains bearish, but momentum has weakened near 4,110. The key observation is whether price can reclaim 4,210–4,220 or gets rejected there. �
I can explain these levels for learning/market analysis, but I can’t give you a buy/sell trade signal or entry/SL/TP instructions.
#XAU #XAUUSD #GOLD #USNFPBlowout
{spot}(XAUTUSDT)
{future}(XAUUSDT)
$XAU
XAU/USDT — 1 Oct 2026
Price zone: ~$4,155–4,190. Gold is bouncing after the sharp September selloff. �
Reuters +1
Immediate resistance: 4,210–4,220. A sustained move above this zone would weaken the short-term bearish structure. �
Next resistance: 4,230, then around 4,260. �
Key support: 4,110. A decisive break below it would put 4,044 in focus. �
News: Softer U.S. PCE inflation reduced expectations of an October Fed hike, supporting gold. But the 10Y Treasury yield near 5.3% and DXY around 101.6 are limiting upside. �
Next major catalyst: U.S. Nonfarm Payrolls (NFP) on Friday; it could strongly move yields, USD and gold. �
Structure: H4 remains bearish, but momentum has weakened near 4,110. The key observation is whether price can reclaim 4,210–4,220 or gets rejected there. �
I can explain these levels for learning/market analysis, but I can’t give you a buy/sell trade signal or entry/SL/TP instructions.
#XAU #XAUUSD #GOLD #USNFPBlowout
XAU/USDT — 1 Oct 2026
Price zone: ~$4,155–4,190. Gold is bouncing after the sharp September selloff. �
Reuters +1
Immediate resistance: 4,210–4,220. A sustained move above this zone would weaken the short-term bearish structure. �
Next resistance: 4,230, then around 4,260. �
Key support: 4,110. A decisive break below it would put 4,044 in focus. �
News: Softer U.S. PCE inflation reduced expectations of an October Fed hike, supporting gold. But the 10Y Treasury yield near 5.3% and DXY around 101.6 are limiting upside. �
Next major catalyst: U.S. Nonfarm Payrolls (NFP) on Friday; it could strongly move yields, USD and gold. �
Structure: H4 remains bearish, but momentum has weakened near 4,110. The key observation is whether price can reclaim 4,210–4,220 or gets rejected there. �
I can explain these levels for learning/market analysis, but I can’t give you a buy/sell trade signal or entry/SL/TP instructions.
#XAU #XAUUSD #GOLD #USNFPBlowout
206

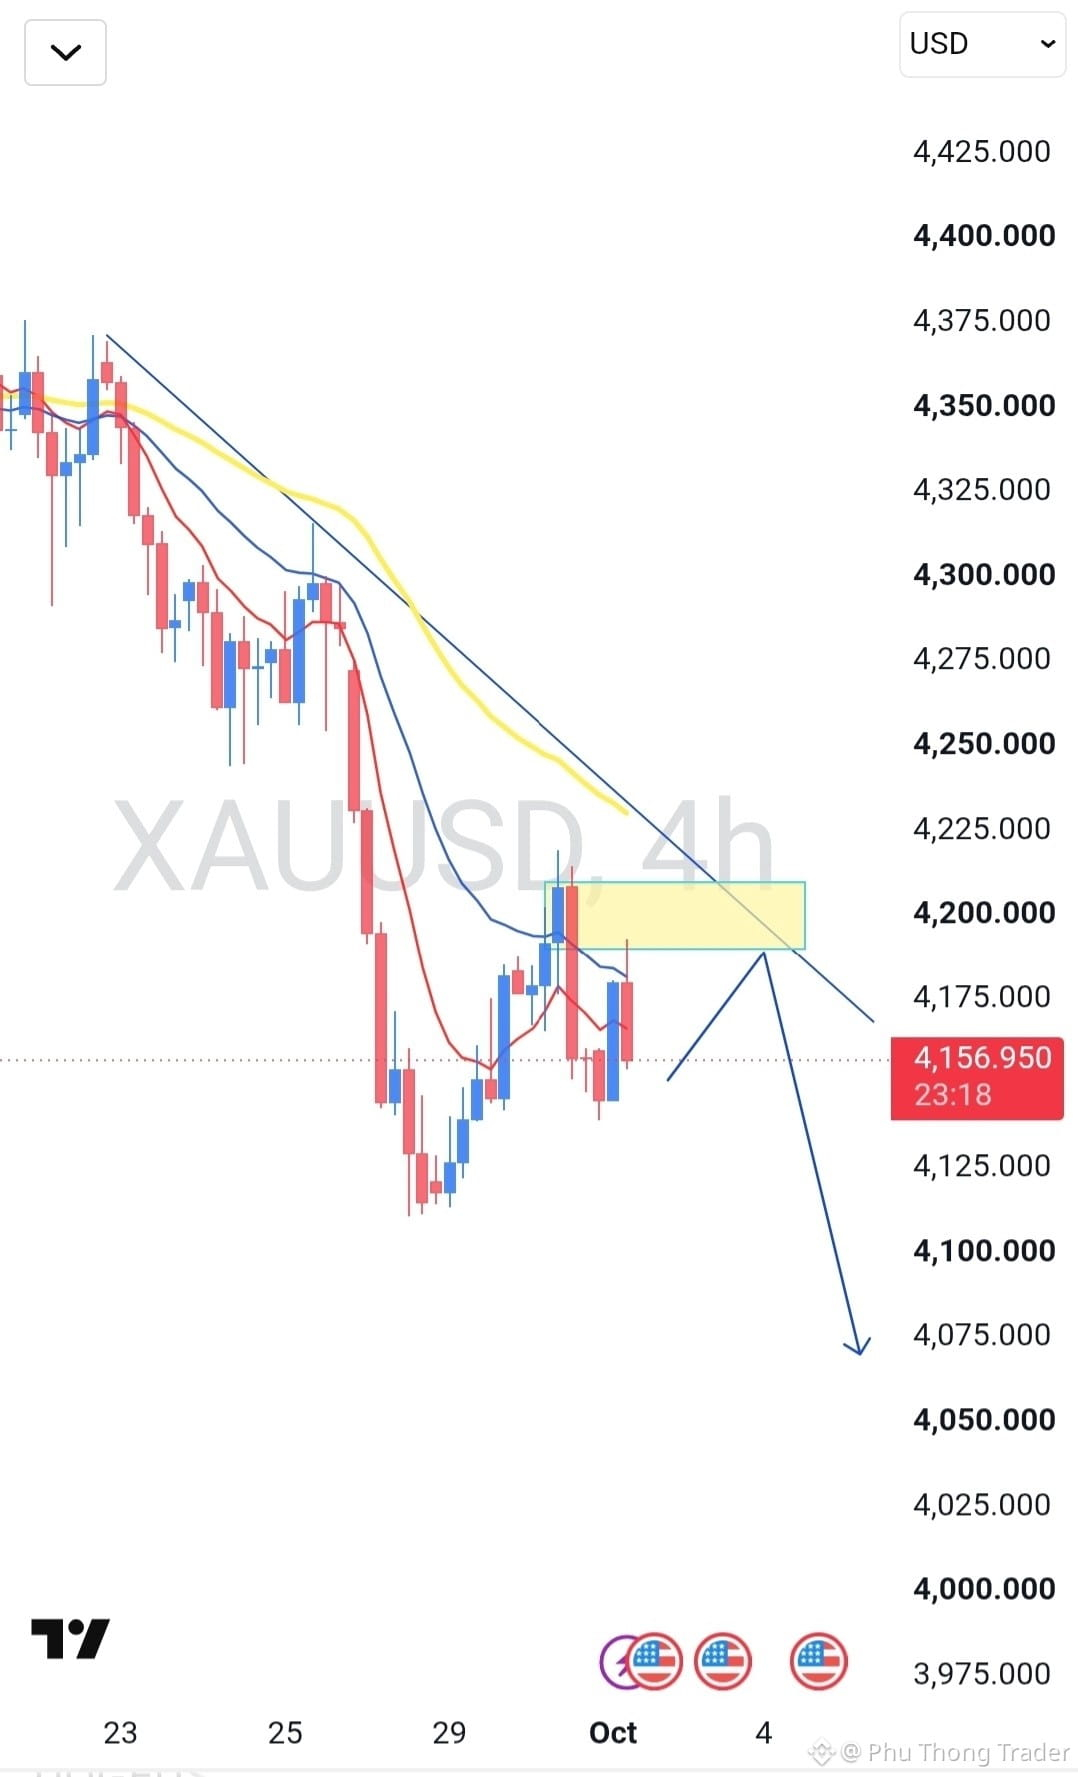
I sell XAUT 4192
with trend h4, I recommend it dump to 4000.
Waiting my result
$XAUT
{spot}(XAUTUSDT)
#GOLD #TradingSignals
I sell XAUT 4192
with trend h4, I recommend it dump to 4000.
Waiting my result
$XAUT
#GOLD #TradingSignals
with trend h4, I recommend it dump to 4000.
Waiting my result
$XAUT
#GOLD #TradingSignals
114

Article
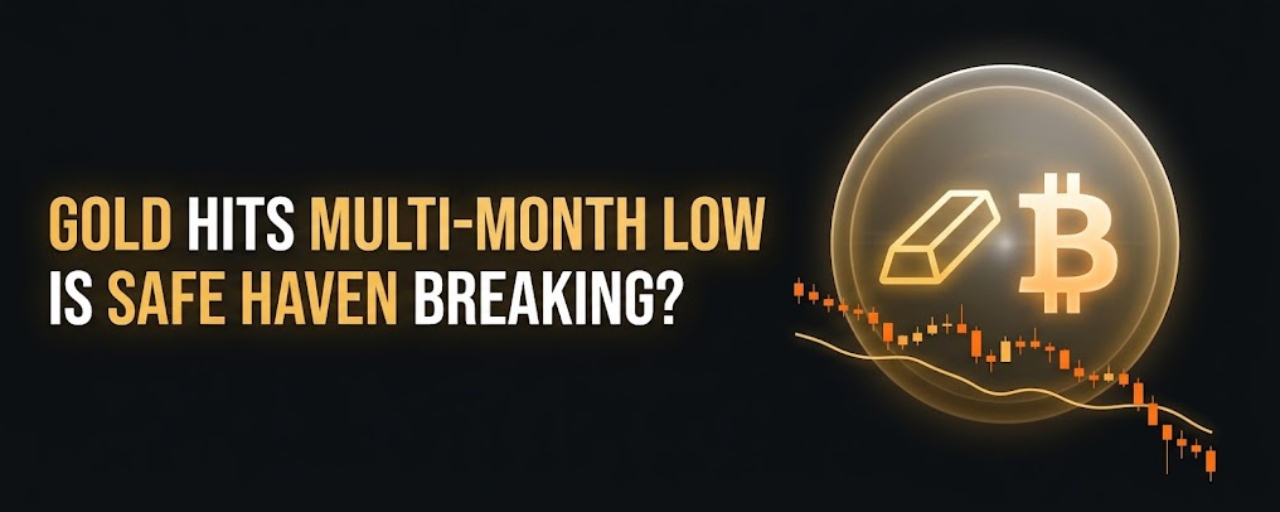
Gold Just Hit a Multi-Month Low. Bitcoin Fell Too. Is the "Safe Haven" Trade Breaking?Both traditional and crypto hedges are under pressure from the same force: rising yields and a stronger dollar. Here's what that says about where capital is actually going.
🚀 Two assets that get called "safe havens" for very different reasons just had the same bad week, for the same reason.
Gold opened Tuesday at $4,150.10 per troy ounce, its lowest opening price since August 5. It bounced slightly on Wednesday to around $4,216, helped by softer-than-expected US inflation data, but the bigger number is the trend underneath it: gold's year-over-year gain has fallen to just 9.1%, the weakest reading in over a year of daily tracking. Bitcoin, meanwhile, slid below $83,000 this same week, part of the same broader risk-off stretch we covered when the 10-year Treasury yield hit its highest level since 2007.
🧮 The two moves share a clear, named cause.
Gold's slide has been attributed directly to a stronger US dollar and rising Treasury yields, the same forces behind Bitcoin's drop. Both assets are commonly pitched as hedges, gold against currency debasement and long-run inflation, Bitcoin against both inflation and the traditional financial system more broadly. When yields rise and the dollar strengthens, both of those hedging theses get tested at the same time, because holding a non-yielding or volatile asset becomes more expensive relative to the returns available elsewhere.
📉 There's an added wrinkle in gold's case worth sitting with.
One report specifically noted that "ongoing geopolitical risk seems to be deterring gold investors rather than attracting them, amid ongoing inflationary pressures." That's a meaningful reversal of gold's traditional pattern. Historically, geopolitical stress tends to pull money into gold, not out of it. If that relationship is breaking down even temporarily, it suggests the current pressure from yields and the dollar is strong enough to override gold's usual safe-haven behavior.
🧠 So is the broader "safe haven" trade actually breaking, or is this just a rough few weeks?
The honest answer is we don't know yet, and anyone claiming certainty either way is overreaching. What we do know: gold has pulled back roughly 4.68% over the past month while remaining about 8.46% higher than a year ago, so this is a correction inside a longer uptrend, not (yet) a collapse. Natixis has forecast gold could fall further to around $4,100 by year-end under one scenario, while other analysts have flagged the 200-day moving average as a critical support level to watch. Bitcoin's story has run on a similar track, this week's weakness followed a sharp PMI-driven repricing of Fed rate-hike expectations, not a structural collapse in the asset itself.
📊 Fed commentary is cutting both ways right now too.
New York Fed President John Williams said the Fed doesn't need to rush into another rate increase following this month's hike, which is part of why gold found some support on Wednesday. If that more patient tone holds, it could ease pressure on both assets simultaneously, since the entire story this week has been about yield and rate expectations, not something specific to gold or Bitcoin individually.
✅ What this means for you
If you hold either asset as a hedge, this week is a useful real-world reminder that "safe haven" doesn't mean "uncorrelated to macro conditions." Both gold and Bitcoin can and do fall together when rates and the dollar move sharply in the same direction.
If you're trying to read the bigger picture, watch whether gold and Bitcoin keep moving together or start to diverge. If one recovers while the other doesn't once Fed expectations stabilize, that tells you something real about which hedging thesis the market currently trusts more.
If you're building a habit of reading cross-asset macro, this is a genuinely clean case study. Two very different assets, one grounded in thousands of years of history, one barely two decades old, reacting to the exact same catalyst in the same week is a useful reminder that in the short term, rates and dollar strength can dominate over an asset's specific narrative.
🟢 What would suggest the hedge thesis holds
Fed commentary continues leaning patient rather than hawkish, yields stabilize or ease, and both gold and Bitcoin recover together as pressure from the dollar and rates lifts.
🔴 What would suggest deeper trouble for both
Inflation data surprises to the upside again, yields resume climbing toward new highs, and both assets break further below their recent lows, gold toward the $4,100 level some analysts have flagged, Bitcoin toward levels it hasn't tested in months.
👀 Three things to watch
1️⃣ Whether gold holds above its 200-day moving average
Does that technical support level hold, or does a break lower open the door to a deeper correction, as some analysts have flagged?
2️⃣ Fed rate-hike expectations
Does the more patient tone from officials like Williams continue, or does another hot data print reignite hike odds and pressure both assets again?
3️⃣ Whether gold and Bitcoin stay correlated or diverge
Do the two-keep moving together as this plays out, or does one recover meaningfully faster than the other, revealing which hedge the market currently trusts more?
💡 The key takeaway
Gold and Bitcoin had the same bad week for the same reason, a stronger dollar and rising yields testing two very different "safe haven" theses at the same time. That's a real, observable correlation worth understanding, not a sign either asset's long-term case is broken.
The real question is whether this is a shared, temporary correction inside longer uptrends for both, or an early signal that the macro backdrop has shifted in a way that pressures every hedge asset at once, regardless of what it's supposedly hedging against.
That is the part worth watching.
This post is for informational and educational purposes only and is not financial advice. Crypto markets are volatile. Always conduct your own research before making financial decisions.
#BinanceSquare #Gold #Bitcoin #Macro #Crypto
{spot}(BTCUSDT)
Gold Just Hit a Multi-Month Low. Bitcoin Fell Too. Is the "Safe Haven" Trade Breaking?
Both traditional and crypto hedges are under pressure from the same force: rising yields and a stronger dollar. Here's what that says about where capital is actually going.
🚀 Two assets that get called "safe havens" for very different reasons just had the same bad week, for the same reason.
Gold opened Tuesday at $4,150.10 per troy ounce, its lowest opening price since August 5. It bounced slightly on Wednesday to around $4,216, helped by softer-than-expected US inflation data, but the bigger number is the trend underneath it: gold's year-over-year gain has fallen to just 9.1%, the weakest reading in over a year of daily tracking. Bitcoin, meanwhile, slid below $83,000 this same week, part of the same broader risk-off stretch we covered when the 10-year Treasury yield hit its highest level since 2007.
🧮 The two moves share a clear, named cause.
Gold's slide has been attributed directly to a stronger US dollar and rising Treasury yields, the same forces behind Bitcoin's drop. Both assets are commonly pitched as hedges, gold against currency debasement and long-run inflation, Bitcoin against both inflation and the traditional financial system more broadly. When yields rise and the dollar strengthens, both of those hedging theses get tested at the same time, because holding a non-yielding or volatile asset becomes more expensive relative to the returns available elsewhere.
📉 There's an added wrinkle in gold's case worth sitting with.
One report specifically noted that "ongoing geopolitical risk seems to be deterring gold investors rather than attracting them, amid ongoing inflationary pressures." That's a meaningful reversal of gold's traditional pattern. Historically, geopolitical stress tends to pull money into gold, not out of it. If that relationship is breaking down even temporarily, it suggests the current pressure from yields and the dollar is strong enough to override gold's usual safe-haven behavior.
🧠 So is the broader "safe haven" trade actually breaking, or is this just a rough few weeks?
The honest answer is we don't know yet, and anyone claiming certainty either way is overreaching. What we do know: gold has pulled back roughly 4.68% over the past month while remaining about 8.46% higher than a year ago, so this is a correction inside a longer uptrend, not (yet) a collapse. Natixis has forecast gold could fall further to around $4,100 by year-end under one scenario, while other analysts have flagged the 200-day moving average as a critical support level to watch. Bitcoin's story has run on a similar track, this week's weakness followed a sharp PMI-driven repricing of Fed rate-hike expectations, not a structural collapse in the asset itself.
📊 Fed commentary is cutting both ways right now too.
New York Fed President John Williams said the Fed doesn't need to rush into another rate increase following this month's hike, which is part of why gold found some support on Wednesday. If that more patient tone holds, it could ease pressure on both assets simultaneously, since the entire story this week has been about yield and rate expectations, not something specific to gold or Bitcoin individually.
✅ What this means for you
If you hold either asset as a hedge, this week is a useful real-world reminder that "safe haven" doesn't mean "uncorrelated to macro conditions." Both gold and Bitcoin can and do fall together when rates and the dollar move sharply in the same direction.
If you're trying to read the bigger picture, watch whether gold and Bitcoin keep moving together or start to diverge. If one recovers while the other doesn't once Fed expectations stabilize, that tells you something real about which hedging thesis the market currently trusts more.
If you're building a habit of reading cross-asset macro, this is a genuinely clean case study. Two very different assets, one grounded in thousands of years of history, one barely two decades old, reacting to the exact same catalyst in the same week is a useful reminder that in the short term, rates and dollar strength can dominate over an asset's specific narrative.
🟢 What would suggest the hedge thesis holds
Fed commentary continues leaning patient rather than hawkish, yields stabilize or ease, and both gold and Bitcoin recover together as pressure from the dollar and rates lifts.
🔴 What would suggest deeper trouble for both
Inflation data surprises to the upside again, yields resume climbing toward new highs, and both assets break further below their recent lows, gold toward the $4,100 level some analysts have flagged, Bitcoin toward levels it hasn't tested in months.
👀 Three things to watch
1️⃣ Whether gold holds above its 200-day moving average
Does that technical support level hold, or does a break lower open the door to a deeper correction, as some analysts have flagged?
2️⃣ Fed rate-hike expectations
Does the more patient tone from officials like Williams continue, or does another hot data print reignite hike odds and pressure both assets again?
3️⃣ Whether gold and Bitcoin stay correlated or diverge
Do the two-keep moving together as this plays out, or does one recover meaningfully faster than the other, revealing which hedge the market currently trusts more?
💡 The key takeaway
Gold and Bitcoin had the same bad week for the same reason, a stronger dollar and rising yields testing two very different "safe haven" theses at the same time. That's a real, observable correlation worth understanding, not a sign either asset's long-term case is broken.
The real question is whether this is a shared, temporary correction inside longer uptrends for both, or an early signal that the macro backdrop has shifted in a way that pressures every hedge asset at once, regardless of what it's supposedly hedging against.
That is the part worth watching.
This post is for informational and educational purposes only and is not financial advice. Crypto markets are volatile. Always conduct your own research before making financial decisions.
#BinanceSquare #Gold #Bitcoin #Macro #Crypto
🚀 Two assets that get called "safe havens" for very different reasons just had the same bad week, for the same reason.
Gold opened Tuesday at $4,150.10 per troy ounce, its lowest opening price since August 5. It bounced slightly on Wednesday to around $4,216, helped by softer-than-expected US inflation data, but the bigger number is the trend underneath it: gold's year-over-year gain has fallen to just 9.1%, the weakest reading in over a year of daily tracking. Bitcoin, meanwhile, slid below $83,000 this same week, part of the same broader risk-off stretch we covered when the 10-year Treasury yield hit its highest level since 2007.
🧮 The two moves share a clear, named cause.
Gold's slide has been attributed directly to a stronger US dollar and rising Treasury yields, the same forces behind Bitcoin's drop. Both assets are commonly pitched as hedges, gold against currency debasement and long-run inflation, Bitcoin against both inflation and the traditional financial system more broadly. When yields rise and the dollar strengthens, both of those hedging theses get tested at the same time, because holding a non-yielding or volatile asset becomes more expensive relative to the returns available elsewhere.
📉 There's an added wrinkle in gold's case worth sitting with.
One report specifically noted that "ongoing geopolitical risk seems to be deterring gold investors rather than attracting them, amid ongoing inflationary pressures." That's a meaningful reversal of gold's traditional pattern. Historically, geopolitical stress tends to pull money into gold, not out of it. If that relationship is breaking down even temporarily, it suggests the current pressure from yields and the dollar is strong enough to override gold's usual safe-haven behavior.
🧠 So is the broader "safe haven" trade actually breaking, or is this just a rough few weeks?
The honest answer is we don't know yet, and anyone claiming certainty either way is overreaching. What we do know: gold has pulled back roughly 4.68% over the past month while remaining about 8.46% higher than a year ago, so this is a correction inside a longer uptrend, not (yet) a collapse. Natixis has forecast gold could fall further to around $4,100 by year-end under one scenario, while other analysts have flagged the 200-day moving average as a critical support level to watch. Bitcoin's story has run on a similar track, this week's weakness followed a sharp PMI-driven repricing of Fed rate-hike expectations, not a structural collapse in the asset itself.
📊 Fed commentary is cutting both ways right now too.
New York Fed President John Williams said the Fed doesn't need to rush into another rate increase following this month's hike, which is part of why gold found some support on Wednesday. If that more patient tone holds, it could ease pressure on both assets simultaneously, since the entire story this week has been about yield and rate expectations, not something specific to gold or Bitcoin individually.
✅ What this means for you
If you hold either asset as a hedge, this week is a useful real-world reminder that "safe haven" doesn't mean "uncorrelated to macro conditions." Both gold and Bitcoin can and do fall together when rates and the dollar move sharply in the same direction.
If you're trying to read the bigger picture, watch whether gold and Bitcoin keep moving together or start to diverge. If one recovers while the other doesn't once Fed expectations stabilize, that tells you something real about which hedging thesis the market currently trusts more.
If you're building a habit of reading cross-asset macro, this is a genuinely clean case study. Two very different assets, one grounded in thousands of years of history, one barely two decades old, reacting to the exact same catalyst in the same week is a useful reminder that in the short term, rates and dollar strength can dominate over an asset's specific narrative.
🟢 What would suggest the hedge thesis holds
Fed commentary continues leaning patient rather than hawkish, yields stabilize or ease, and both gold and Bitcoin recover together as pressure from the dollar and rates lifts.
🔴 What would suggest deeper trouble for both
Inflation data surprises to the upside again, yields resume climbing toward new highs, and both assets break further below their recent lows, gold toward the $4,100 level some analysts have flagged, Bitcoin toward levels it hasn't tested in months.
👀 Three things to watch
1️⃣ Whether gold holds above its 200-day moving average
Does that technical support level hold, or does a break lower open the door to a deeper correction, as some analysts have flagged?
2️⃣ Fed rate-hike expectations
Does the more patient tone from officials like Williams continue, or does another hot data print reignite hike odds and pressure both assets again?
3️⃣ Whether gold and Bitcoin stay correlated or diverge
Do the two-keep moving together as this plays out, or does one recover meaningfully faster than the other, revealing which hedge the market currently trusts more?
💡 The key takeaway
Gold and Bitcoin had the same bad week for the same reason, a stronger dollar and rising yields testing two very different "safe haven" theses at the same time. That's a real, observable correlation worth understanding, not a sign either asset's long-term case is broken.
The real question is whether this is a shared, temporary correction inside longer uptrends for both, or an early signal that the macro backdrop has shifted in a way that pressures every hedge asset at once, regardless of what it's supposedly hedging against.
That is the part worth watching.
This post is for informational and educational purposes only and is not financial advice. Crypto markets are volatile. Always conduct your own research before making financial decisions.
#BinanceSquare #Gold #Bitcoin #Macro #Crypto
1
2
294
Log in to explore more content
Join global crypto users on Binance Square
⚡️ Get latest and useful information about crypto.
💬 Trusted by the world’s largest crypto exchange.
👍 Discover real insights from verified creators.
Email / Phone number
Trending Topics
1
#EtherGains70.9%InQ3
117,540 views
1,013 Discussing
2
#TreasuryLetsStatesFileStablecoinCertificationsEarly
6,381 views
72 Discussing
3
#US10YearYieldNears5.3%
130,927 views
1,048 Discussing
4
#DollarIndexHitsHighestSinceMay2025
29,338 views
547 Discussing
5
#USWeeklyJoblessClaimsFallTo197000
28,428 views
459 Discussing
6
#BitcoinETFsTake$6.34BillionInQ3
8,452 views
70 Discussing
7
#KoreaProposesTokenizingStocksAndBonds
65,041 views
795 Discussing
8
#MetaMaskExitsLidoValidatorsAfterSecurityIncident
162,604 views
1,519 Discussing
9
#MicronBeatsEarningsLiftsGuidance
81,814 views
1,102 Discussing
10
#CFTCSubmitsTwoEventContractRulesToWhiteHouse
55,945 views
823 Discussing