
#cryptotechnicalanalysis
cryptotechnicalanalysis
211,167 views
1,378 Discussing
Hot
Latest


·
--
📉 CRYPTOCOIN OF THE DAY: SIGN Crypto Price Analysis – Bearish Momentum
💰 Market Overview
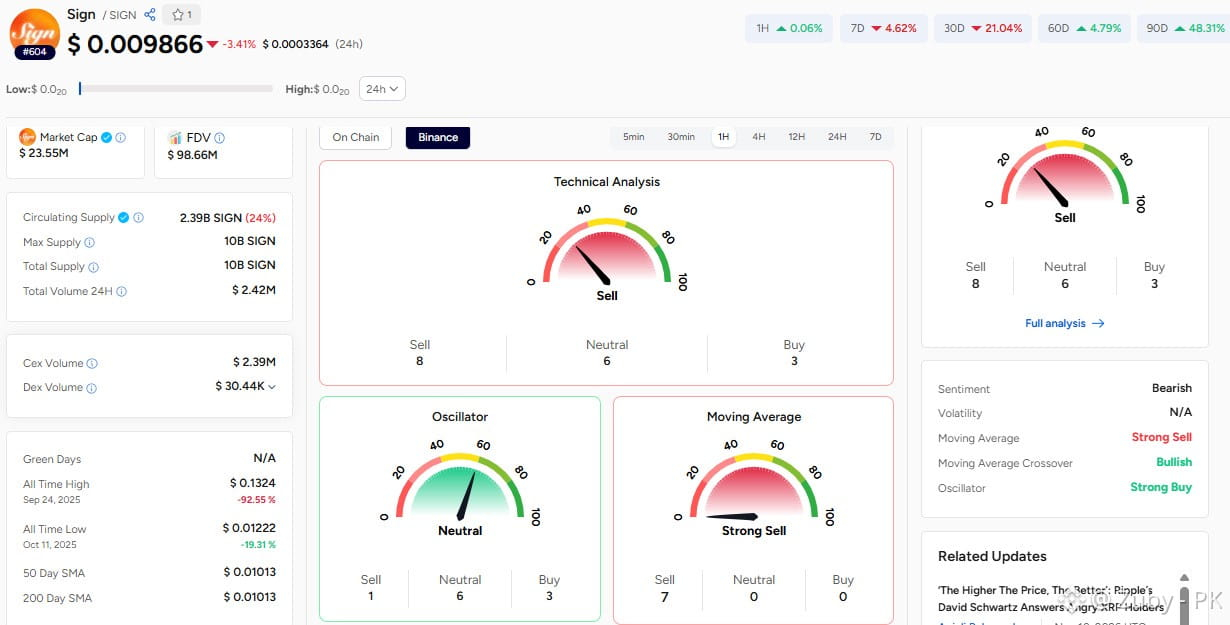
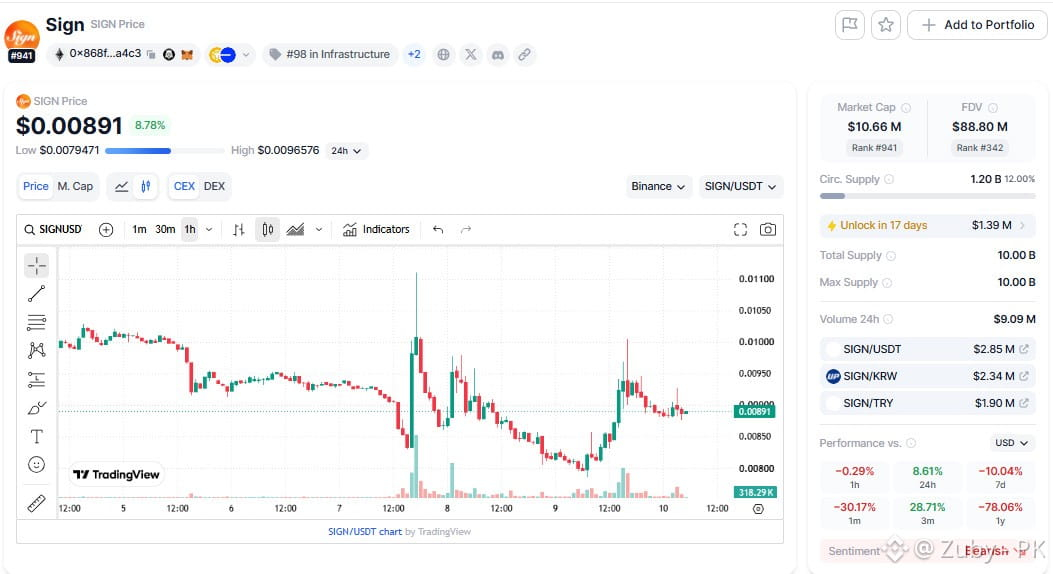
💵 Current Price: $0.009866📊 24H Volume: $2.42 Million📉 24H Change: -3.41%🪙 Circulating Supply: 2.38 Billion SIGN🔒 Maximum Supply: 10 Billion SIGN
📊 Technical Analysis
🔻 50-Day SMA: $0.01164🔻 200-Day SMA: $0.01119📉 RSI: 37.33, indicating weak momentum.🐻 MACD: -0.000529, showing bearish pressure.⚖️ Volatility: 2.62%, suggesting relatively stable movement.
🔮 Market Outlook
🐻 Bearish: Further selling could push prices lower.🐂 Bullish: A recovery above key moving averages could signal a trend reversal.👀 Trading Strategy: Watch volume and technical indicators before entering trades.
🎯 Final Verdict
SIGN remains under bearish pressure, trading below both major moving averages. Traders should remain cautious and wait for stronger recovery signals.
⚠️ Disclaimer: This content is for informational and educational purposes only, not financial advice. Cryptocurrency markets are highly volatile. Always do your own research (DYOR) before investing or trading.
🔥 #SIGNCrypto #SIGNTokenAnalysis #CryptoTechnicalAnalysis
$SIGN
{spot}(SIGNUSDT)
📉 CRYPTOCOIN OF THE DAY: SIGN Crypto Price Analysis – Bearish Momentum
💰 Market Overview
💵 Current Price: $0.009866📊 24H Volume: $2.42 Million📉 24H Change: -3.41%🪙 Circulating Supply: 2.38 Billion SIGN🔒 Maximum Supply: 10 Billion SIGN
📊 Technical Analysis
🔻 50-Day SMA: $0.01164🔻 200-Day SMA: $0.01119📉 RSI: 37.33, indicating weak momentum.🐻 MACD: -0.000529, showing bearish pressure.⚖️ Volatility: 2.62%, suggesting relatively stable movement.
🔮 Market Outlook
🐻 Bearish: Further selling could push prices lower.🐂 Bullish: A recovery above key moving averages could signal a trend reversal.👀 Trading Strategy: Watch volume and technical indicators before entering trades.
🎯 Final Verdict
SIGN remains under bearish pressure, trading below both major moving averages. Traders should remain cautious and wait for stronger recovery signals.
⚠️ Disclaimer: This content is for informational and educational purposes only, not financial advice. Cryptocurrency markets are highly volatile. Always do your own research (DYOR) before investing or trading.
🔥 #SIGNCrypto #SIGNTokenAnalysis #CryptoTechnicalAnalysis
$SIGN
💰 Market Overview
💵 Current Price: $0.009866📊 24H Volume: $2.42 Million📉 24H Change: -3.41%🪙 Circulating Supply: 2.38 Billion SIGN🔒 Maximum Supply: 10 Billion SIGN
📊 Technical Analysis
🔻 50-Day SMA: $0.01164🔻 200-Day SMA: $0.01119📉 RSI: 37.33, indicating weak momentum.🐻 MACD: -0.000529, showing bearish pressure.⚖️ Volatility: 2.62%, suggesting relatively stable movement.
🔮 Market Outlook
🐻 Bearish: Further selling could push prices lower.🐂 Bullish: A recovery above key moving averages could signal a trend reversal.👀 Trading Strategy: Watch volume and technical indicators before entering trades.
🎯 Final Verdict
SIGN remains under bearish pressure, trading below both major moving averages. Traders should remain cautious and wait for stronger recovery signals.
⚠️ Disclaimer: This content is for informational and educational purposes only, not financial advice. Cryptocurrency markets are highly volatile. Always do your own research (DYOR) before investing or trading.
🔥 #SIGNCrypto #SIGNTokenAnalysis #CryptoTechnicalAnalysis
$SIGN
3
244

Bitcoin is currently struggling to maintain momentum as it approaches the eighty five thousand dollar resistance level. Weakening ETF demand is creating a bearish undertone that could lead to further downside if the price fails to flip this key level into support. Traders should watch for volume confirmation before betting on a breakout because technical indicators suggest the bulls are losing steam.
#BitcoinPrice #CryptoTechnicalAnalysis ⠀
Bitcoin is currently struggling to maintain momentum as it approaches the eighty five thousand dollar resistance level. Weakening ETF demand is creating a bearish undertone that could lead to further downside if the price fails to flip this key level into support. Traders should watch for volume confirmation before betting on a breakout because technical indicators suggest the bulls are losing steam.
#BitcoinPrice #CryptoTechnicalAnalysis ⠀
#BitcoinPrice #CryptoTechnicalAnalysis ⠀
93

·
--
Bullish
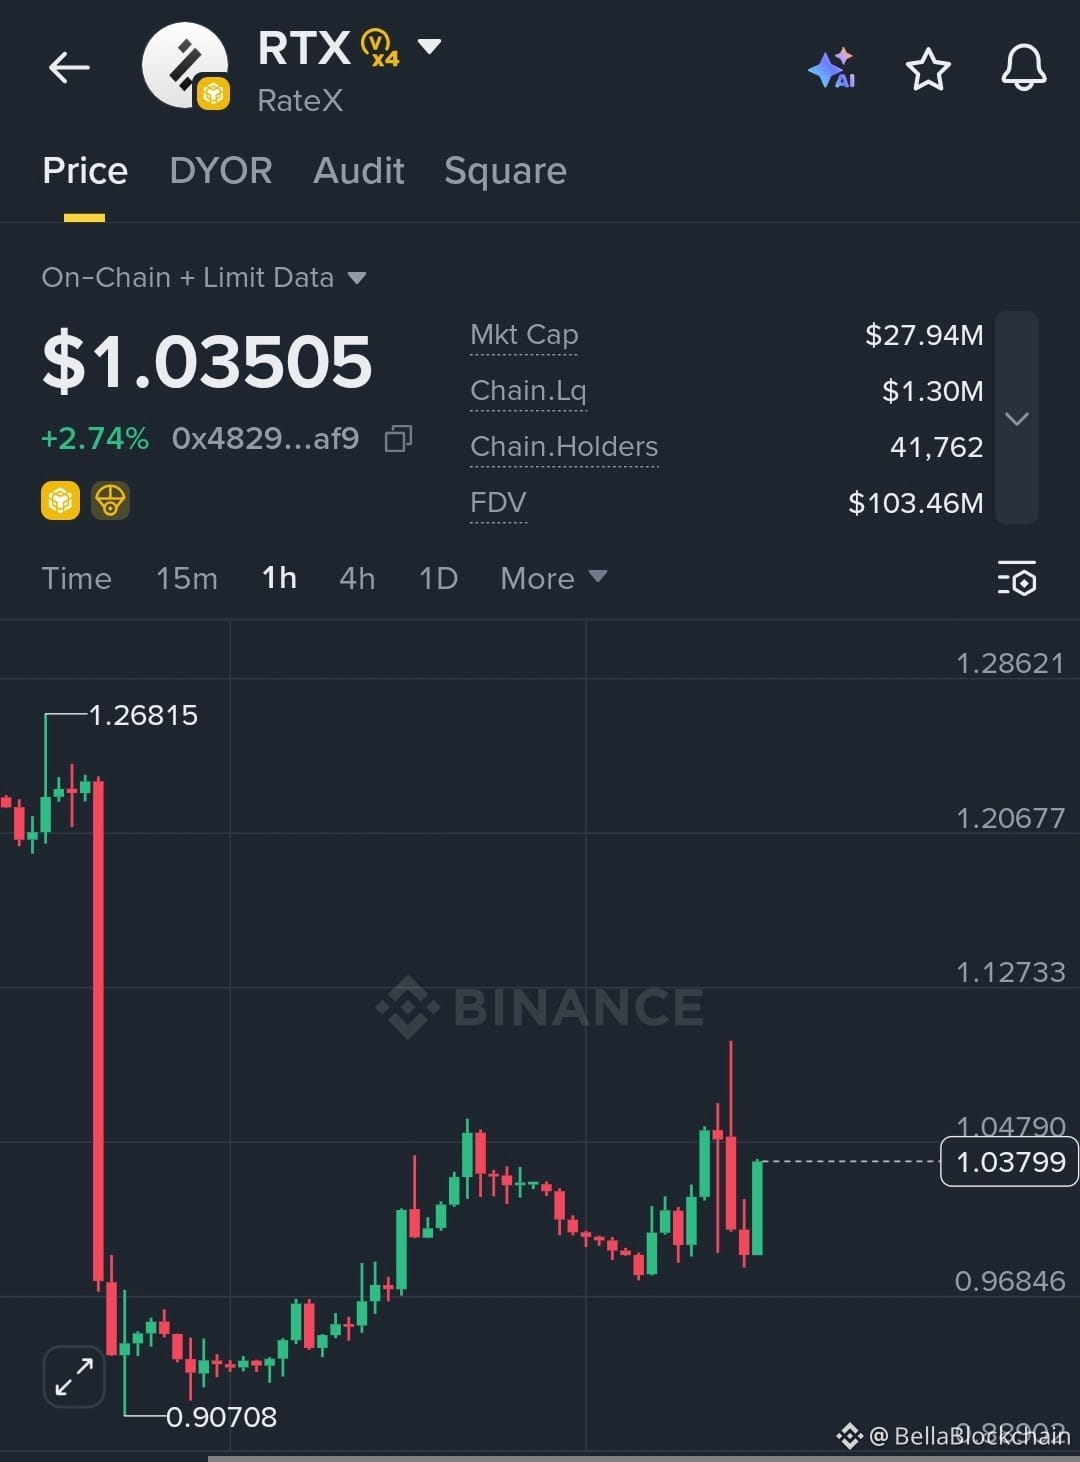
$RTX shown in 1000016301.jpg indicates a solid accumulation and recovery phase after finding major bottom support at 0.90708. The price action has established a clear higher-low market structure and is actively working to reclaim its recent local resistance levels. Currently trading near 1.03799, the token is demonstrating strong buyer absorption with a firm green candle closing near the top of its current range. Breaking above the minor local peak at 1.04790 will confirm a continuous bullish reversal, unlocking the potential to fill the remaining gap up toward previous highs.
Target 1: 1.12000
Target 2: 1.20000
Target 3: 1.26500
#RTX #RateX #CryptoTechnicalAnalysis
$RTX
{alpha}(560x4829a1d1fb6ded1f81d26868ab8976648baf9893)
$RTX shown in 1000016301.jpg indicates a solid accumulation and recovery phase after finding major bottom support at 0.90708. The price action has established a clear higher-low market structure and is actively working to reclaim its recent local resistance levels. Currently trading near 1.03799, the token is demonstrating strong buyer absorption with a firm green candle closing near the top of its current range. Breaking above the minor local peak at 1.04790 will confirm a continuous bullish reversal, unlocking the potential to fill the remaining gap up toward previous highs.
Target 1: 1.12000
Target 2: 1.20000
Target 3: 1.26500
#RTX #RateX #CryptoTechnicalAnalysis
$RTX
Target 1: 1.12000
Target 2: 1.20000
Target 3: 1.26500
#RTX #RateX #CryptoTechnicalAnalysis
$RTX
3
292
·
--
Bullish
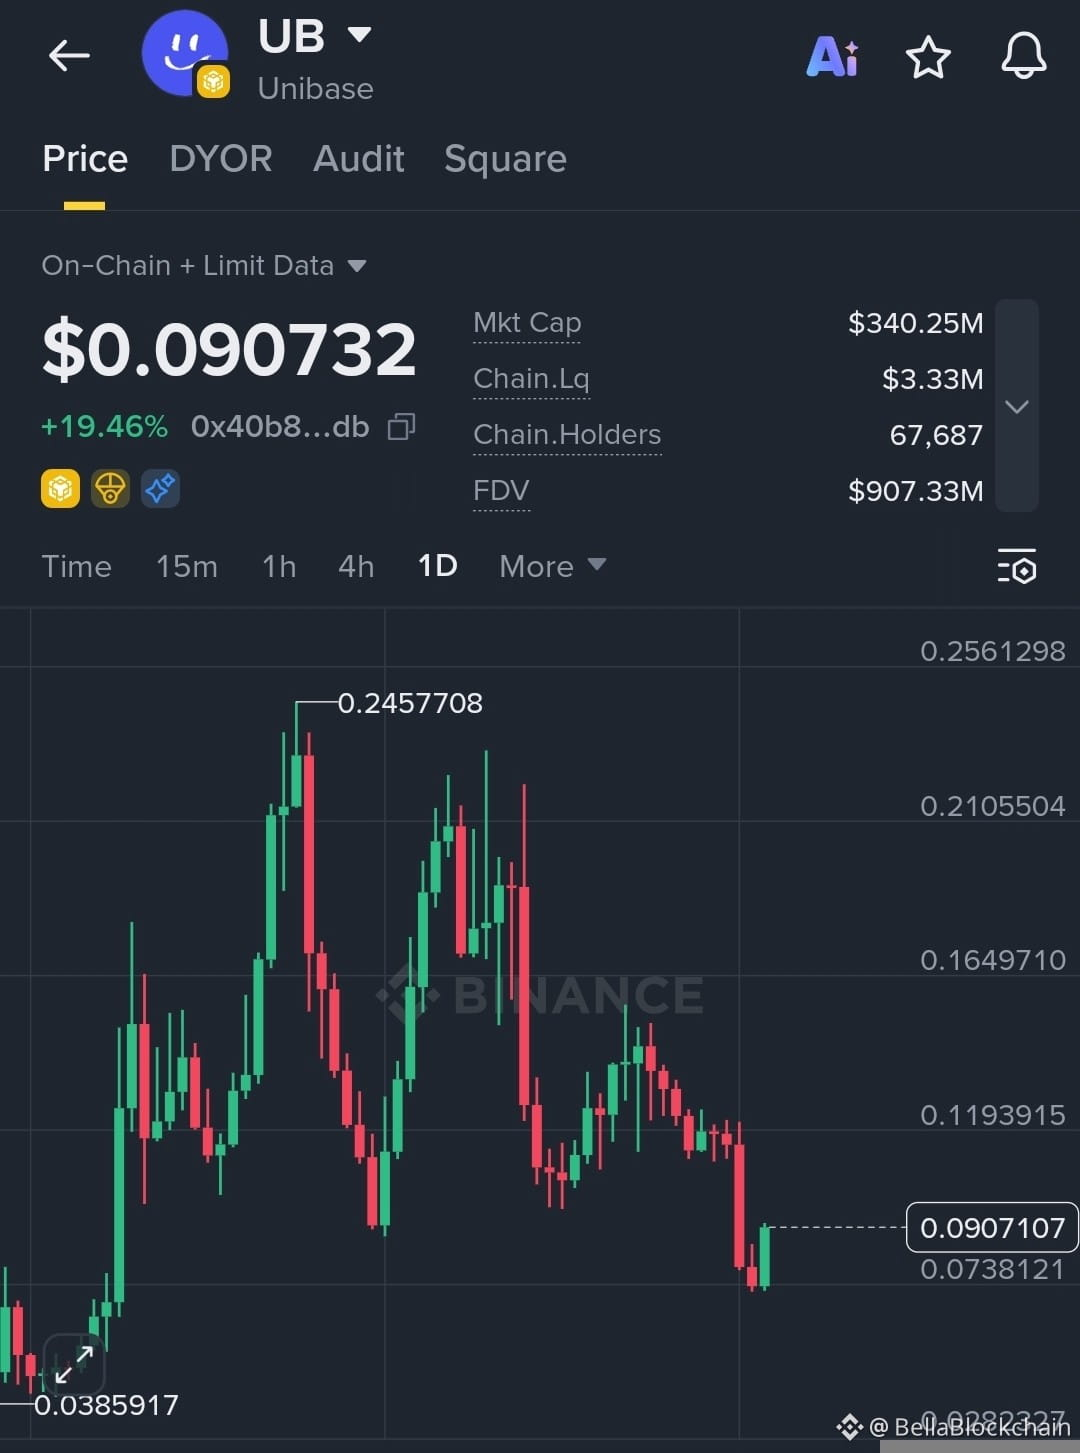
$UB shown in 1000016303.jpg reveals a powerful bullish reversal brewing after a long corrective period down from its major peak at 0.2457708. After hitting a clear local bottom around 0.0738121, the asset has broken its descending momentum with a massive daily candle, pumping over 19.46% to reach 0.090732. This aggressive influx of volume indicates strong buyer absorption near the lows, forming a solid base for a sustained recovery rally back up toward the higher liquidity zones.
Target 1: 0.1193915
Target 2: 0.1649710
Target 3: 0.2105504
#UB #Unibase #CryptoTechnicalAnalysis
$UB
{alpha}(560x40b8129b786d766267a7a118cf8c07e31cdb6fde)
$UB shown in 1000016303.jpg reveals a powerful bullish reversal brewing after a long corrective period down from its major peak at 0.2457708. After hitting a clear local bottom around 0.0738121, the asset has broken its descending momentum with a massive daily candle, pumping over 19.46% to reach 0.090732. This aggressive influx of volume indicates strong buyer absorption near the lows, forming a solid base for a sustained recovery rally back up toward the higher liquidity zones.
Target 1: 0.1193915
Target 2: 0.1649710
Target 3: 0.2105504
#UB #Unibase #CryptoTechnicalAnalysis
$UB
Target 1: 0.1193915
Target 2: 0.1649710
Target 3: 0.2105504
#UB #Unibase #CryptoTechnicalAnalysis
$UB
2
91

·
--
Bullish
$UNI /USDT - BULLISH SETUP FOR LONG ENTRY*
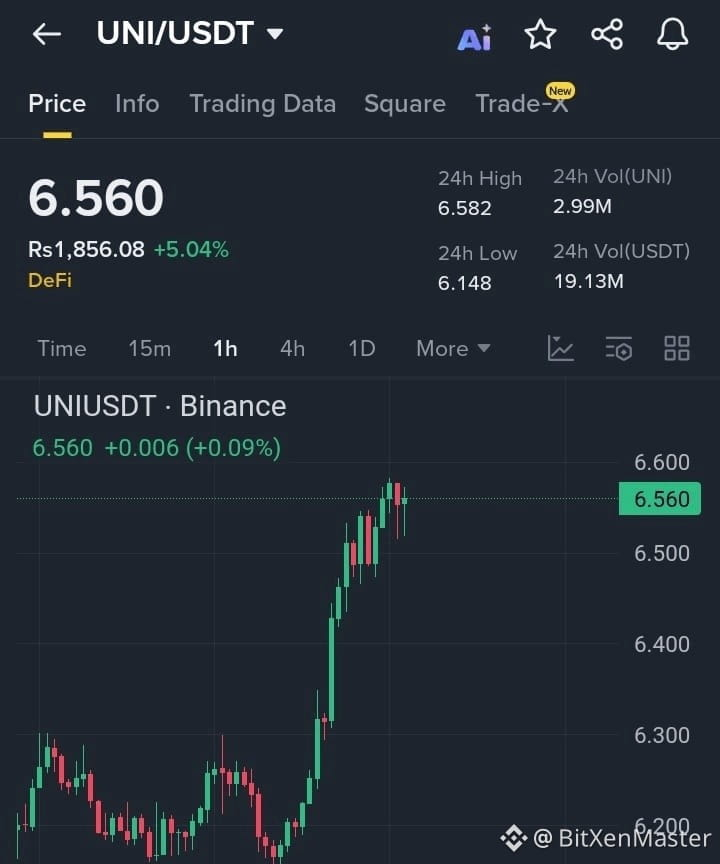
$UNI /USDT chart shows a clear upward trend with recent price action indicating a potential continuation of the bullish momentum. The chart depicts a sharp rise followed by a slight consolidation, suggesting buyers are in control. A breakout above the recent high of 6.582 could lead to further upside.
Long Entry: Above 6.600
Targets (TP):
- TP1: 6.700
- TP2: 6.800
Stop Loss (SL): Below 6.400
#CryptoTechnicalAnalysis #UNIUSDT #BullishSetup #LongEntry #RiskManagement
$UNI
{spot}(UNIUSDT)
$UNI /USDT - BULLISH SETUP FOR LONG ENTRY*
$UNI /USDT chart shows a clear upward trend with recent price action indicating a potential continuation of the bullish momentum. The chart depicts a sharp rise followed by a slight consolidation, suggesting buyers are in control. A breakout above the recent high of 6.582 could lead to further upside.
Long Entry: Above 6.600
Targets (TP):
- TP1: 6.700
- TP2: 6.800
Stop Loss (SL): Below 6.400
#CryptoTechnicalAnalysis #UNIUSDT #BullishSetup #LongEntry #RiskManagement
$UNI
$UNI /USDT chart shows a clear upward trend with recent price action indicating a potential continuation of the bullish momentum. The chart depicts a sharp rise followed by a slight consolidation, suggesting buyers are in control. A breakout above the recent high of 6.582 could lead to further upside.
Long Entry: Above 6.600
Targets (TP):
- TP1: 6.700
- TP2: 6.800
Stop Loss (SL): Below 6.400
#CryptoTechnicalAnalysis #UNIUSDT #BullishSetup #LongEntry #RiskManagement
$UNI
1
40
·
--
🚀 Today's Trending Altcoin Analysis: Saga (SAGA) — Quick Market Update
💰 Market Snapshot
📊 Price: $0.01597
📈 24H: +12.44% | 📉 1H: -4.57%
💵 Volume: $64.18M
🪙 Circulating Supply: 416.51M SAGA
📈 Technical Picture
🟢 50-Day SMA: $0.01410 — bullish short-term positioning.
🔴 200-Day SMA: $0.01958 — key longer-term resistance.
🔥 RSI: 64.45 — positive momentum, not yet extreme.
📈 MACD: +0.000455 — mild bullish pressure.
🚀 ROC: 22.69 — positive momentum.
🎯 Key Takeaway
🚀 SAGA is showing strong short-term recovery, but reclaiming the $0.01958 area could be important for a stronger longer-term trend.
🗣📢 Investment Disclaimer: This article is for informational purposes only and should not be considered financial or investment advice. ⚠️
🔥#SagaSAGA #SAGAToken #CryptoMarketAnalysis #CryptoTechnicalAnalysis
$SAGA
{spot}(SAGAUSDT)
🚀 Today's Trending Altcoin Analysis: Saga (SAGA) — Quick Market Update
💰 Market Snapshot
📊 Price: $0.01597
📈 24H: +12.44% | 📉 1H: -4.57%
💵 Volume: $64.18M
🪙 Circulating Supply: 416.51M SAGA
📈 Technical Picture
🟢 50-Day SMA: $0.01410 — bullish short-term positioning.
🔴 200-Day SMA: $0.01958 — key longer-term resistance.
🔥 RSI: 64.45 — positive momentum, not yet extreme.
📈 MACD: +0.000455 — mild bullish pressure.
🚀 ROC: 22.69 — positive momentum.
🎯 Key Takeaway
🚀 SAGA is showing strong short-term recovery, but reclaiming the $0.01958 area could be important for a stronger longer-term trend.
🗣📢 Investment Disclaimer: This article is for informational purposes only and should not be considered financial or investment advice. ⚠️
🔥#SagaSAGA #SAGAToken #CryptoMarketAnalysis #CryptoTechnicalAnalysis
$SAGA
💰 Market Snapshot
📊 Price: $0.01597
📈 24H: +12.44% | 📉 1H: -4.57%
💵 Volume: $64.18M
🪙 Circulating Supply: 416.51M SAGA
📈 Technical Picture
🟢 50-Day SMA: $0.01410 — bullish short-term positioning.
🔴 200-Day SMA: $0.01958 — key longer-term resistance.
🔥 RSI: 64.45 — positive momentum, not yet extreme.
📈 MACD: +0.000455 — mild bullish pressure.
🚀 ROC: 22.69 — positive momentum.
🎯 Key Takeaway
🚀 SAGA is showing strong short-term recovery, but reclaiming the $0.01958 area could be important for a stronger longer-term trend.
🗣📢 Investment Disclaimer: This article is for informational purposes only and should not be considered financial or investment advice. ⚠️
🔥#SagaSAGA #SAGAToken #CryptoMarketAnalysis #CryptoTechnicalAnalysis
$SAGA


2
253

$MAGMA COMPRESSION NEAR HISTORIC LIQUIDITY – EXPANSION AHEAD 🔥
Body:
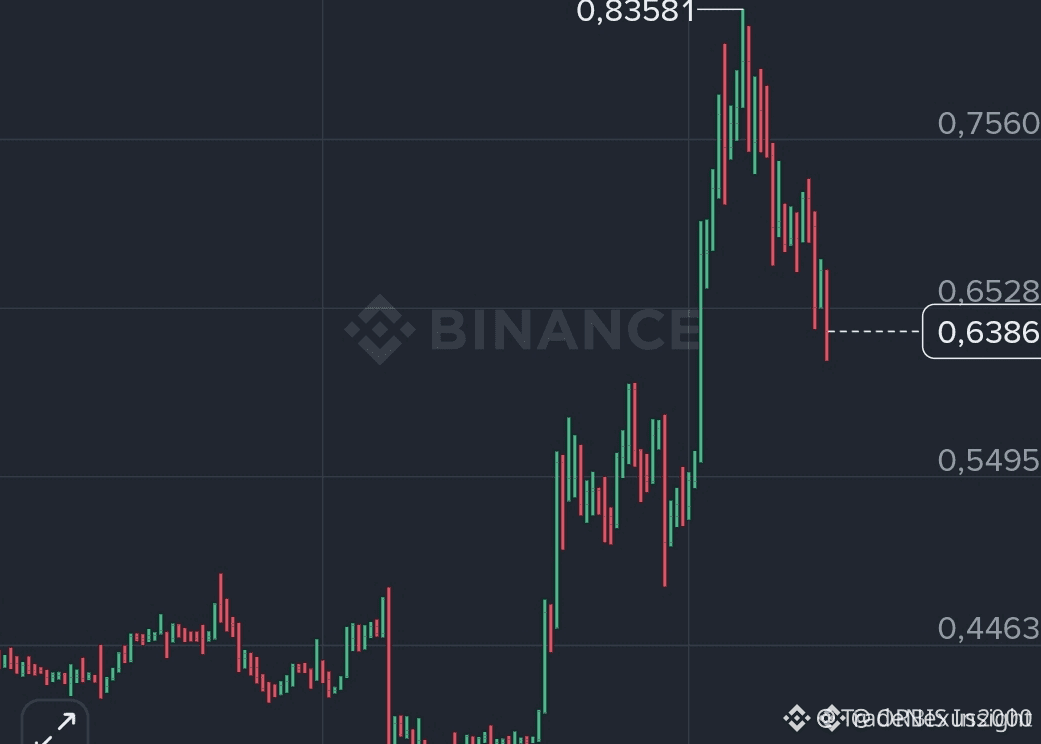
The current structure on $MAGMA shows a tight consolidation just above a previously swept support zone. Volume has been declining during this range, which typically precedes an expansion leg. Buyers are absorbing selling pressure without letting price break lower—a sign of accumulation.
Momentum is neutral on the daily, but the lack of bearish follow-through after the last sweep is telling. A move above the range high would confirm intent. Many range traders are already positioned for the continuation—are you watching for that trigger or already in?
Not financial advice. Always manage your risk.
#MAGMA #Altcoin #BreakoutSetup #CryptoTechnicalAnalysis
🔥
$MAGMA COMPRESSION NEAR HISTORIC LIQUIDITY – EXPANSION AHEAD 🔥
Body:
The current structure on $MAGMA shows a tight consolidation just above a previously swept support zone. Volume has been declining during this range, which typically precedes an expansion leg. Buyers are absorbing selling pressure without letting price break lower—a sign of accumulation.
Momentum is neutral on the daily, but the lack of bearish follow-through after the last sweep is telling. A move above the range high would confirm intent. Many range traders are already positioned for the continuation—are you watching for that trigger or already in?
Not financial advice. Always manage your risk.
#MAGMA #Altcoin #BreakoutSetup #CryptoTechnicalAnalysis
🔥
Body:
The current structure on $MAGMA shows a tight consolidation just above a previously swept support zone. Volume has been declining during this range, which typically precedes an expansion leg. Buyers are absorbing selling pressure without letting price break lower—a sign of accumulation.
Momentum is neutral on the daily, but the lack of bearish follow-through after the last sweep is telling. A move above the range high would confirm intent. Many range traders are already positioned for the continuation—are you watching for that trigger or already in?
Not financial advice. Always manage your risk.
#MAGMA #Altcoin #BreakoutSetup #CryptoTechnicalAnalysis
🔥
66

·
--
Are we on track for a deeper Bitcoin correction? Let’s talk numbers! 📉🚨
$BTC
{spot}(BTCUSDT)
Ever since the macro bear market kicked off back in November 2025, #Bitcoin has been on a downward slide. The charts show that this correction is far from over, and we need to keep a close eye on a few critical structural levels. 📊👀
Here is the step-by-step breakdown of where BTC could go next:
1️⃣ The Immediate Risk ($51,750): Right now, the key line in the sand is $58,000. If the bears break this confirmed low, it's highly probable that we will take a swift elevator ride down to $51,750. ⚠️💥
2️⃣ The Pattern Target ($41,500): Looking at the macro structures, a clear Head and Shoulders pattern has formed. If this plays out fully, the technical target points all the way down to $41,500. 📉🥶
3️⃣ The Ultimate Floor ($48,500): Here is the good news—strong, long-term investor support is waiting at $48,500. 🛡️💪
The Bottom Line? 🤔 We might see a scary flash-crash (a wick) that dips right below the psychological $50,000 mark to hunt liquidity. However, institutional and long-term buyer interest at these deep-value zones means BTC shouldn't stay below $50k for very long. ⚡🚀
Stay patient, manage your risk, and keep your bags ready for the local bottom! ⏳💰
What do you think? Will $58k hold, or are we going straight to the 40s? Let me know your strategy below! 👇👇
#BTC #CryptoTechnicalAnalysis #BearMarket #BinanceSquare #CryptoTrading
Are we on track for a deeper Bitcoin correction? Let’s talk numbers! 📉🚨
$BTC
Ever since the macro bear market kicked off back in November 2025, #Bitcoin has been on a downward slide. The charts show that this correction is far from over, and we need to keep a close eye on a few critical structural levels. 📊👀
Here is the step-by-step breakdown of where BTC could go next:
1️⃣ The Immediate Risk ($51,750): Right now, the key line in the sand is $58,000. If the bears break this confirmed low, it's highly probable that we will take a swift elevator ride down to $51,750. ⚠️💥
2️⃣ The Pattern Target ($41,500): Looking at the macro structures, a clear Head and Shoulders pattern has formed. If this plays out fully, the technical target points all the way down to $41,500. 📉🥶
3️⃣ The Ultimate Floor ($48,500): Here is the good news—strong, long-term investor support is waiting at $48,500. 🛡️💪
The Bottom Line? 🤔 We might see a scary flash-crash (a wick) that dips right below the psychological $50,000 mark to hunt liquidity. However, institutional and long-term buyer interest at these deep-value zones means BTC shouldn't stay below $50k for very long. ⚡🚀
Stay patient, manage your risk, and keep your bags ready for the local bottom! ⏳💰
What do you think? Will $58k hold, or are we going straight to the 40s? Let me know your strategy below! 👇👇
#BTC #CryptoTechnicalAnalysis #BearMarket #BinanceSquare #CryptoTrading
$BTC
Ever since the macro bear market kicked off back in November 2025, #Bitcoin has been on a downward slide. The charts show that this correction is far from over, and we need to keep a close eye on a few critical structural levels. 📊👀
Here is the step-by-step breakdown of where BTC could go next:
1️⃣ The Immediate Risk ($51,750): Right now, the key line in the sand is $58,000. If the bears break this confirmed low, it's highly probable that we will take a swift elevator ride down to $51,750. ⚠️💥
2️⃣ The Pattern Target ($41,500): Looking at the macro structures, a clear Head and Shoulders pattern has formed. If this plays out fully, the technical target points all the way down to $41,500. 📉🥶
3️⃣ The Ultimate Floor ($48,500): Here is the good news—strong, long-term investor support is waiting at $48,500. 🛡️💪
The Bottom Line? 🤔 We might see a scary flash-crash (a wick) that dips right below the psychological $50,000 mark to hunt liquidity. However, institutional and long-term buyer interest at these deep-value zones means BTC shouldn't stay below $50k for very long. ⚡🚀
Stay patient, manage your risk, and keep your bags ready for the local bottom! ⏳💰
What do you think? Will $58k hold, or are we going straight to the 40s? Let me know your strategy below! 👇👇
#BTC #CryptoTechnicalAnalysis #BearMarket #BinanceSquare #CryptoTrading
40

·
--
🐸 THE PEPE PHENOMENON: From Internet Meme to Billion-Dollar Liquidity King 🚀🔥
Few assets encapsulate the raw, community-driven power of the crypto market like Pepe Coin ($PePe). It has solidified its spot as a permanent titan in the meme coin ecosystem. Here is a quick look at its legendary rise and where the price action is pacing for the upcoming days.
⏳ The Origin & History (2023–2024)
The Stealth Launch (April 2023): Built on the Ethereum blockchain as an ERC-20 token, pepe launched quietly on April 17, 2023, with zero presales and a max supply of 420.69 trillion tokens.
The Historic Speedrun: Paying homage to Matt Furie's viral "Pepe the Frog" meme, it ignited a massive 700% surge within days. By May 2023, it shattered the 1 billion market cap milestone faster than almost any token before it.
The Macro Peak (Late 2024): Fueled by high-tier exchange listings and massive retail hysteria, pepe expanded rapidly, logging its official all-time high of $0.00002803 on December 9, 2024.
📊 Current Overview & Price Prediction (Late May 2026)
After structural cool-offs following its 2024 peaks, Pepe has established a clear, high-volume consolidation floor. It is currently trading around the $0.0000036 level, heavily moving in tandem with broader altcoin sentiment.
📈 Short-Term Targets for Upcoming Days:
The Bullish Scenario: Immediate technical resistance sits at $0.0000039. If Bitcoin holds strong and volume spikes, a clean daily close above this level targets an aggressive short-term push back toward $0.0000042 to $0.0000045.
The Bearish Support: If the wider market experiences sudden liquidity flushes, the key support block to watch sits firmly between $0.0000031 and $0.0000029. This serves as a vital accumulation zone for swing traders.
👇 Are you bidding the $0.0000036 floor or waiting for a deeper retest? Drop your frog emojis below!
#PepeCoin #MemeCoins #CryptoTechnicalAnalysis
$BTC
{future}(BTCUSDT)
$ETH
{future}(ETHUSDT)
$PEPE
{spot}(PEPEUSDT)
🐸 THE PEPE PHENOMENON: From Internet Meme to Billion-Dollar Liquidity King 🚀🔥
Few assets encapsulate the raw, community-driven power of the crypto market like Pepe Coin ($PePe). It has solidified its spot as a permanent titan in the meme coin ecosystem. Here is a quick look at its legendary rise and where the price action is pacing for the upcoming days.
⏳ The Origin & History (2023–2024)
The Stealth Launch (April 2023): Built on the Ethereum blockchain as an ERC-20 token, pepe launched quietly on April 17, 2023, with zero presales and a max supply of 420.69 trillion tokens.
The Historic Speedrun: Paying homage to Matt Furie's viral "Pepe the Frog" meme, it ignited a massive 700% surge within days. By May 2023, it shattered the 1 billion market cap milestone faster than almost any token before it.
The Macro Peak (Late 2024): Fueled by high-tier exchange listings and massive retail hysteria, pepe expanded rapidly, logging its official all-time high of $0.00002803 on December 9, 2024.
📊 Current Overview & Price Prediction (Late May 2026)
After structural cool-offs following its 2024 peaks, Pepe has established a clear, high-volume consolidation floor. It is currently trading around the $0.0000036 level, heavily moving in tandem with broader altcoin sentiment.
📈 Short-Term Targets for Upcoming Days:
The Bullish Scenario: Immediate technical resistance sits at $0.0000039. If Bitcoin holds strong and volume spikes, a clean daily close above this level targets an aggressive short-term push back toward $0.0000042 to $0.0000045.
The Bearish Support: If the wider market experiences sudden liquidity flushes, the key support block to watch sits firmly between $0.0000031 and $0.0000029. This serves as a vital accumulation zone for swing traders.
👇 Are you bidding the $0.0000036 floor or waiting for a deeper retest? Drop your frog emojis below!
#PepeCoin #MemeCoins #CryptoTechnicalAnalysis
$BTC
$ETH
$PEPE
Few assets encapsulate the raw, community-driven power of the crypto market like Pepe Coin ($PePe). It has solidified its spot as a permanent titan in the meme coin ecosystem. Here is a quick look at its legendary rise and where the price action is pacing for the upcoming days.
⏳ The Origin & History (2023–2024)
The Stealth Launch (April 2023): Built on the Ethereum blockchain as an ERC-20 token, pepe launched quietly on April 17, 2023, with zero presales and a max supply of 420.69 trillion tokens.
The Historic Speedrun: Paying homage to Matt Furie's viral "Pepe the Frog" meme, it ignited a massive 700% surge within days. By May 2023, it shattered the 1 billion market cap milestone faster than almost any token before it.
The Macro Peak (Late 2024): Fueled by high-tier exchange listings and massive retail hysteria, pepe expanded rapidly, logging its official all-time high of $0.00002803 on December 9, 2024.
📊 Current Overview & Price Prediction (Late May 2026)
After structural cool-offs following its 2024 peaks, Pepe has established a clear, high-volume consolidation floor. It is currently trading around the $0.0000036 level, heavily moving in tandem with broader altcoin sentiment.
📈 Short-Term Targets for Upcoming Days:
The Bullish Scenario: Immediate technical resistance sits at $0.0000039. If Bitcoin holds strong and volume spikes, a clean daily close above this level targets an aggressive short-term push back toward $0.0000042 to $0.0000045.
The Bearish Support: If the wider market experiences sudden liquidity flushes, the key support block to watch sits firmly between $0.0000031 and $0.0000029. This serves as a vital accumulation zone for swing traders.
👇 Are you bidding the $0.0000036 floor or waiting for a deeper retest? Drop your frog emojis below!
#PepeCoin #MemeCoins #CryptoTechnicalAnalysis
$BTC
$ETH
$PEPE
1
88

$BANANAS31 HOLDING A CRITICAL SUPPORT ZONE WITH MULTI-TARGET UPSIDE ⚡
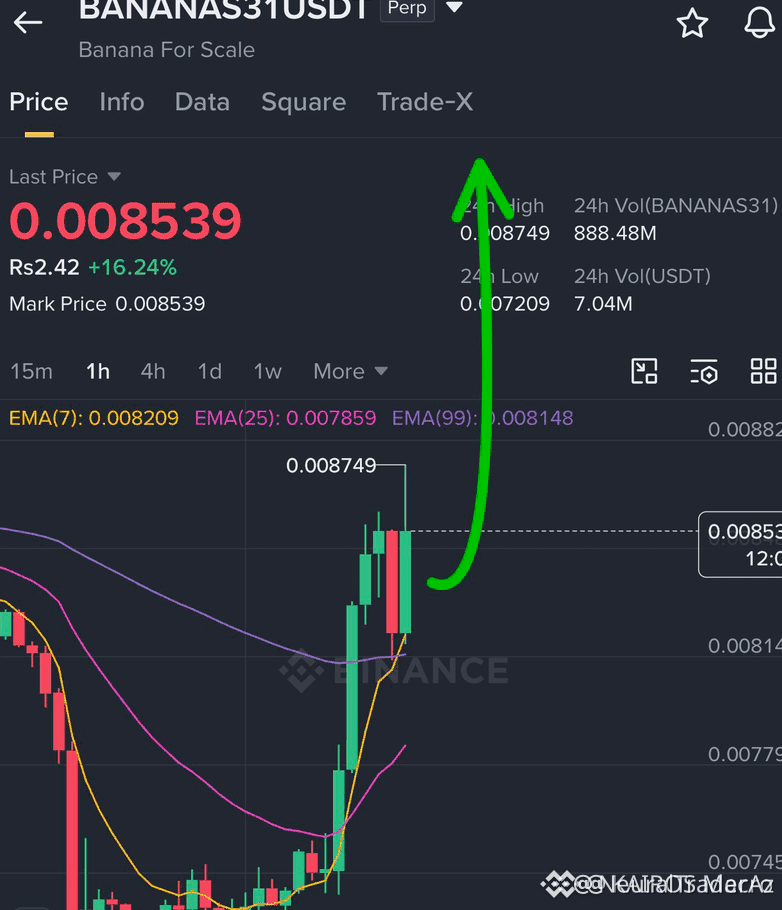
Entry: 0.00835 – 0.00850 🔥
Target: 0.00880 – 0.00920 – 0.00970 🚀
Stop Loss: 0.00810 ⚠️
This entry range sits just above a recent liquidity sweep, and the three-target structure reflects a phased breakout plan. Volume profile shows accumulation around 0.00835, suggesting institutional interest at these levels. With a stop loss cleanly below the sweep low, the risk-to-reward on each target scales from 1:2 to 1:5.
Are you entering at the range midpoint or waiting for confirmation with a tighter stop?
Not financial advice. Always manage your risk.
#BANANAS31 #AltcoinSetup #Breakout #CryptoTechnicalAnalysis
🎯
$BANANAS31 HOLDING A CRITICAL SUPPORT ZONE WITH MULTI-TARGET UPSIDE ⚡
Entry: 0.00835 – 0.00850 🔥
Target: 0.00880 – 0.00920 – 0.00970 🚀
Stop Loss: 0.00810 ⚠️
This entry range sits just above a recent liquidity sweep, and the three-target structure reflects a phased breakout plan. Volume profile shows accumulation around 0.00835, suggesting institutional interest at these levels. With a stop loss cleanly below the sweep low, the risk-to-reward on each target scales from 1:2 to 1:5.
Are you entering at the range midpoint or waiting for confirmation with a tighter stop?
Not financial advice. Always manage your risk.
#BANANAS31 #AltcoinSetup #Breakout #CryptoTechnicalAnalysis
🎯
Entry: 0.00835 – 0.00850 🔥
Target: 0.00880 – 0.00920 – 0.00970 🚀
Stop Loss: 0.00810 ⚠️
This entry range sits just above a recent liquidity sweep, and the three-target structure reflects a phased breakout plan. Volume profile shows accumulation around 0.00835, suggesting institutional interest at these levels. With a stop loss cleanly below the sweep low, the risk-to-reward on each target scales from 1:2 to 1:5.
Are you entering at the range midpoint or waiting for confirmation with a tighter stop?
Not financial advice. Always manage your risk.
#BANANAS31 #AltcoinSetup #Breakout #CryptoTechnicalAnalysis
🎯
43

$BNB Local Resistance Rejection
Trading Setup: $BNB Short
{spot}(BNBUSDT)
is facing heavy overhead selling pressure at $569.53. Price action shows consecutive four-hour candle rejections at local resistance, signaling fading buyer momentum amidst macro exchange regulatory scrutiny.
Entry Zone: $570.00 - $574.00
Take Profit 1: $552.00
Take Profit 2: $538.00
Stop Loss: $584.50
RSI bearish divergence confirmed on hourly charts.
Lock in your $BNB short position using the integrated widget below. Support my technical daily analysis by hitting the Tip button!
#BNB #BinanceChain #ShortSetup #CryptoTechnicalAnalysis #tradingtips
$BNB Local Resistance Rejection
Trading Setup: $BNB Short
is facing heavy overhead selling pressure at $569.53. Price action shows consecutive four-hour candle rejections at local resistance, signaling fading buyer momentum amidst macro exchange regulatory scrutiny.
Entry Zone: $570.00 - $574.00
Take Profit 1: $552.00
Take Profit 2: $538.00
Stop Loss: $584.50
RSI bearish divergence confirmed on hourly charts.
Lock in your $BNB short position using the integrated widget below. Support my technical daily analysis by hitting the Tip button!
#BNB #BinanceChain #ShortSetup #CryptoTechnicalAnalysis #tradingtips
Trading Setup: $BNB Short
is facing heavy overhead selling pressure at $569.53. Price action shows consecutive four-hour candle rejections at local resistance, signaling fading buyer momentum amidst macro exchange regulatory scrutiny.
Entry Zone: $570.00 - $574.00
Take Profit 1: $552.00
Take Profit 2: $538.00
Stop Loss: $584.50
RSI bearish divergence confirmed on hourly charts.
Lock in your $BNB short position using the integrated widget below. Support my technical daily analysis by hitting the Tip button!
#BNB #BinanceChain #ShortSetup #CryptoTechnicalAnalysis #tradingtips
49
·
--
🚀 Today's Trending Altcoin Analysis: Theta Fuel (TFUEL) Market Update
💰 Price: $0.01307
📈 24H Gain: +39.70%
📊 24H Volume: $24.88M
🪙 Circulating Supply: 7.46B TFUEL
📊 Technical Picture
🟢 Short- and medium-term moving averages indicate bullish momentum.
📈 MACD 0.00044 and ROC 6.34 support further upside momentum.
⚖️ RSI 42.76 remains neutral, while MFI 71.65 shows strong market participation.
⚠️ Stochastic K 74.34 suggests momentum is elevated, so short-term profit-taking is possible.
🔎 Overall Outlook
🚀 TFUEL's strong 24-hour rally and improving indicators point to renewed bullish interest, but traders should watch for volatility and resistance after the sharp move.
🗣📢 Investment Disclaimer: This article is for informational purposes only and should not be considered financial or investment advice. "DYOR" ⚠️
#ThetaFuel #TFUEL #CryptoTechnicalAnalysis
$TFUEL
{spot}(TFUELUSDT)
🚀 Today's Trending Altcoin Analysis: Theta Fuel (TFUEL) Market Update
💰 Price: $0.01307
📈 24H Gain: +39.70%
📊 24H Volume: $24.88M
🪙 Circulating Supply: 7.46B TFUEL
📊 Technical Picture
🟢 Short- and medium-term moving averages indicate bullish momentum.
📈 MACD 0.00044 and ROC 6.34 support further upside momentum.
⚖️ RSI 42.76 remains neutral, while MFI 71.65 shows strong market participation.
⚠️ Stochastic K 74.34 suggests momentum is elevated, so short-term profit-taking is possible.
🔎 Overall Outlook
🚀 TFUEL's strong 24-hour rally and improving indicators point to renewed bullish interest, but traders should watch for volatility and resistance after the sharp move.
🗣📢 Investment Disclaimer: This article is for informational purposes only and should not be considered financial or investment advice. "DYOR" ⚠️
#ThetaFuel #TFUEL #CryptoTechnicalAnalysis
$TFUEL
💰 Price: $0.01307
📈 24H Gain: +39.70%
📊 24H Volume: $24.88M
🪙 Circulating Supply: 7.46B TFUEL
📊 Technical Picture
🟢 Short- and medium-term moving averages indicate bullish momentum.
📈 MACD 0.00044 and ROC 6.34 support further upside momentum.
⚖️ RSI 42.76 remains neutral, while MFI 71.65 shows strong market participation.
⚠️ Stochastic K 74.34 suggests momentum is elevated, so short-term profit-taking is possible.
🔎 Overall Outlook
🚀 TFUEL's strong 24-hour rally and improving indicators point to renewed bullish interest, but traders should watch for volatility and resistance after the sharp move.
🗣📢 Investment Disclaimer: This article is for informational purposes only and should not be considered financial or investment advice. "DYOR" ⚠️
#ThetaFuel #TFUEL #CryptoTechnicalAnalysis
$TFUEL


2
178
·
--
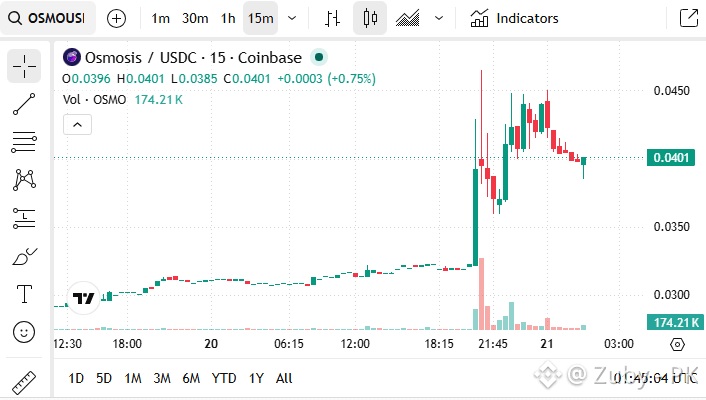
📊 Today's Trending Altcoin Analysis: 🚀 Osmosis Crypto
💵 Live Price: $0.03956 (Down 3.38% in the past hour, up 27.11% since yesterday).
💹 Trading Volume: $20.74M over 24 hours, entirely driven by centralized exchanges (CEX).
🪙 Token Supply: Deflationary asset with a circulating supply of 785.4M and a maximum supply of 1B tokens.
📈 Technical Trends & Indicators
📉 Moving Averages: Short-term indicators show a bullish crossover (positive momentum), while medium and long-term moving averages indicate a bearish trend (50-day SMA at $0.03165 and 200-day SMA at $0.03761).
⚙️ Momentum & Volatility:
🌊 Volatility: 7.37% (relatively stable).
⚖️ RSI: 87.89 (neutral conditions).
🔼 MACD: 0.0017 (slight upward pressure).
🐻 Stochastic K: 92.05 (in the bear zone).
🚀 ROC: 56.83 (modest positive momentum).
👥 MFI: 69.28 (healthy market participation).
🔊 Not financial advice. High volatility. Trade with risk management. DYOR ⚠️
🏷️#OsmosisCryptoMarketUpdate #CryptoTechnicalAnalysis #OsmosisPriceAction
$OSMO
{spot}(OSMOUSDT)
📊 Today's Trending Altcoin Analysis: 🚀 Osmosis Crypto
💵 Live Price: $0.03956 (Down 3.38% in the past hour, up 27.11% since yesterday).
💹 Trading Volume: $20.74M over 24 hours, entirely driven by centralized exchanges (CEX).
🪙 Token Supply: Deflationary asset with a circulating supply of 785.4M and a maximum supply of 1B tokens.
📈 Technical Trends & Indicators
📉 Moving Averages: Short-term indicators show a bullish crossover (positive momentum), while medium and long-term moving averages indicate a bearish trend (50-day SMA at $0.03165 and 200-day SMA at $0.03761).
⚙️ Momentum & Volatility:
🌊 Volatility: 7.37% (relatively stable).
⚖️ RSI: 87.89 (neutral conditions).
🔼 MACD: 0.0017 (slight upward pressure).
🐻 Stochastic K: 92.05 (in the bear zone).
🚀 ROC: 56.83 (modest positive momentum).
👥 MFI: 69.28 (healthy market participation).
🔊 Not financial advice. High volatility. Trade with risk management. DYOR ⚠️
🏷️#OsmosisCryptoMarketUpdate #CryptoTechnicalAnalysis #OsmosisPriceAction
$OSMO
💵 Live Price: $0.03956 (Down 3.38% in the past hour, up 27.11% since yesterday).
💹 Trading Volume: $20.74M over 24 hours, entirely driven by centralized exchanges (CEX).
🪙 Token Supply: Deflationary asset with a circulating supply of 785.4M and a maximum supply of 1B tokens.
📈 Technical Trends & Indicators
📉 Moving Averages: Short-term indicators show a bullish crossover (positive momentum), while medium and long-term moving averages indicate a bearish trend (50-day SMA at $0.03165 and 200-day SMA at $0.03761).
⚙️ Momentum & Volatility:
🌊 Volatility: 7.37% (relatively stable).
⚖️ RSI: 87.89 (neutral conditions).
🔼 MACD: 0.0017 (slight upward pressure).
🐻 Stochastic K: 92.05 (in the bear zone).
🚀 ROC: 56.83 (modest positive momentum).
👥 MFI: 69.28 (healthy market participation).
🔊 Not financial advice. High volatility. Trade with risk management. DYOR ⚠️
🏷️#OsmosisCryptoMarketUpdate #CryptoTechnicalAnalysis #OsmosisPriceAction
$OSMO
4
2
3
406

Article
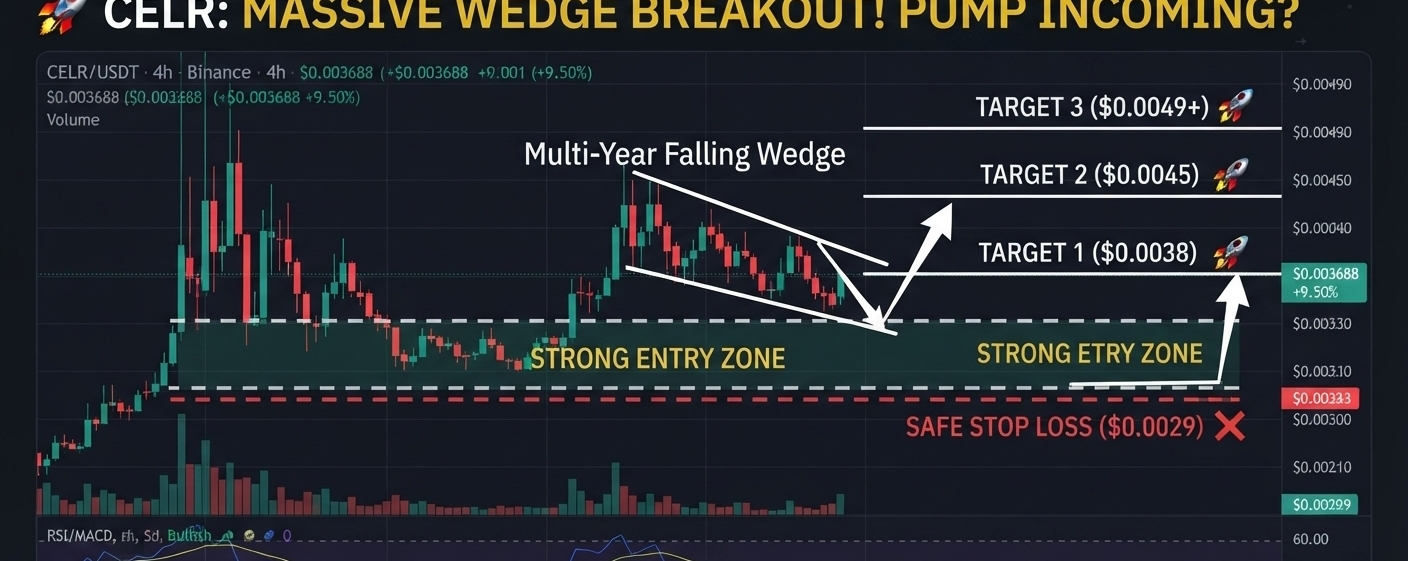
🚀 $CELR Massive Breakout! Multi-Year Wedge Broken – Big Move Next? 📈🚀 $CELR $CELR
NEXT TARGET: Pump Continuation or a Calculated Trap? 🛑 Read Before You Trade!
📊 CURRENT SCENARIO & VOLATILITY ALERT!
Doston, Celer Network (CELR) ne haal hi me ek zबरदस्त parabolic spike dikhaya hai (+80% se zyada pump). Lekin real game ab shuru ho raha hai. Kya yeh rally sustain karegi ya yahan se violent pullback aane wala hai? Chaliye bilkul simple technical structures ke sath samajhte hain.
🔍 Technical Chart Analysis (1H & 4H Timeframe)
Massive Volume Inflow: During the recent pump, both spot and futures saw extremely high buying volume, proving that under low-cap capital rotation, whales are actively involved in this.
🚀 $CELR Massive Breakout! Multi-Year Wedge Broken – Big Move Next? 📈
🚀 $CELR $CELR
NEXT TARGET: Pump Continuation or a Calculated Trap? 🛑 Read Before You Trade!
📊 CURRENT SCENARIO & VOLATILITY ALERT!
Doston, Celer Network (CELR) ne haal hi me ek zबरदस्त parabolic spike dikhaya hai (+80% se zyada pump). Lekin real game ab shuru ho raha hai. Kya yeh rally sustain karegi ya yahan se violent pullback aane wala hai? Chaliye bilkul simple technical structures ke sath samajhte hain.
🔍 Technical Chart Analysis (1H & 4H Timeframe)
Massive Volume Inflow: During the recent pump, both spot and futures saw extremely high buying volume, proving that under low-cap capital rotation, whales are actively involved in this.
NEXT TARGET: Pump Continuation or a Calculated Trap? 🛑 Read Before You Trade!
📊 CURRENT SCENARIO & VOLATILITY ALERT!
Doston, Celer Network (CELR) ne haal hi me ek zबरदस्त parabolic spike dikhaya hai (+80% se zyada pump). Lekin real game ab shuru ho raha hai. Kya yeh rally sustain karegi ya yahan se violent pullback aane wala hai? Chaliye bilkul simple technical structures ke sath samajhte hain.
🔍 Technical Chart Analysis (1H & 4H Timeframe)
Massive Volume Inflow: During the recent pump, both spot and futures saw extremely high buying volume, proving that under low-cap capital rotation, whales are actively involved in this.
84

·
--
Bullish
$REQ
{spot}(REQUSDT)
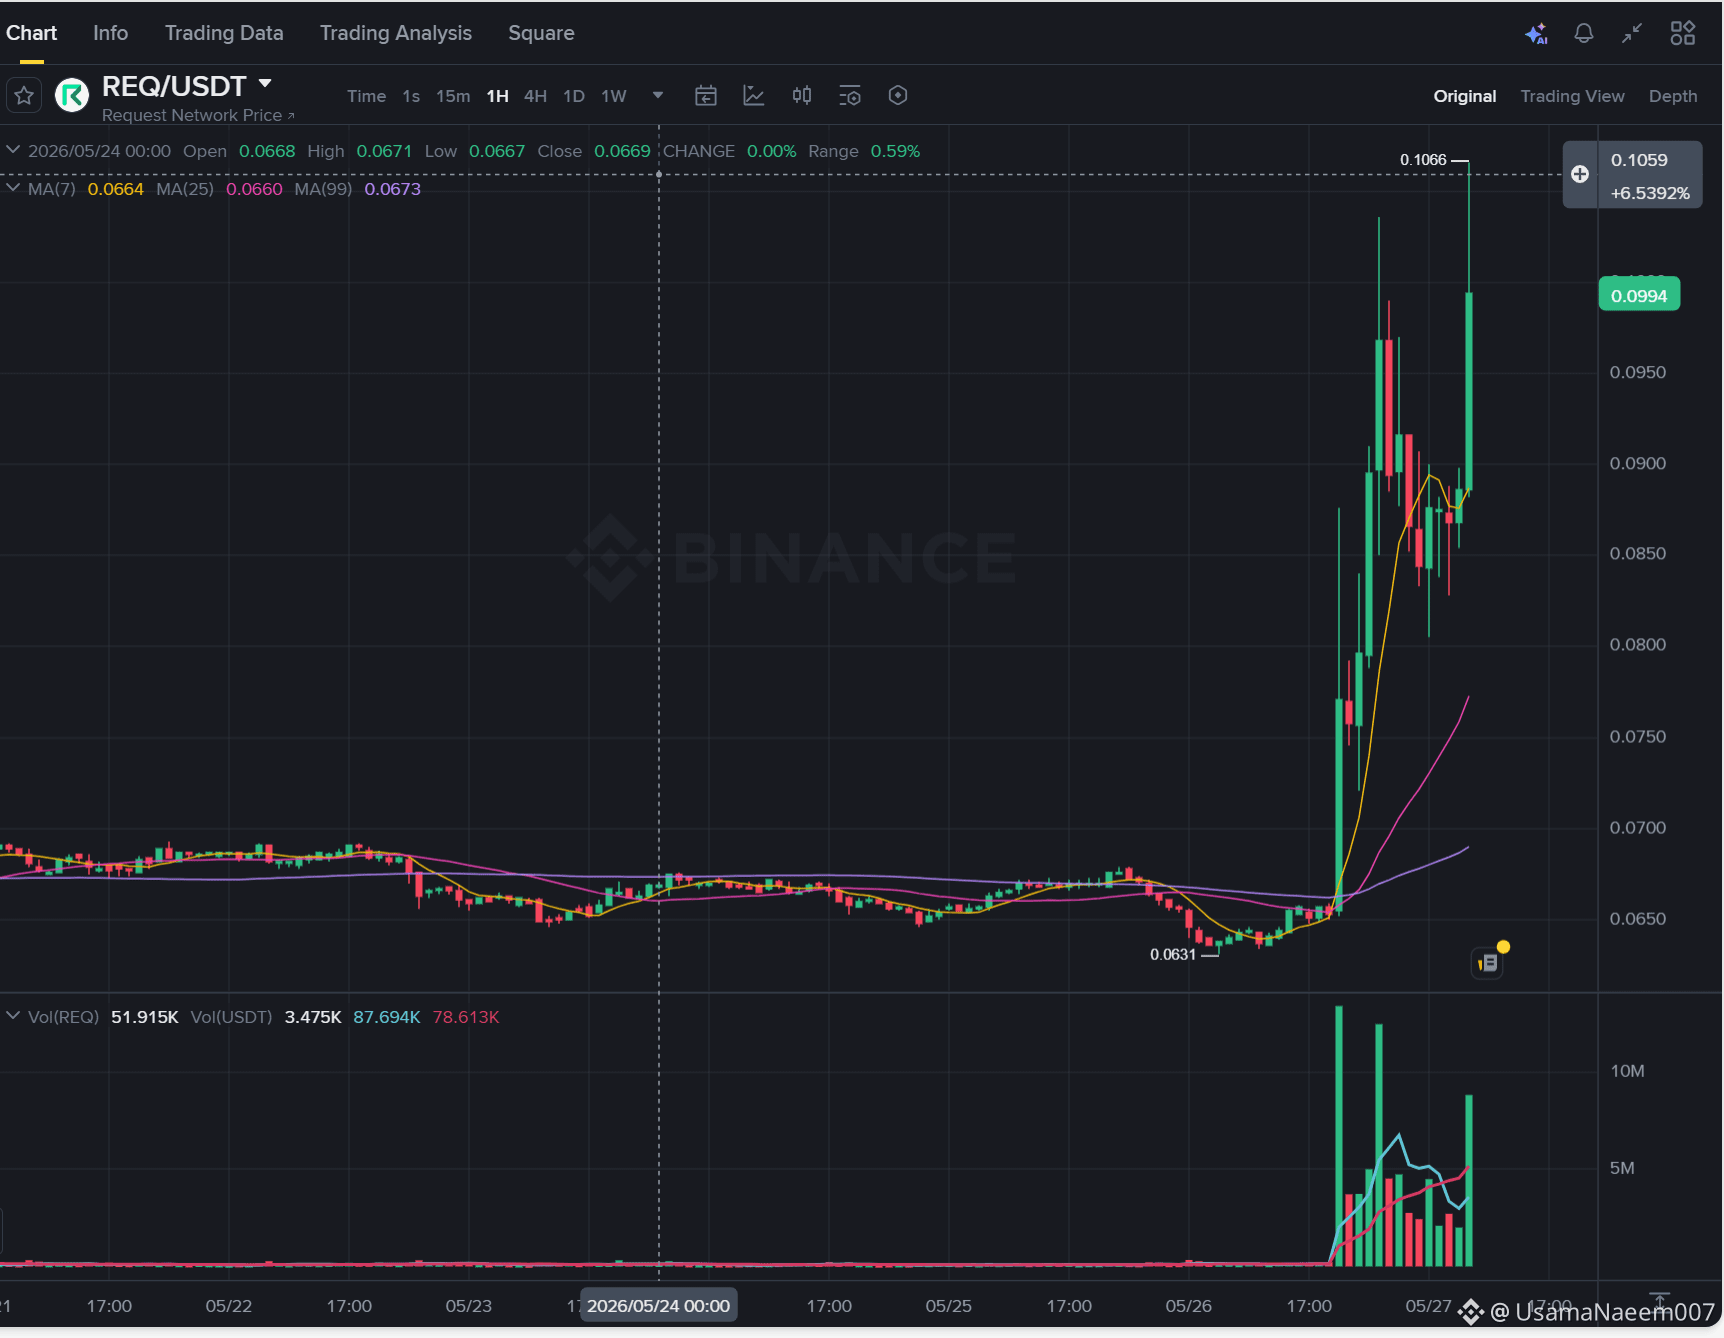
is currently leading the market as one of the top gainers, showcasing a massive bullish breakout of over +53.67% within the last 24 hours.
Current Price Action: The live token price is fluctuating around $0.0985, experiencing a healthy, normal correction after touching its 24-hour high of $0.1066.
Key Support Levels: On the technical chart, immediate short-term dynamic support is holding firmly at MA(7) $0.0936, while the primary trend support rests lower at MA(25) $0.0881.
Massive Volume Surge: The 24-hour trading volume has crossed 72M+ REQ, indicating intense market liquidity and high active participation from institutional buyers and whales.
Overbought Warning: Sharp vertical price extensions indicate that the token is pushing into overbought territory, making blind chasing at local peaks highly risky due to potential FOMO.
Robust Fundamental Utility: Fundamentally, Request Network functions as a solid decentralized payment and invoicing protocol with a legitimate real-world B2B (business-to-business) use case.
Market Cap Advantage: Operating as a low-to-mid cap digital asset, REQ is highly sensitive to capital inflows, which triggers sudden exponential pumps but also steep downside volatility.
Short-Term Price Prediction: If the bulls successfully defend the $0.0936 support zone, the token is expected to launch another leg up to retest $0.1050 and $0.1150 in the coming days.
Long-Term Macro Outlook: Supported by its established payment utility, a stable broader crypto market could push REQ to break major macro resistances and target a $0.1800 to $0.2200 range by mid-2026.
Strategic Entry Advice: The most logical approach is to avoid deploying full capital at current highs; instead, accumulate in parts (DCA) between $0.0940 and $0.0910 while maintaining a strict invalidation stop-loss at $0.0870.#REQ #RequestNetwork #CryptoTechnicalAnalysis #CryptoTradingGuide
$REQ
is currently leading the market as one of the top gainers, showcasing a massive bullish breakout of over +53.67% within the last 24 hours.
Current Price Action: The live token price is fluctuating around $0.0985, experiencing a healthy, normal correction after touching its 24-hour high of $0.1066.
Key Support Levels: On the technical chart, immediate short-term dynamic support is holding firmly at MA(7) $0.0936, while the primary trend support rests lower at MA(25) $0.0881.
Massive Volume Surge: The 24-hour trading volume has crossed 72M+ REQ, indicating intense market liquidity and high active participation from institutional buyers and whales.
Overbought Warning: Sharp vertical price extensions indicate that the token is pushing into overbought territory, making blind chasing at local peaks highly risky due to potential FOMO.
Robust Fundamental Utility: Fundamentally, Request Network functions as a solid decentralized payment and invoicing protocol with a legitimate real-world B2B (business-to-business) use case.
Market Cap Advantage: Operating as a low-to-mid cap digital asset, REQ is highly sensitive to capital inflows, which triggers sudden exponential pumps but also steep downside volatility.
Short-Term Price Prediction: If the bulls successfully defend the $0.0936 support zone, the token is expected to launch another leg up to retest $0.1050 and $0.1150 in the coming days.
Long-Term Macro Outlook: Supported by its established payment utility, a stable broader crypto market could push REQ to break major macro resistances and target a $0.1800 to $0.2200 range by mid-2026.
Strategic Entry Advice: The most logical approach is to avoid deploying full capital at current highs; instead, accumulate in parts (DCA) between $0.0940 and $0.0910 while maintaining a strict invalidation stop-loss at $0.0870.#REQ #RequestNetwork #CryptoTechnicalAnalysis #CryptoTradingGuide
is currently leading the market as one of the top gainers, showcasing a massive bullish breakout of over +53.67% within the last 24 hours.
Current Price Action: The live token price is fluctuating around $0.0985, experiencing a healthy, normal correction after touching its 24-hour high of $0.1066.
Key Support Levels: On the technical chart, immediate short-term dynamic support is holding firmly at MA(7) $0.0936, while the primary trend support rests lower at MA(25) $0.0881.
Massive Volume Surge: The 24-hour trading volume has crossed 72M+ REQ, indicating intense market liquidity and high active participation from institutional buyers and whales.
Overbought Warning: Sharp vertical price extensions indicate that the token is pushing into overbought territory, making blind chasing at local peaks highly risky due to potential FOMO.
Robust Fundamental Utility: Fundamentally, Request Network functions as a solid decentralized payment and invoicing protocol with a legitimate real-world B2B (business-to-business) use case.
Market Cap Advantage: Operating as a low-to-mid cap digital asset, REQ is highly sensitive to capital inflows, which triggers sudden exponential pumps but also steep downside volatility.
Short-Term Price Prediction: If the bulls successfully defend the $0.0936 support zone, the token is expected to launch another leg up to retest $0.1050 and $0.1150 in the coming days.
Long-Term Macro Outlook: Supported by its established payment utility, a stable broader crypto market could push REQ to break major macro resistances and target a $0.1800 to $0.2200 range by mid-2026.
Strategic Entry Advice: The most logical approach is to avoid deploying full capital at current highs; instead, accumulate in parts (DCA) between $0.0940 and $0.0910 while maintaining a strict invalidation stop-loss at $0.0870.#REQ #RequestNetwork #CryptoTechnicalAnalysis #CryptoTradingGuide
165
·
--
📊 Today's Trending Altcoin Analysis: 🏕️ Treehouse (TREE) Market Overview
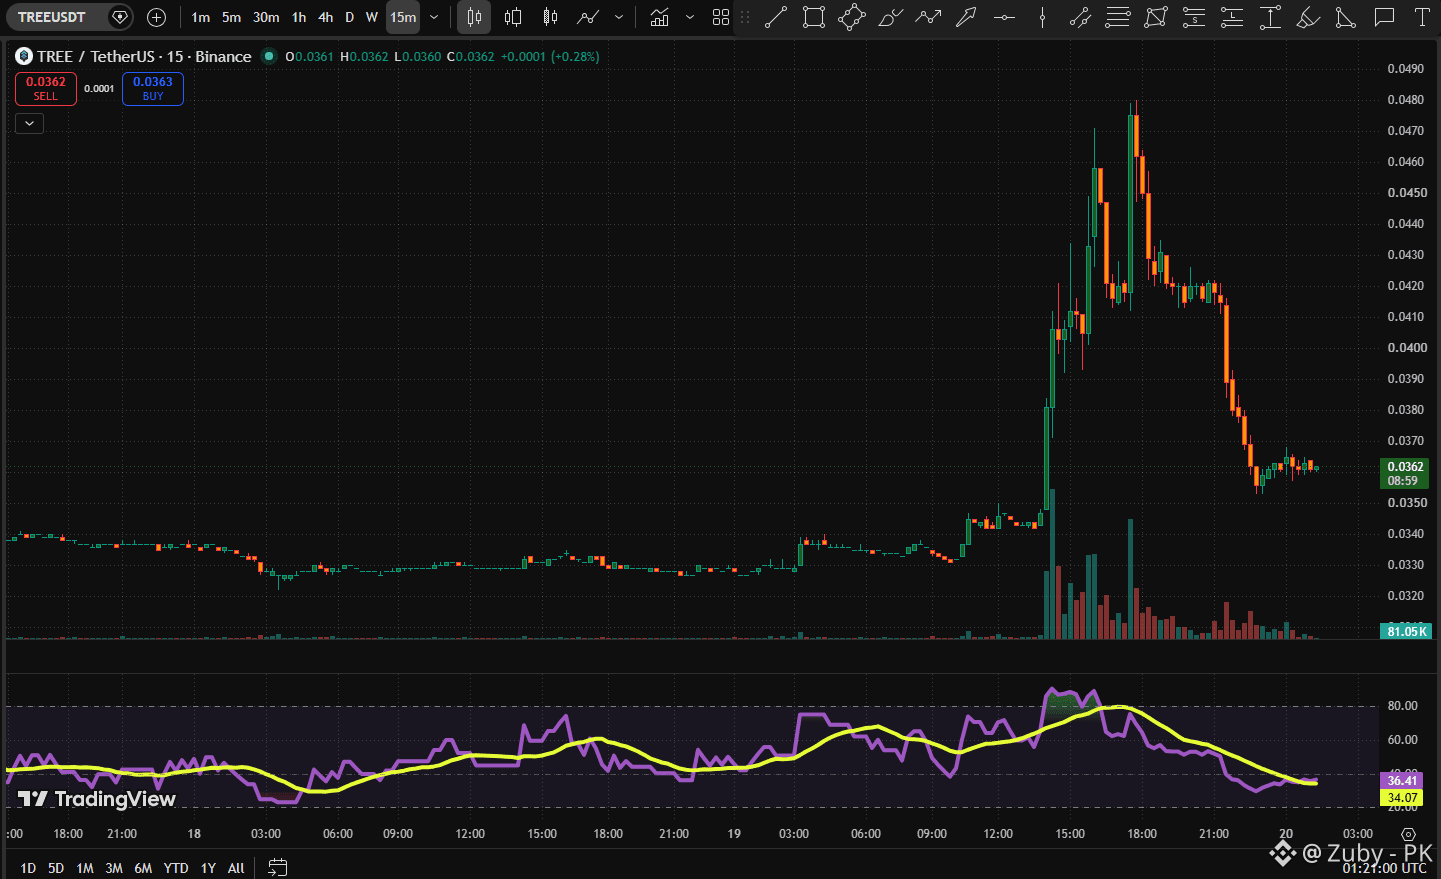
📈 Current Price: $0.03638 (+11.26% past 24h)
💧 24h Trading Volume: $74.08M
🪙 Circulating Supply: 156,122,449 TREE
🔥 Max Supply: 1,000,000,000 TREE (Deflationary)
📉 Historical Performance
📉 All-Time High (ATH): $1.62 (Jul 29, 2025) — Down -97.75%
🚀 All-Time Low (ATL): $0.05856 (Mar 28, 2026) — Up -37.88% from recent lows
📊 Technical Indicators
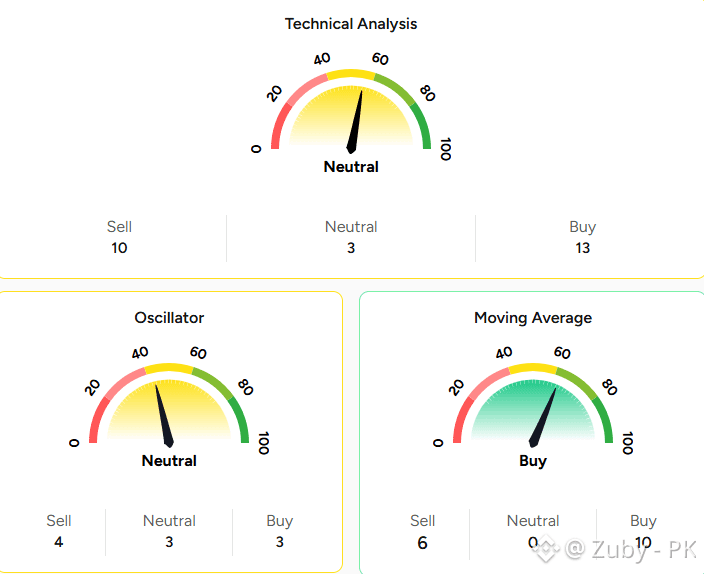
⚠️ Moving Averages: Short, medium, and long-term SMAs (5-day, 20-day, 50-day, and 200-day) are signaling bearish crossovers and extended negative momentum.
⚖️ Volatility: Neutral at 3.14% (stable price action)
🔄 RSI: 53.10 (Neutral territory)
🔻 MACD: -0.000514 (Slight downward pressure)
🐂 Stochastic K: 28.29 (Bulls zone)
✨ ROC: 1.03 (Modest positive momentum)
🌊 MFI: 84.77 (Healthy market participation)
🗣📢 Not financial advice. High volatility. Trade with risk management. DYOR ⚠️
🏷️#TreehouseCrypto #CryptoMarketAnalysis #TreehouseTREE #CryptoTechnicalAnalysis
$TREE
{spot}(TREEUSDT)
📊 Today's Trending Altcoin Analysis: 🏕️ Treehouse (TREE) Market Overview
📈 Current Price: $0.03638 (+11.26% past 24h)
💧 24h Trading Volume: $74.08M
🪙 Circulating Supply: 156,122,449 TREE
🔥 Max Supply: 1,000,000,000 TREE (Deflationary)
📉 Historical Performance
📉 All-Time High (ATH): $1.62 (Jul 29, 2025) — Down -97.75%
🚀 All-Time Low (ATL): $0.05856 (Mar 28, 2026) — Up -37.88% from recent lows
📊 Technical Indicators
⚠️ Moving Averages: Short, medium, and long-term SMAs (5-day, 20-day, 50-day, and 200-day) are signaling bearish crossovers and extended negative momentum.
⚖️ Volatility: Neutral at 3.14% (stable price action)
🔄 RSI: 53.10 (Neutral territory)
🔻 MACD: -0.000514 (Slight downward pressure)
🐂 Stochastic K: 28.29 (Bulls zone)
✨ ROC: 1.03 (Modest positive momentum)
🌊 MFI: 84.77 (Healthy market participation)
🗣📢 Not financial advice. High volatility. Trade with risk management. DYOR ⚠️
🏷️#TreehouseCrypto #CryptoMarketAnalysis #TreehouseTREE #CryptoTechnicalAnalysis
$TREE
📈 Current Price: $0.03638 (+11.26% past 24h)
💧 24h Trading Volume: $74.08M
🪙 Circulating Supply: 156,122,449 TREE
🔥 Max Supply: 1,000,000,000 TREE (Deflationary)
📉 Historical Performance
📉 All-Time High (ATH): $1.62 (Jul 29, 2025) — Down -97.75%
🚀 All-Time Low (ATL): $0.05856 (Mar 28, 2026) — Up -37.88% from recent lows
📊 Technical Indicators
⚠️ Moving Averages: Short, medium, and long-term SMAs (5-day, 20-day, 50-day, and 200-day) are signaling bearish crossovers and extended negative momentum.
⚖️ Volatility: Neutral at 3.14% (stable price action)
🔄 RSI: 53.10 (Neutral territory)
🔻 MACD: -0.000514 (Slight downward pressure)
🐂 Stochastic K: 28.29 (Bulls zone)
✨ ROC: 1.03 (Modest positive momentum)
🌊 MFI: 84.77 (Healthy market participation)
🗣📢 Not financial advice. High volatility. Trade with risk management. DYOR ⚠️
🏷️#TreehouseCrypto #CryptoMarketAnalysis #TreehouseTREE #CryptoTechnicalAnalysis
$TREE
1
2
271

·
--
#AAVERises8.9%
The Truth Behind the Surge:
$AAVE
{spot}(AAVEUSDT)
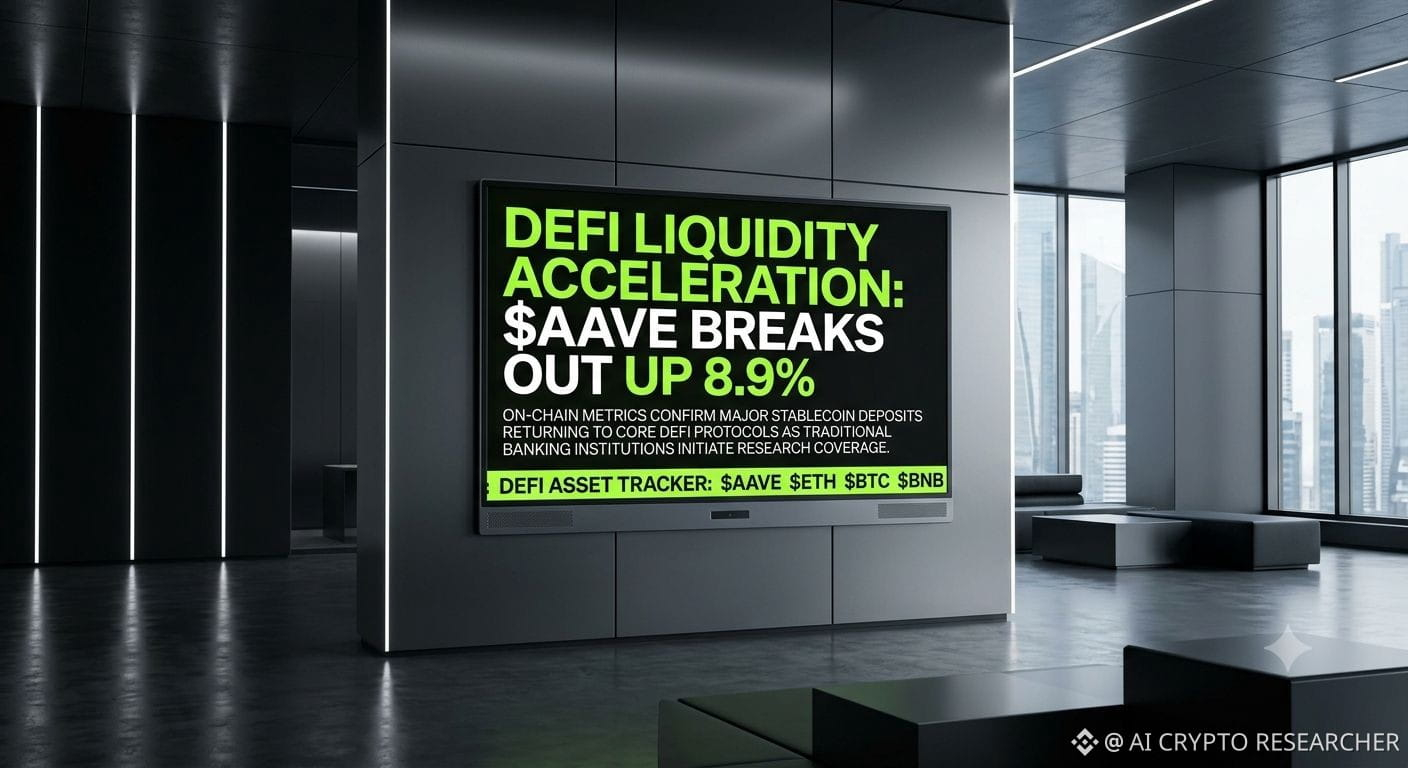
Rises 8.9%! Bull Trap or Real Growth? 👇
#AAVERises8.9% is taking over the feed, but let’s skip the hype and look at the actual reality driving this move. This isn't just random retail FOMO—real fundamental shifts are happening behind the scenes.
What is Really Happening with Aave?
Institutional Validation:
Major global financial institution Standard Chartered recently initiated coverage on Aave, setting a massive long-term target of $3,500 by 2030. They are analyzing its revenue models just like a traditional bank.
Capital Inflows:
On-chain metrics reveal massive USDT liquidity flowing back into the Aave Ethereum V3 market, significantly expanding borrowing capacity and protocol revenue.
Stronger Tokenomics & Expansion: Founder Stani Kulechov officially shut down rumors of
discounted token sales. Instead, 100% of the protocol and GHO revenue continues flowing directly to token holders via the DAO, with "Aavenomics 3.0" automated buybacks on the horizon. Plus, they just unveiled plans for V4 to bring trillions in traditional securities finance on-chain.
The Technical Reality:
AAVE has successfully broken out of a multi-month descending trendline and reclaimed the critical 50-day EMA support zone near $79-$80. The RSI is comfortably in bullish territory (around 61), proving the buyers are running the show right now.
Next critical overhead milestones to clear sit around $88 to $91.
Don’t chase green candles blindly—watch the structural liquid layers and trade with a plan.
Portals.fi
Key interconnected DeFi & Foundation layers to monitor alongside this run:
$BTC
{spot}(BTCUSDT)
$ETH
{spot}(ETHUSDT)
$BNB
#CryptoTechnicalAnalysis #CryptoTrading
#AAVERises8.9%
The Truth Behind the Surge:
$AAVE
Rises 8.9%! Bull Trap or Real Growth? 👇
#AAVERises8.9% is taking over the feed, but let’s skip the hype and look at the actual reality driving this move. This isn't just random retail FOMO—real fundamental shifts are happening behind the scenes.
What is Really Happening with Aave?
Institutional Validation:
Major global financial institution Standard Chartered recently initiated coverage on Aave, setting a massive long-term target of $3,500 by 2030. They are analyzing its revenue models just like a traditional bank.
Capital Inflows:
On-chain metrics reveal massive USDT liquidity flowing back into the Aave Ethereum V3 market, significantly expanding borrowing capacity and protocol revenue.
Stronger Tokenomics & Expansion: Founder Stani Kulechov officially shut down rumors of
discounted token sales. Instead, 100% of the protocol and GHO revenue continues flowing directly to token holders via the DAO, with "Aavenomics 3.0" automated buybacks on the horizon. Plus, they just unveiled plans for V4 to bring trillions in traditional securities finance on-chain.
The Technical Reality:
AAVE has successfully broken out of a multi-month descending trendline and reclaimed the critical 50-day EMA support zone near $79-$80. The RSI is comfortably in bullish territory (around 61), proving the buyers are running the show right now.
Next critical overhead milestones to clear sit around $88 to $91.
Don’t chase green candles blindly—watch the structural liquid layers and trade with a plan.
Portals.fi
Key interconnected DeFi & Foundation layers to monitor alongside this run:
$BTC
$ETH
$BNB
#CryptoTechnicalAnalysis #CryptoTrading
The Truth Behind the Surge:
$AAVE
Rises 8.9%! Bull Trap or Real Growth? 👇
#AAVERises8.9% is taking over the feed, but let’s skip the hype and look at the actual reality driving this move. This isn't just random retail FOMO—real fundamental shifts are happening behind the scenes.
What is Really Happening with Aave?
Institutional Validation:
Major global financial institution Standard Chartered recently initiated coverage on Aave, setting a massive long-term target of $3,500 by 2030. They are analyzing its revenue models just like a traditional bank.
Capital Inflows:
On-chain metrics reveal massive USDT liquidity flowing back into the Aave Ethereum V3 market, significantly expanding borrowing capacity and protocol revenue.
Stronger Tokenomics & Expansion: Founder Stani Kulechov officially shut down rumors of
discounted token sales. Instead, 100% of the protocol and GHO revenue continues flowing directly to token holders via the DAO, with "Aavenomics 3.0" automated buybacks on the horizon. Plus, they just unveiled plans for V4 to bring trillions in traditional securities finance on-chain.
The Technical Reality:
AAVE has successfully broken out of a multi-month descending trendline and reclaimed the critical 50-day EMA support zone near $79-$80. The RSI is comfortably in bullish territory (around 61), proving the buyers are running the show right now.
Next critical overhead milestones to clear sit around $88 to $91.
Don’t chase green candles blindly—watch the structural liquid layers and trade with a plan.
Portals.fi
Key interconnected DeFi & Foundation layers to monitor alongside this run:
$BTC
$ETH
$BNB
#CryptoTechnicalAnalysis #CryptoTrading
137
·
--

Article
Altcoins & Meme Coins Market Analysis:Top 5 Gainers, Technical Outlook,Key Trends & Trading StrategyAugust 4, 2026
🚀 Altcoins & Memecoins Market Analysis
📊 Market Overview
╰⪼ The cryptocurrency market is trading in a consolidation phase after recent volatility.
╰⪼ Bitcoin continues to dictate overall sentiment, while capital is rotating into selected altcoins and speculative meme coins.
Current Market Sentiment
🟢 Bitcoin dominance remains elevated, limiting broad altcoin rallies.
🟡 Ethereum is holding key support, helping Layer-2 and DeFi ecosystems remain stable.
🔵 AI, Real World Assets (RWA), Infrastructure, and Gaming tokens continue attracting institutional attention.
🟠 Meme coins remain highly momentum-driven with rapid capital rotation.
📈 Altcoin Market Technical Analysis
Bullish Factors
✅ Strong institutional interest in AI infrastructure
✅ Growing Layer-2 adoption
✅ Stable DeFi TVL
✅ Increased on-chain activity
Bearish Factors
❌ Bitcoin dominance still above altcoin-friendly levels
❌ Lower weekend liquidity
❌ Profit-taking after recent rallies
📊 Overall Altcoin Trend
🏆 Today's Top 5 Altcoin Gainers
SKYAI and Humanity continue benefiting from strong AI-related narratives, while Injective is seeing renewed buying interest after a technical breakout.
🐸 Today's Top 5 Meme Coin Gainers
Smaller-cap meme coins are outperforming larger names as traders rotate into high-risk assets.
📉 Technical Outlook
Altcoins
RSI: 55–65 (Bullish)
MACD: Positive crossover
Volume: Improving
Trend: Higher highs forming
Meme Coins
RSI: 65–80
Momentum: Very strong
Volatility: Extremely High
Risk: Elevated
📊 Capital Rotation
Institutional Focus
🤖 AI Tokens
⚙️ Infrastructure
🌉 Layer-2 Networks
🏦 RWA Projects
Retail Focus
🐸 Meme Coins
🎮 Gaming
🤖 AI Agents
💎 Low-cap speculative tokens
📅 Trading Strategy
Swing Traders
╰⪼ Buy quality altcoins on pullbacks. Focus on higher-volume projects.
Day Traders
╰⪼ Watch breakout levels.
╰⪼ Use tight stop-losses due to elevated volatility.
Long-Term Investors
╰⪼ Accumulate fundamentally strong AI, infrastructure, and Layer-2 projects gradually.
🔍 Key Levels to Watch
Altcoins
╰⪼ Resistance: Previous weekly highs
╰⪼Support: Recent consolidation zones
Meme Coins
╰⪼ Resistance: Intraday highs
╰⪼ Support: 20-day EMA / recent breakout levels
📌 Final Outlook
╰⪼ The market remains constructive despite consolidation.
╰⪼ Quality altcoins continue to attract institutional capital, particularly in AI and infrastructure sectors, while meme coins are benefiting from renewed speculative interest.
╰⪼ If Bitcoin remains stable, a broader altcoin expansion could follow, though traders should expect sharp volatility in meme coins and manage risk accordingly.
🔊 Not financial advice. High volatility. Trade with risk management. "DYOR" ⚠️
#CryptoTechnicalAnalysis #CryptoInvestmentInsights #CryptoPricePrediction #CryptoMarketTrends
$SKYAI $TIA $SIREN
{future}(SIRENUSDT)
{spot}(TIAUSDT)
{future}(SKYAIUSDT)
Altcoins & Meme Coins Market Analysis:Top 5 Gainers, Technical Outlook,Key Trends & Trading Strategy
August 4, 2026
🚀 Altcoins & Memecoins Market Analysis
📊 Market Overview
╰⪼ The cryptocurrency market is trading in a consolidation phase after recent volatility.
╰⪼ Bitcoin continues to dictate overall sentiment, while capital is rotating into selected altcoins and speculative meme coins.
Current Market Sentiment
🟢 Bitcoin dominance remains elevated, limiting broad altcoin rallies.
🟡 Ethereum is holding key support, helping Layer-2 and DeFi ecosystems remain stable.
🔵 AI, Real World Assets (RWA), Infrastructure, and Gaming tokens continue attracting institutional attention.
🟠 Meme coins remain highly momentum-driven with rapid capital rotation.
📈 Altcoin Market Technical Analysis
Bullish Factors
✅ Strong institutional interest in AI infrastructure
✅ Growing Layer-2 adoption
✅ Stable DeFi TVL
✅ Increased on-chain activity
Bearish Factors
❌ Bitcoin dominance still above altcoin-friendly levels
❌ Lower weekend liquidity
❌ Profit-taking after recent rallies
📊 Overall Altcoin Trend
🏆 Today's Top 5 Altcoin Gainers
SKYAI and Humanity continue benefiting from strong AI-related narratives, while Injective is seeing renewed buying interest after a technical breakout.
🐸 Today's Top 5 Meme Coin Gainers
Smaller-cap meme coins are outperforming larger names as traders rotate into high-risk assets.
📉 Technical Outlook
Altcoins
RSI: 55–65 (Bullish)
MACD: Positive crossover
Volume: Improving
Trend: Higher highs forming
Meme Coins
RSI: 65–80
Momentum: Very strong
Volatility: Extremely High
Risk: Elevated
📊 Capital Rotation
Institutional Focus
🤖 AI Tokens
⚙️ Infrastructure
🌉 Layer-2 Networks
🏦 RWA Projects
Retail Focus
🐸 Meme Coins
🎮 Gaming
🤖 AI Agents
💎 Low-cap speculative tokens
📅 Trading Strategy
Swing Traders
╰⪼ Buy quality altcoins on pullbacks. Focus on higher-volume projects.
Day Traders
╰⪼ Watch breakout levels.
╰⪼ Use tight stop-losses due to elevated volatility.
Long-Term Investors
╰⪼ Accumulate fundamentally strong AI, infrastructure, and Layer-2 projects gradually.
🔍 Key Levels to Watch
Altcoins
╰⪼ Resistance: Previous weekly highs
╰⪼Support: Recent consolidation zones
Meme Coins
╰⪼ Resistance: Intraday highs
╰⪼ Support: 20-day EMA / recent breakout levels
📌 Final Outlook
╰⪼ The market remains constructive despite consolidation.
╰⪼ Quality altcoins continue to attract institutional capital, particularly in AI and infrastructure sectors, while meme coins are benefiting from renewed speculative interest.
╰⪼ If Bitcoin remains stable, a broader altcoin expansion could follow, though traders should expect sharp volatility in meme coins and manage risk accordingly.
🔊 Not financial advice. High volatility. Trade with risk management. "DYOR" ⚠️
#CryptoTechnicalAnalysis #CryptoInvestmentInsights #CryptoPricePrediction #CryptoMarketTrends
$SKYAI $TIA $SIREN
🚀 Altcoins & Memecoins Market Analysis
📊 Market Overview
╰⪼ The cryptocurrency market is trading in a consolidation phase after recent volatility.
╰⪼ Bitcoin continues to dictate overall sentiment, while capital is rotating into selected altcoins and speculative meme coins.
Current Market Sentiment
🟢 Bitcoin dominance remains elevated, limiting broad altcoin rallies.
🟡 Ethereum is holding key support, helping Layer-2 and DeFi ecosystems remain stable.
🔵 AI, Real World Assets (RWA), Infrastructure, and Gaming tokens continue attracting institutional attention.
🟠 Meme coins remain highly momentum-driven with rapid capital rotation.
📈 Altcoin Market Technical Analysis
Bullish Factors
✅ Strong institutional interest in AI infrastructure
✅ Growing Layer-2 adoption
✅ Stable DeFi TVL
✅ Increased on-chain activity
Bearish Factors
❌ Bitcoin dominance still above altcoin-friendly levels
❌ Lower weekend liquidity
❌ Profit-taking after recent rallies
📊 Overall Altcoin Trend
🏆 Today's Top 5 Altcoin Gainers
SKYAI and Humanity continue benefiting from strong AI-related narratives, while Injective is seeing renewed buying interest after a technical breakout.
🐸 Today's Top 5 Meme Coin Gainers
Smaller-cap meme coins are outperforming larger names as traders rotate into high-risk assets.
📉 Technical Outlook
Altcoins
RSI: 55–65 (Bullish)
MACD: Positive crossover
Volume: Improving
Trend: Higher highs forming
Meme Coins
RSI: 65–80
Momentum: Very strong
Volatility: Extremely High
Risk: Elevated
📊 Capital Rotation
Institutional Focus
🤖 AI Tokens
⚙️ Infrastructure
🌉 Layer-2 Networks
🏦 RWA Projects
Retail Focus
🐸 Meme Coins
🎮 Gaming
🤖 AI Agents
💎 Low-cap speculative tokens
📅 Trading Strategy
Swing Traders
╰⪼ Buy quality altcoins on pullbacks. Focus on higher-volume projects.
Day Traders
╰⪼ Watch breakout levels.
╰⪼ Use tight stop-losses due to elevated volatility.
Long-Term Investors
╰⪼ Accumulate fundamentally strong AI, infrastructure, and Layer-2 projects gradually.
🔍 Key Levels to Watch
Altcoins
╰⪼ Resistance: Previous weekly highs
╰⪼Support: Recent consolidation zones
Meme Coins
╰⪼ Resistance: Intraday highs
╰⪼ Support: 20-day EMA / recent breakout levels
📌 Final Outlook
╰⪼ The market remains constructive despite consolidation.
╰⪼ Quality altcoins continue to attract institutional capital, particularly in AI and infrastructure sectors, while meme coins are benefiting from renewed speculative interest.
╰⪼ If Bitcoin remains stable, a broader altcoin expansion could follow, though traders should expect sharp volatility in meme coins and manage risk accordingly.
🔊 Not financial advice. High volatility. Trade with risk management. "DYOR" ⚠️
#CryptoTechnicalAnalysis #CryptoInvestmentInsights #CryptoPricePrediction #CryptoMarketTrends
$SKYAI $TIA $SIREN
4
832
·
--
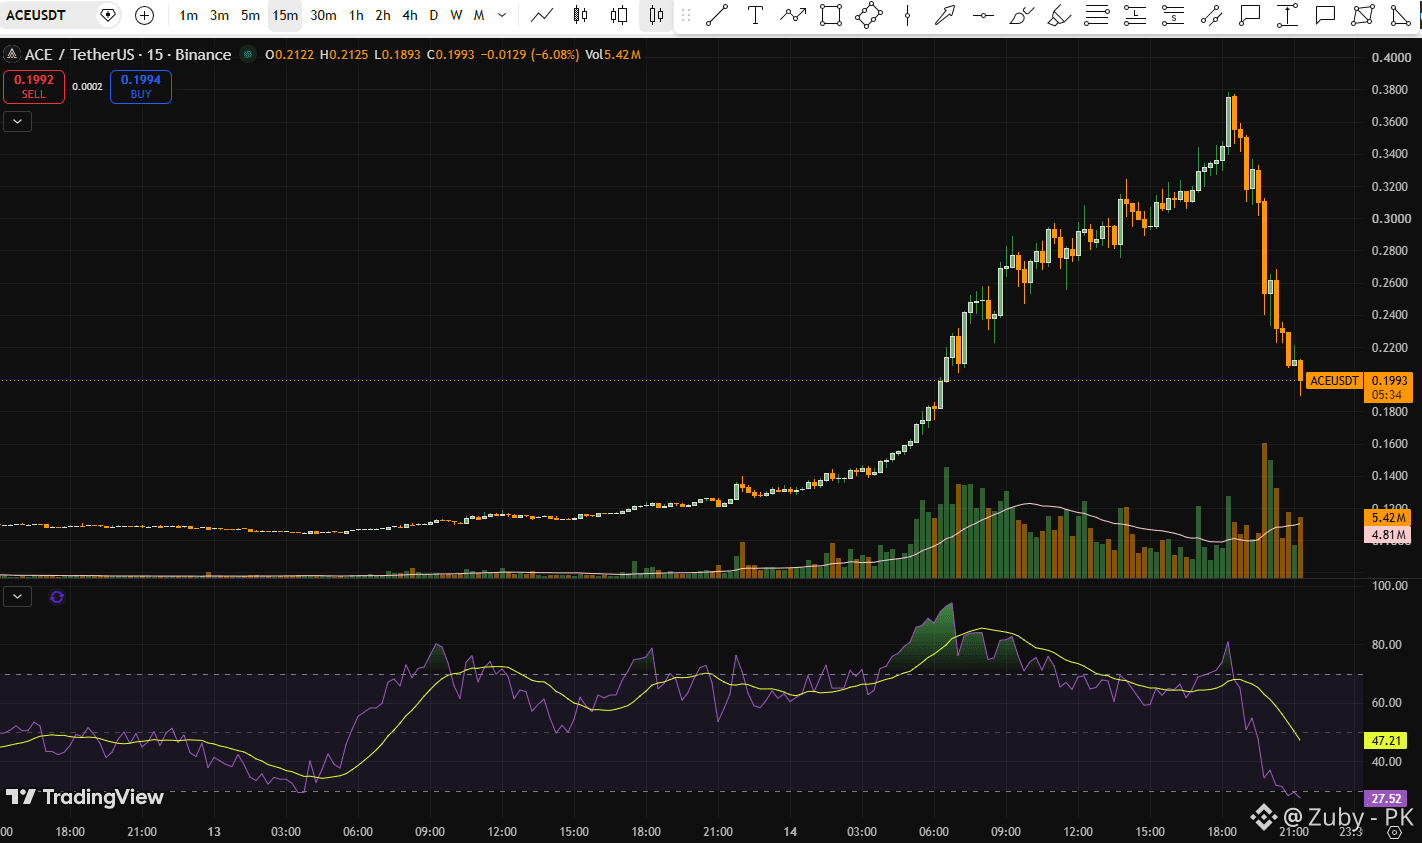
🚀 Today's Trending Altcoin Analysis: Fusionist (ACE) Market Update
Fusionist (ACE) is trading at $0.1961 with a massive 24H trading volume of $394.24M.
📈 The token dipped 23.81% in the last hour but remains 60.47% higher over the past 24 hours, showing strong volatility.
💰 Supply & Performance
🪙 Price: $0.1961
📦 Circulating Supply: 107.61M ACE🎯
Max Supply: 147M ACE (Deflationary)
🏦 24H Volume: $394.24M (Almost entirely on CEXs)
📊 Market Snapshot
🚀 ATH: $17.95 (Dec 2023)
📉 ATL: $0.1173 (Mar 2026)
🔻 98.91% below ATH
🔥 67.08% above ATL
📈 Technical Outlook
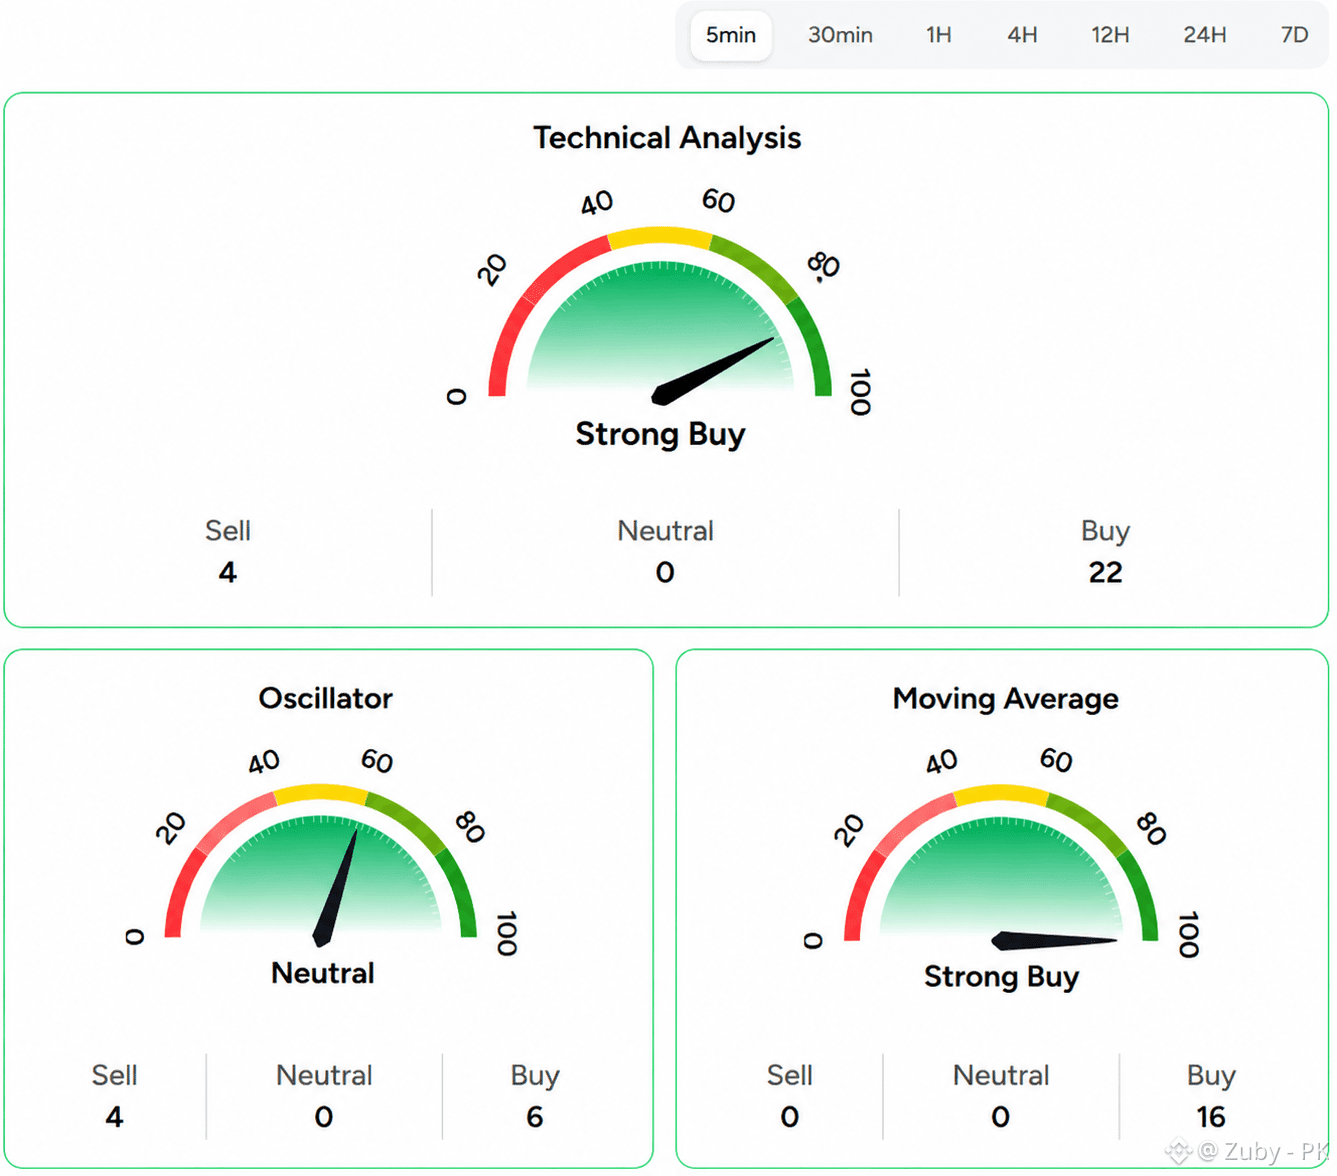
✅ Short- and medium-term SMA crossovers remain bullish, while the long-term trend is still bearish.
RSI (84.97) and MACD stay positive, with strong momentum and healthy capital inflows despite high volatility (27.90%).
🔊 Not financial advice. High volatility. Trade with risk management. DYOR ⚠️
#FusionistACE #ACEPriceUpdate #CryptoTechnicalAnalysis
$ACE
{spot}(ACEUSDT)
🚀 Today's Trending Altcoin Analysis: Fusionist (ACE) Market Update
Fusionist (ACE) is trading at $0.1961 with a massive 24H trading volume of $394.24M.
📈 The token dipped 23.81% in the last hour but remains 60.47% higher over the past 24 hours, showing strong volatility.
💰 Supply & Performance
🪙 Price: $0.1961
📦 Circulating Supply: 107.61M ACE🎯
Max Supply: 147M ACE (Deflationary)
🏦 24H Volume: $394.24M (Almost entirely on CEXs)
📊 Market Snapshot
🚀 ATH: $17.95 (Dec 2023)
📉 ATL: $0.1173 (Mar 2026)
🔻 98.91% below ATH
🔥 67.08% above ATL
📈 Technical Outlook
✅ Short- and medium-term SMA crossovers remain bullish, while the long-term trend is still bearish.
RSI (84.97) and MACD stay positive, with strong momentum and healthy capital inflows despite high volatility (27.90%).
🔊 Not financial advice. High volatility. Trade with risk management. DYOR ⚠️
#FusionistACE #ACEPriceUpdate #CryptoTechnicalAnalysis
$ACE
Fusionist (ACE) is trading at $0.1961 with a massive 24H trading volume of $394.24M.
📈 The token dipped 23.81% in the last hour but remains 60.47% higher over the past 24 hours, showing strong volatility.
💰 Supply & Performance
🪙 Price: $0.1961
📦 Circulating Supply: 107.61M ACE🎯
Max Supply: 147M ACE (Deflationary)
🏦 24H Volume: $394.24M (Almost entirely on CEXs)
📊 Market Snapshot
🚀 ATH: $17.95 (Dec 2023)
📉 ATL: $0.1173 (Mar 2026)
🔻 98.91% below ATH
🔥 67.08% above ATL
📈 Technical Outlook
✅ Short- and medium-term SMA crossovers remain bullish, while the long-term trend is still bearish.
RSI (84.97) and MACD stay positive, with strong momentum and healthy capital inflows despite high volatility (27.90%).
🔊 Not financial advice. High volatility. Trade with risk management. DYOR ⚠️
#FusionistACE #ACEPriceUpdate #CryptoTechnicalAnalysis
$ACE
1
3
385
·
--
Article
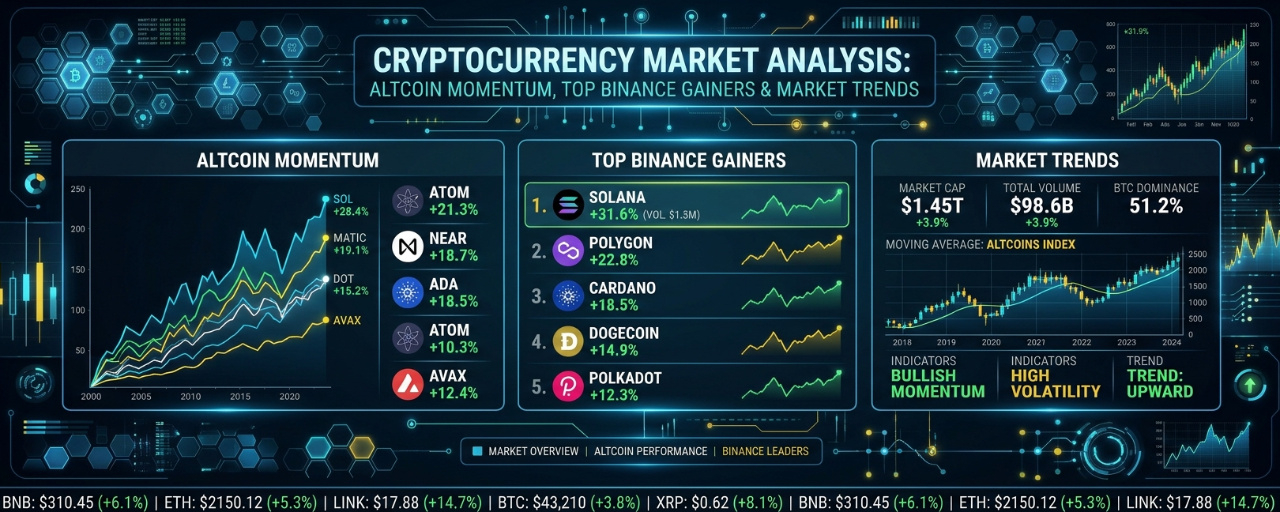
Cryptocurrency Market Analysis: Altcoin Momentum, Top Binance Gainers & Market Trends📊 🌍 Overall Crypto Market Overview
The cryptocurrency market is showing selective bullish momentum despite a slight overall market contraction, with total global market capitalization hovering around $2.4 trillion–$2.5 trillion.
While Bitcoin continues to maintain relatively stable price action around its mid-range support levels, several altcoins are experiencing impressive gains. However, the broader market has yet to demonstrate the strength required for a full-scale altcoin rally.
📈 Market Direction & Bitcoin Dominance
The Altcoin Season Index currently stands at 41/100, suggesting that the market remains in a Bitcoin-oriented or neutral phase rather than a confirmed altcoin season.
This indicates that:
Bitcoin's relative stability is helping maintain broader market confidence.Selected altcoins are outperforming due to project-specific developments and sector demand.Capital is rotating between individual narratives instead of flowing equally across the entire altcoin market.Traders are showing interest in high-growth opportunities but remain selective about risk exposure.
Market Insight: A sustained decline in Bitcoin dominance could create opportunities for altcoins. However, without stronger market-wide participation, individual rallies may struggle to maintain momentum.
🔥 Key Market Narratives Driving Capital
Several cryptocurrency sectors are attracting increased attention:
🤖 AI & DePIN Infrastructure: Projects connected to artificial intelligence, decentralized computing and infrastructure are benefiting from growing interest in emerging technologies.⚙️ Layer-1 & Layer-2 Scaling: Modular blockchain networks and rollup infrastructure, including Initia and Caldera, are attracting speculative capital as investors look for scalable blockchain ecosystems.🌉 Cross-Chain Technology: LayerZero is benefiting from continued interest in blockchain interoperability and cross-chain communication.🏦 Real-World Asset Tokenization: Tokenized financial assets and blockchain-based investment products remain important long-term market narratives.
Analysis: The current rotation suggests that traders are prioritizing projects with identifiable technology narratives rather than buying altcoins indiscriminately.
💰 Trading Volume & Liquidity Analysis
Global cryptocurrency trading volume is approximately $73B–$74B over 24 hours, indicating moderate trading activity and selective liquidity concentration.
The memecoin sector represents approximately $1.71B in daily trading volume, with a combined market capitalization of around $19.04B.
This suggests that speculative interest remains active, although liquidity is not necessarily distributed evenly across smaller tokens.
Important Observation: Rising trading volume alongside strong price appreciation can indicate growing market participation. However, traders should distinguish between genuine accumulation and short-lived speculative buying.
🚀 Top 5 Altcoin Gainers on Binance (24 Hours)
Excluding tokenized stock derivatives.
🥇 Initia (INIT)
📈 24h Change: +70.94%💵 Price: $0.29259📊 24h Volume: $157.71M🏦 Market Cap: $98.66M
Market Analysis: Initia is leading the gainers with an impressive rally. Its Layer-1 and interoperability narrative may be attracting speculative interest. The substantial trading volume indicates strong market participation.
Trading Outlook: After such a sharp increase, traders should watch for consolidation or a possible pullback. A sustained move above newly established support could indicate further upside, while declining volume may signal weakening momentum.
🥈 Harmony (ONE)
📈 24h Change: +26.23%💵 Price: $0.001776📊 24h Volume: $111.75M🏦 Market Cap: $43.98M
Market Analysis: Harmony is showing renewed buying interest after consolidating around lower price levels. Increased spot volume suggests that traders are paying attention to the potential technical recovery.
Trading Outlook: The key factor is whether ONE can maintain its breakout structure. A successful retest of previous resistance as support would strengthen the bullish outlook.
🥉 Caldera (ERA)
📈 24h Change: +15.63%💵 Price: $0.0821📊 24h Volume: $27.79M🏦 Market Cap: $36.56M
Market Analysis: Caldera is benefiting from interest in blockchain rollup infrastructure and modular scaling solutions. Its relatively small market capitalization also makes it more sensitive to changes in trading activity.
Trading Outlook: Continued volume expansion could support further upside. However, traders should monitor resistance levels and avoid chasing an extended rally.
🔹 BENQI (QI)
📈 24h Change: +12.16%💵 Price: $0.001956📊 24h Volume: $13.06M🏦 Market Cap: $14.04M
Market Analysis: BENQI is attracting attention through its connection to the Avalanche DeFi ecosystem and liquid staking sector.
Trading Outlook: Further upside may depend on sustained buying pressure and broader Avalanche ecosystem activity. Its relatively small market capitalization increases the risk of sudden price fluctuations.
🔹 LayerZero (ZRO)
📈 24h Change: +9.31%💵 Price: $1.60📊 24h Volume: $62.22M🏦 Market Cap: $1.23B
Market Analysis: LayerZero is demonstrating comparatively moderate but potentially meaningful strength. Its cross-chain messaging infrastructure provides exposure to the growing interoperability narrative.
Trading Outlook: Compared with smaller gainers, ZRO has a larger market capitalization and substantial trading activity. Traders should monitor whether buying volume continues supporting its upward movement.
🐸 Top 5 Memecoin Gainers on Binance (24 Hours)
Memecoins are showing modest positive momentum, with PEPE leading the selected gainers in both percentage appreciation and reported trading volume.
🥇 Pepe (PEPE)
📈 24h Change: +5.27%💵 Price: $0.00000539📊 24h Volume: $779.13M🏦 Market Cap: $2.23B
Market Analysis: PEPE is attracting substantial trading activity, suggesting strong speculative participation. Its high volume compared with other memecoins makes it an important indicator of sentiment within the meme sector.
Trading Outlook: Continued volume and higher price lows would support a bullish interpretation. However, sharp reversals remain possible.
🥈 Dogs (DOGS)
📈 24h Change: +4.76%💵 Price: $0.00003193📊 24h Volume: $3.57M🏦 Market Cap: $17.39M
Market Analysis: DOGS is showing a modest recovery, potentially supported by renewed interest in the TON ecosystem.
Trading Outlook: Traders should look for stronger volume confirmation before considering the move a sustainable recovery.
🥉 Niu Lai (牛来)
📈 24h Change: +4.30%💵 Price: $0.05944📊 24h Volume: $10.17M🏦 Market Cap: $59.42M
Market Analysis: The token is recording positive price action, with reported buying interest during Asian trading sessions.
Trading Outlook: Maintaining current momentum will depend on continued participation and the ability to hold recent support levels.
🔹 Act I: The AI Prophecy (ACT)
📈 24h Change: +3.54%💵 Price: $0.00965📊 24h Volume: $47.15M🏦 Market Cap: $9.15M
Market Analysis: ACT combines AI-related speculation with the memecoin narrative. This crossover can attract attention when artificial intelligence becomes a dominant market theme.
Trading Outlook: Its relatively high trading volume compared with market capitalization suggests active speculation. Traders should monitor whether buying pressure translates into sustained price appreciation.
🔹 1000*cheems.pet (1000CHEEMS)
📈 24h Change: +2.39%💵 Price: $0.000385📊 24h Volume: $1.01M🏦 Market Cap: $72.46M
Market Analysis: The token is showing a modest recovery within the traditional dog-themed memecoin category.
Trading Outlook: A stronger breakout would require increased trading volume and sustained buying interest rather than a temporary price bounce.
📉 Overall Market Outlook & Trading Strategy
The current market environment reflects selective bullishness rather than a broad cryptocurrency recovery.
For day traders, three factors deserve particular attention:
📊 Bitcoin Direction: Monitor BTC support and resistance levels because a sudden Bitcoin correction could negatively affect altcoin momentum.💹 Volume Confirmation: Look for increasing volume during upward movements. Price increases without sufficient participation may indicate weak breakouts.🎯 Support & Resistance: Identify previous breakout zones and monitor whether prices successfully retest those levels before entering trades.⚠️ Avoid FOMO: Tokens showing gains of 15%–70% within 24 hours can experience aggressive profit-taking and sudden reversals.🛡️ Risk Management: Use appropriate position sizing, predefined stop-loss levels and realistic profit targets. Avoid excessive leverage, particularly in low-cap altcoins and memecoins.
🔮 Final Market Verdict
The cryptocurrency market is currently displaying an interesting combination of Bitcoin stability, selective altcoin strength and continued speculative interest in memecoins.
Initia and Harmony are leading the selected altcoin gainers, while PEPE dominates the highlighted memecoin activity.
The Altcoin Season Index at 41/100 suggests that a widespread altcoin rally has not yet been established. For now, opportunities appear concentrated in individual projects and emerging market narratives.
The key question for traders is whether today's buying pressure develops into sustained accumulation or turns into another short-lived speculative rally.
⚠️ Risk Disclaimer: Cryptocurrency markets are highly volatile. The prices, volumes, market capitalizations and percentage changes presented above are based on the supplied market snapshot and may change rapidly. This analysis is for educational and informational purposes only and should not be considered financial or investment advice. Always conduct independent research before trading.
#CryptoMarketAnalysi #AltcoinMarketUpdate #TopAltcoinGainersToday #CryptoTechnicalAnalysis
$INIT $ONE $ERA
{spot}(ERAUSDT)
{spot}(ONEUSDT)
{spot}(INITUSDT)
Cryptocurrency Market Analysis: Altcoin Momentum, Top Binance Gainers & Market Trends
📊 🌍 Overall Crypto Market Overview
The cryptocurrency market is showing selective bullish momentum despite a slight overall market contraction, with total global market capitalization hovering around $2.4 trillion–$2.5 trillion.
While Bitcoin continues to maintain relatively stable price action around its mid-range support levels, several altcoins are experiencing impressive gains. However, the broader market has yet to demonstrate the strength required for a full-scale altcoin rally.
📈 Market Direction & Bitcoin Dominance
The Altcoin Season Index currently stands at 41/100, suggesting that the market remains in a Bitcoin-oriented or neutral phase rather than a confirmed altcoin season.
This indicates that:
Bitcoin's relative stability is helping maintain broader market confidence.Selected altcoins are outperforming due to project-specific developments and sector demand.Capital is rotating between individual narratives instead of flowing equally across the entire altcoin market.Traders are showing interest in high-growth opportunities but remain selective about risk exposure.
Market Insight: A sustained decline in Bitcoin dominance could create opportunities for altcoins. However, without stronger market-wide participation, individual rallies may struggle to maintain momentum.
🔥 Key Market Narratives Driving Capital
Several cryptocurrency sectors are attracting increased attention:
🤖 AI & DePIN Infrastructure: Projects connected to artificial intelligence, decentralized computing and infrastructure are benefiting from growing interest in emerging technologies.⚙️ Layer-1 & Layer-2 Scaling: Modular blockchain networks and rollup infrastructure, including Initia and Caldera, are attracting speculative capital as investors look for scalable blockchain ecosystems.🌉 Cross-Chain Technology: LayerZero is benefiting from continued interest in blockchain interoperability and cross-chain communication.🏦 Real-World Asset Tokenization: Tokenized financial assets and blockchain-based investment products remain important long-term market narratives.
Analysis: The current rotation suggests that traders are prioritizing projects with identifiable technology narratives rather than buying altcoins indiscriminately.
💰 Trading Volume & Liquidity Analysis
Global cryptocurrency trading volume is approximately $73B–$74B over 24 hours, indicating moderate trading activity and selective liquidity concentration.
The memecoin sector represents approximately $1.71B in daily trading volume, with a combined market capitalization of around $19.04B.
This suggests that speculative interest remains active, although liquidity is not necessarily distributed evenly across smaller tokens.
Important Observation: Rising trading volume alongside strong price appreciation can indicate growing market participation. However, traders should distinguish between genuine accumulation and short-lived speculative buying.
🚀 Top 5 Altcoin Gainers on Binance (24 Hours)
Excluding tokenized stock derivatives.
🥇 Initia (INIT)
📈 24h Change: +70.94%💵 Price: $0.29259📊 24h Volume: $157.71M🏦 Market Cap: $98.66M
Market Analysis: Initia is leading the gainers with an impressive rally. Its Layer-1 and interoperability narrative may be attracting speculative interest. The substantial trading volume indicates strong market participation.
Trading Outlook: After such a sharp increase, traders should watch for consolidation or a possible pullback. A sustained move above newly established support could indicate further upside, while declining volume may signal weakening momentum.
🥈 Harmony (ONE)
📈 24h Change: +26.23%💵 Price: $0.001776📊 24h Volume: $111.75M🏦 Market Cap: $43.98M
Market Analysis: Harmony is showing renewed buying interest after consolidating around lower price levels. Increased spot volume suggests that traders are paying attention to the potential technical recovery.
Trading Outlook: The key factor is whether ONE can maintain its breakout structure. A successful retest of previous resistance as support would strengthen the bullish outlook.
🥉 Caldera (ERA)
📈 24h Change: +15.63%💵 Price: $0.0821📊 24h Volume: $27.79M🏦 Market Cap: $36.56M
Market Analysis: Caldera is benefiting from interest in blockchain rollup infrastructure and modular scaling solutions. Its relatively small market capitalization also makes it more sensitive to changes in trading activity.
Trading Outlook: Continued volume expansion could support further upside. However, traders should monitor resistance levels and avoid chasing an extended rally.
🔹 BENQI (QI)
📈 24h Change: +12.16%💵 Price: $0.001956📊 24h Volume: $13.06M🏦 Market Cap: $14.04M
Market Analysis: BENQI is attracting attention through its connection to the Avalanche DeFi ecosystem and liquid staking sector.
Trading Outlook: Further upside may depend on sustained buying pressure and broader Avalanche ecosystem activity. Its relatively small market capitalization increases the risk of sudden price fluctuations.
🔹 LayerZero (ZRO)
📈 24h Change: +9.31%💵 Price: $1.60📊 24h Volume: $62.22M🏦 Market Cap: $1.23B
Market Analysis: LayerZero is demonstrating comparatively moderate but potentially meaningful strength. Its cross-chain messaging infrastructure provides exposure to the growing interoperability narrative.
Trading Outlook: Compared with smaller gainers, ZRO has a larger market capitalization and substantial trading activity. Traders should monitor whether buying volume continues supporting its upward movement.
🐸 Top 5 Memecoin Gainers on Binance (24 Hours)
Memecoins are showing modest positive momentum, with PEPE leading the selected gainers in both percentage appreciation and reported trading volume.
🥇 Pepe (PEPE)
📈 24h Change: +5.27%💵 Price: $0.00000539📊 24h Volume: $779.13M🏦 Market Cap: $2.23B
Market Analysis: PEPE is attracting substantial trading activity, suggesting strong speculative participation. Its high volume compared with other memecoins makes it an important indicator of sentiment within the meme sector.
Trading Outlook: Continued volume and higher price lows would support a bullish interpretation. However, sharp reversals remain possible.
🥈 Dogs (DOGS)
📈 24h Change: +4.76%💵 Price: $0.00003193📊 24h Volume: $3.57M🏦 Market Cap: $17.39M
Market Analysis: DOGS is showing a modest recovery, potentially supported by renewed interest in the TON ecosystem.
Trading Outlook: Traders should look for stronger volume confirmation before considering the move a sustainable recovery.
🥉 Niu Lai (牛来)
📈 24h Change: +4.30%💵 Price: $0.05944📊 24h Volume: $10.17M🏦 Market Cap: $59.42M
Market Analysis: The token is recording positive price action, with reported buying interest during Asian trading sessions.
Trading Outlook: Maintaining current momentum will depend on continued participation and the ability to hold recent support levels.
🔹 Act I: The AI Prophecy (ACT)
📈 24h Change: +3.54%💵 Price: $0.00965📊 24h Volume: $47.15M🏦 Market Cap: $9.15M
Market Analysis: ACT combines AI-related speculation with the memecoin narrative. This crossover can attract attention when artificial intelligence becomes a dominant market theme.
Trading Outlook: Its relatively high trading volume compared with market capitalization suggests active speculation. Traders should monitor whether buying pressure translates into sustained price appreciation.
🔹 1000*cheems.pet (1000CHEEMS)
📈 24h Change: +2.39%💵 Price: $0.000385📊 24h Volume: $1.01M🏦 Market Cap: $72.46M
Market Analysis: The token is showing a modest recovery within the traditional dog-themed memecoin category.
Trading Outlook: A stronger breakout would require increased trading volume and sustained buying interest rather than a temporary price bounce.
📉 Overall Market Outlook & Trading Strategy
The current market environment reflects selective bullishness rather than a broad cryptocurrency recovery.
For day traders, three factors deserve particular attention:
📊 Bitcoin Direction: Monitor BTC support and resistance levels because a sudden Bitcoin correction could negatively affect altcoin momentum.💹 Volume Confirmation: Look for increasing volume during upward movements. Price increases without sufficient participation may indicate weak breakouts.🎯 Support & Resistance: Identify previous breakout zones and monitor whether prices successfully retest those levels before entering trades.⚠️ Avoid FOMO: Tokens showing gains of 15%–70% within 24 hours can experience aggressive profit-taking and sudden reversals.🛡️ Risk Management: Use appropriate position sizing, predefined stop-loss levels and realistic profit targets. Avoid excessive leverage, particularly in low-cap altcoins and memecoins.
🔮 Final Market Verdict
The cryptocurrency market is currently displaying an interesting combination of Bitcoin stability, selective altcoin strength and continued speculative interest in memecoins.
Initia and Harmony are leading the selected altcoin gainers, while PEPE dominates the highlighted memecoin activity.
The Altcoin Season Index at 41/100 suggests that a widespread altcoin rally has not yet been established. For now, opportunities appear concentrated in individual projects and emerging market narratives.
The key question for traders is whether today's buying pressure develops into sustained accumulation or turns into another short-lived speculative rally.
⚠️ Risk Disclaimer: Cryptocurrency markets are highly volatile. The prices, volumes, market capitalizations and percentage changes presented above are based on the supplied market snapshot and may change rapidly. This analysis is for educational and informational purposes only and should not be considered financial or investment advice. Always conduct independent research before trading.
#CryptoMarketAnalysi #AltcoinMarketUpdate #TopAltcoinGainersToday #CryptoTechnicalAnalysis
$INIT $ONE $ERA
The cryptocurrency market is showing selective bullish momentum despite a slight overall market contraction, with total global market capitalization hovering around $2.4 trillion–$2.5 trillion.
While Bitcoin continues to maintain relatively stable price action around its mid-range support levels, several altcoins are experiencing impressive gains. However, the broader market has yet to demonstrate the strength required for a full-scale altcoin rally.
📈 Market Direction & Bitcoin Dominance
The Altcoin Season Index currently stands at 41/100, suggesting that the market remains in a Bitcoin-oriented or neutral phase rather than a confirmed altcoin season.
This indicates that:
Bitcoin's relative stability is helping maintain broader market confidence.Selected altcoins are outperforming due to project-specific developments and sector demand.Capital is rotating between individual narratives instead of flowing equally across the entire altcoin market.Traders are showing interest in high-growth opportunities but remain selective about risk exposure.
Market Insight: A sustained decline in Bitcoin dominance could create opportunities for altcoins. However, without stronger market-wide participation, individual rallies may struggle to maintain momentum.
🔥 Key Market Narratives Driving Capital
Several cryptocurrency sectors are attracting increased attention:
🤖 AI & DePIN Infrastructure: Projects connected to artificial intelligence, decentralized computing and infrastructure are benefiting from growing interest in emerging technologies.⚙️ Layer-1 & Layer-2 Scaling: Modular blockchain networks and rollup infrastructure, including Initia and Caldera, are attracting speculative capital as investors look for scalable blockchain ecosystems.🌉 Cross-Chain Technology: LayerZero is benefiting from continued interest in blockchain interoperability and cross-chain communication.🏦 Real-World Asset Tokenization: Tokenized financial assets and blockchain-based investment products remain important long-term market narratives.
Analysis: The current rotation suggests that traders are prioritizing projects with identifiable technology narratives rather than buying altcoins indiscriminately.
💰 Trading Volume & Liquidity Analysis
Global cryptocurrency trading volume is approximately $73B–$74B over 24 hours, indicating moderate trading activity and selective liquidity concentration.
The memecoin sector represents approximately $1.71B in daily trading volume, with a combined market capitalization of around $19.04B.
This suggests that speculative interest remains active, although liquidity is not necessarily distributed evenly across smaller tokens.
Important Observation: Rising trading volume alongside strong price appreciation can indicate growing market participation. However, traders should distinguish between genuine accumulation and short-lived speculative buying.
🚀 Top 5 Altcoin Gainers on Binance (24 Hours)
Excluding tokenized stock derivatives.
🥇 Initia (INIT)
📈 24h Change: +70.94%💵 Price: $0.29259📊 24h Volume: $157.71M🏦 Market Cap: $98.66M
Market Analysis: Initia is leading the gainers with an impressive rally. Its Layer-1 and interoperability narrative may be attracting speculative interest. The substantial trading volume indicates strong market participation.
Trading Outlook: After such a sharp increase, traders should watch for consolidation or a possible pullback. A sustained move above newly established support could indicate further upside, while declining volume may signal weakening momentum.
🥈 Harmony (ONE)
📈 24h Change: +26.23%💵 Price: $0.001776📊 24h Volume: $111.75M🏦 Market Cap: $43.98M
Market Analysis: Harmony is showing renewed buying interest after consolidating around lower price levels. Increased spot volume suggests that traders are paying attention to the potential technical recovery.
Trading Outlook: The key factor is whether ONE can maintain its breakout structure. A successful retest of previous resistance as support would strengthen the bullish outlook.
🥉 Caldera (ERA)
📈 24h Change: +15.63%💵 Price: $0.0821📊 24h Volume: $27.79M🏦 Market Cap: $36.56M
Market Analysis: Caldera is benefiting from interest in blockchain rollup infrastructure and modular scaling solutions. Its relatively small market capitalization also makes it more sensitive to changes in trading activity.
Trading Outlook: Continued volume expansion could support further upside. However, traders should monitor resistance levels and avoid chasing an extended rally.
🔹 BENQI (QI)
📈 24h Change: +12.16%💵 Price: $0.001956📊 24h Volume: $13.06M🏦 Market Cap: $14.04M
Market Analysis: BENQI is attracting attention through its connection to the Avalanche DeFi ecosystem and liquid staking sector.
Trading Outlook: Further upside may depend on sustained buying pressure and broader Avalanche ecosystem activity. Its relatively small market capitalization increases the risk of sudden price fluctuations.
🔹 LayerZero (ZRO)
📈 24h Change: +9.31%💵 Price: $1.60📊 24h Volume: $62.22M🏦 Market Cap: $1.23B
Market Analysis: LayerZero is demonstrating comparatively moderate but potentially meaningful strength. Its cross-chain messaging infrastructure provides exposure to the growing interoperability narrative.
Trading Outlook: Compared with smaller gainers, ZRO has a larger market capitalization and substantial trading activity. Traders should monitor whether buying volume continues supporting its upward movement.
🐸 Top 5 Memecoin Gainers on Binance (24 Hours)
Memecoins are showing modest positive momentum, with PEPE leading the selected gainers in both percentage appreciation and reported trading volume.
🥇 Pepe (PEPE)
📈 24h Change: +5.27%💵 Price: $0.00000539📊 24h Volume: $779.13M🏦 Market Cap: $2.23B
Market Analysis: PEPE is attracting substantial trading activity, suggesting strong speculative participation. Its high volume compared with other memecoins makes it an important indicator of sentiment within the meme sector.
Trading Outlook: Continued volume and higher price lows would support a bullish interpretation. However, sharp reversals remain possible.
🥈 Dogs (DOGS)
📈 24h Change: +4.76%💵 Price: $0.00003193📊 24h Volume: $3.57M🏦 Market Cap: $17.39M
Market Analysis: DOGS is showing a modest recovery, potentially supported by renewed interest in the TON ecosystem.
Trading Outlook: Traders should look for stronger volume confirmation before considering the move a sustainable recovery.
🥉 Niu Lai (牛来)
📈 24h Change: +4.30%💵 Price: $0.05944📊 24h Volume: $10.17M🏦 Market Cap: $59.42M
Market Analysis: The token is recording positive price action, with reported buying interest during Asian trading sessions.
Trading Outlook: Maintaining current momentum will depend on continued participation and the ability to hold recent support levels.
🔹 Act I: The AI Prophecy (ACT)
📈 24h Change: +3.54%💵 Price: $0.00965📊 24h Volume: $47.15M🏦 Market Cap: $9.15M
Market Analysis: ACT combines AI-related speculation with the memecoin narrative. This crossover can attract attention when artificial intelligence becomes a dominant market theme.
Trading Outlook: Its relatively high trading volume compared with market capitalization suggests active speculation. Traders should monitor whether buying pressure translates into sustained price appreciation.
🔹 1000*cheems.pet (1000CHEEMS)
📈 24h Change: +2.39%💵 Price: $0.000385📊 24h Volume: $1.01M🏦 Market Cap: $72.46M
Market Analysis: The token is showing a modest recovery within the traditional dog-themed memecoin category.
Trading Outlook: A stronger breakout would require increased trading volume and sustained buying interest rather than a temporary price bounce.
📉 Overall Market Outlook & Trading Strategy
The current market environment reflects selective bullishness rather than a broad cryptocurrency recovery.
For day traders, three factors deserve particular attention:
📊 Bitcoin Direction: Monitor BTC support and resistance levels because a sudden Bitcoin correction could negatively affect altcoin momentum.💹 Volume Confirmation: Look for increasing volume during upward movements. Price increases without sufficient participation may indicate weak breakouts.🎯 Support & Resistance: Identify previous breakout zones and monitor whether prices successfully retest those levels before entering trades.⚠️ Avoid FOMO: Tokens showing gains of 15%–70% within 24 hours can experience aggressive profit-taking and sudden reversals.🛡️ Risk Management: Use appropriate position sizing, predefined stop-loss levels and realistic profit targets. Avoid excessive leverage, particularly in low-cap altcoins and memecoins.
🔮 Final Market Verdict
The cryptocurrency market is currently displaying an interesting combination of Bitcoin stability, selective altcoin strength and continued speculative interest in memecoins.
Initia and Harmony are leading the selected altcoin gainers, while PEPE dominates the highlighted memecoin activity.
The Altcoin Season Index at 41/100 suggests that a widespread altcoin rally has not yet been established. For now, opportunities appear concentrated in individual projects and emerging market narratives.
The key question for traders is whether today's buying pressure develops into sustained accumulation or turns into another short-lived speculative rally.
⚠️ Risk Disclaimer: Cryptocurrency markets are highly volatile. The prices, volumes, market capitalizations and percentage changes presented above are based on the supplied market snapshot and may change rapidly. This analysis is for educational and informational purposes only and should not be considered financial or investment advice. Always conduct independent research before trading.
#CryptoMarketAnalysi #AltcoinMarketUpdate #TopAltcoinGainersToday #CryptoTechnicalAnalysis
$INIT $ONE $ERA
1
1
212
Log in to explore more content
Join global crypto users on Binance Square
⚡️ Get latest and useful information about crypto.
💬 Trusted by the world’s largest crypto exchange.
👍 Discover real insights from verified creators.
Email / Phone number
Trending Topics
1
#HuangRisksOusterOverReportedAffairWithSubordinate
7,517 views
136 Discussing
2
#AnthropicRejectsIPODelayValuationinQuestion
432,399 views
3,672 Discussing
3
#CoreWeaveJumps10%On168%RevenueGrowth
49,307 views
710 Discussing
4
#ZcashFallsBelow$1000ForFirstTimeSinceSeptember
25,480 views
136 Discussing
5
#CanNvidiaEarningsEaseMarketConcerns?
150,616 views
1,648 Discussing
6
#SolanaCompanyReports$3.4MQ3Revenue
102 views
5 Discussing
7
#StrategyMetaplanetLoseMSCIIndexMembership
1,390 views
46 Discussing
8
#tZEROWinsCFTCApprovalForRegulatedDerivativesExchange
169 views
8 Discussing
9
#HotCPIDecemberHikePriced
459,140 views
3,679 Discussing
10
#StablecoinSupplyDrops$14.2BIn30Days
393 views
8 Discussing