
#bnb
bnb
2G views
24.9M Discussing
Hot
Latest

·
--
Bullish
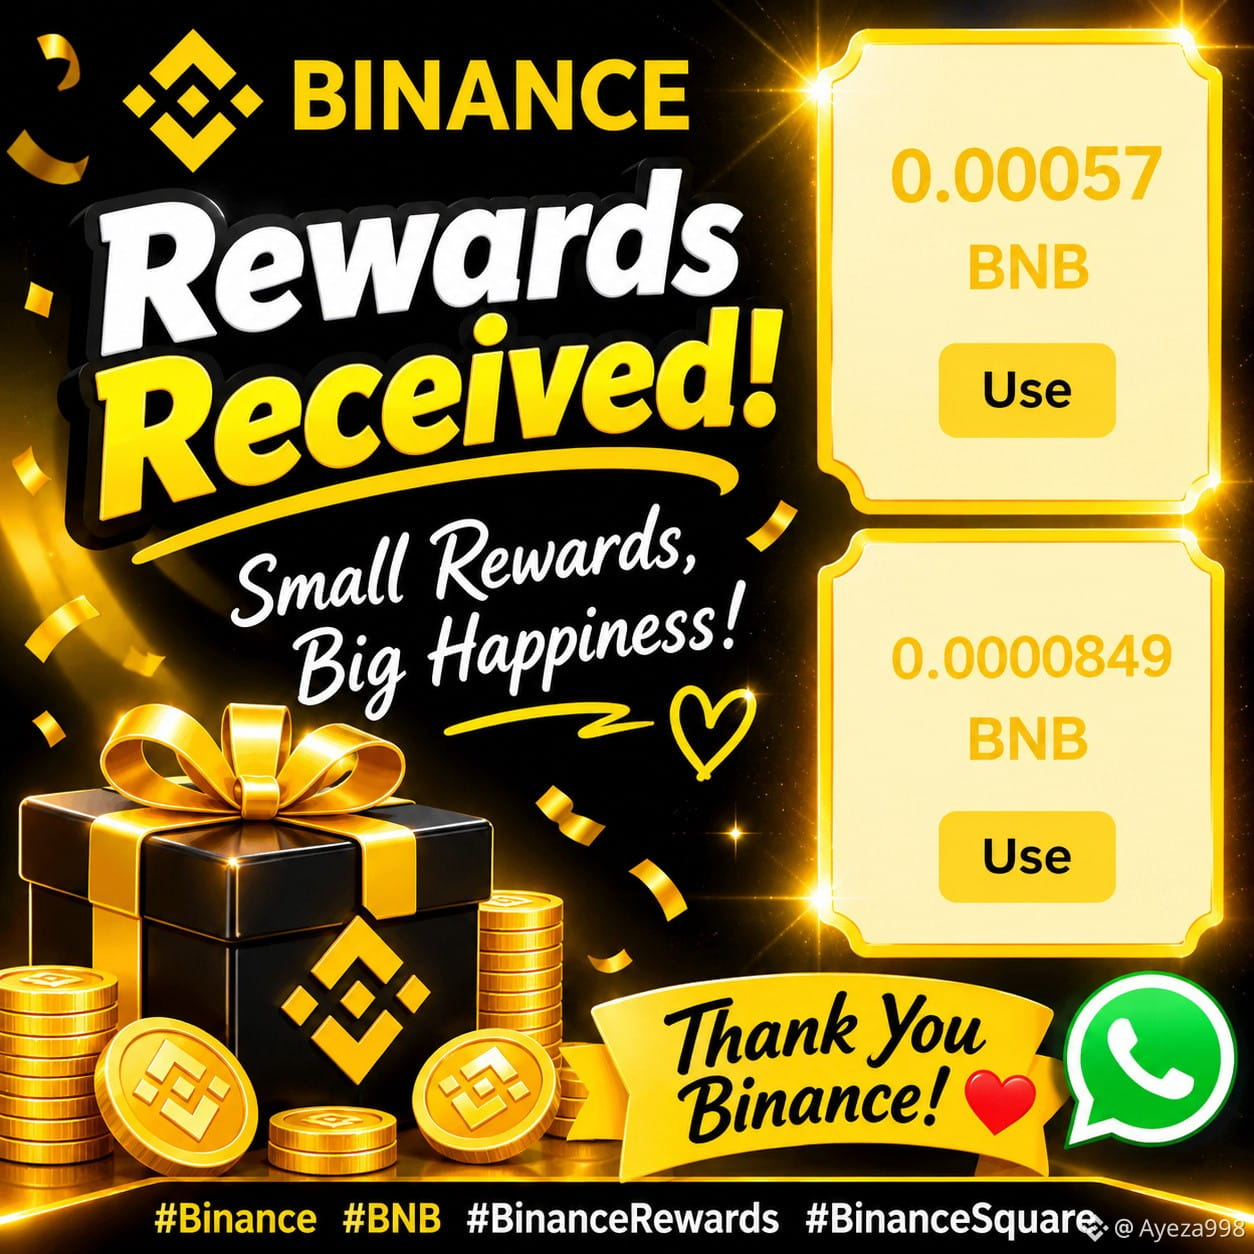
🎉 Another Binance Reward! 💛
Happy to receive two BNB token vouchers! 🥰
🟡 0.00057 BNB 🟡 0.0000849 BNB
Every little reward makes me smile! Thank you, Binance! 🚀
#Binance #BNB #BinanceRewards #BinanceSquare
$BNB
🎉 Another Binance Reward! 💛
Happy to receive two BNB token vouchers! 🥰
🟡 0.00057 BNB 🟡 0.0000849 BNB
Every little reward makes me smile! Thank you, Binance! 🚀
#Binance #BNB #BinanceRewards #BinanceSquare
$BNB
Happy to receive two BNB token vouchers! 🥰
🟡 0.00057 BNB 🟡 0.0000849 BNB
Every little reward makes me smile! Thank you, Binance! 🚀
#Binance #BNB #BinanceRewards #BinanceSquare
$BNB
HUNTER 乂:
how to get it?
1
8
1.5k


·
--
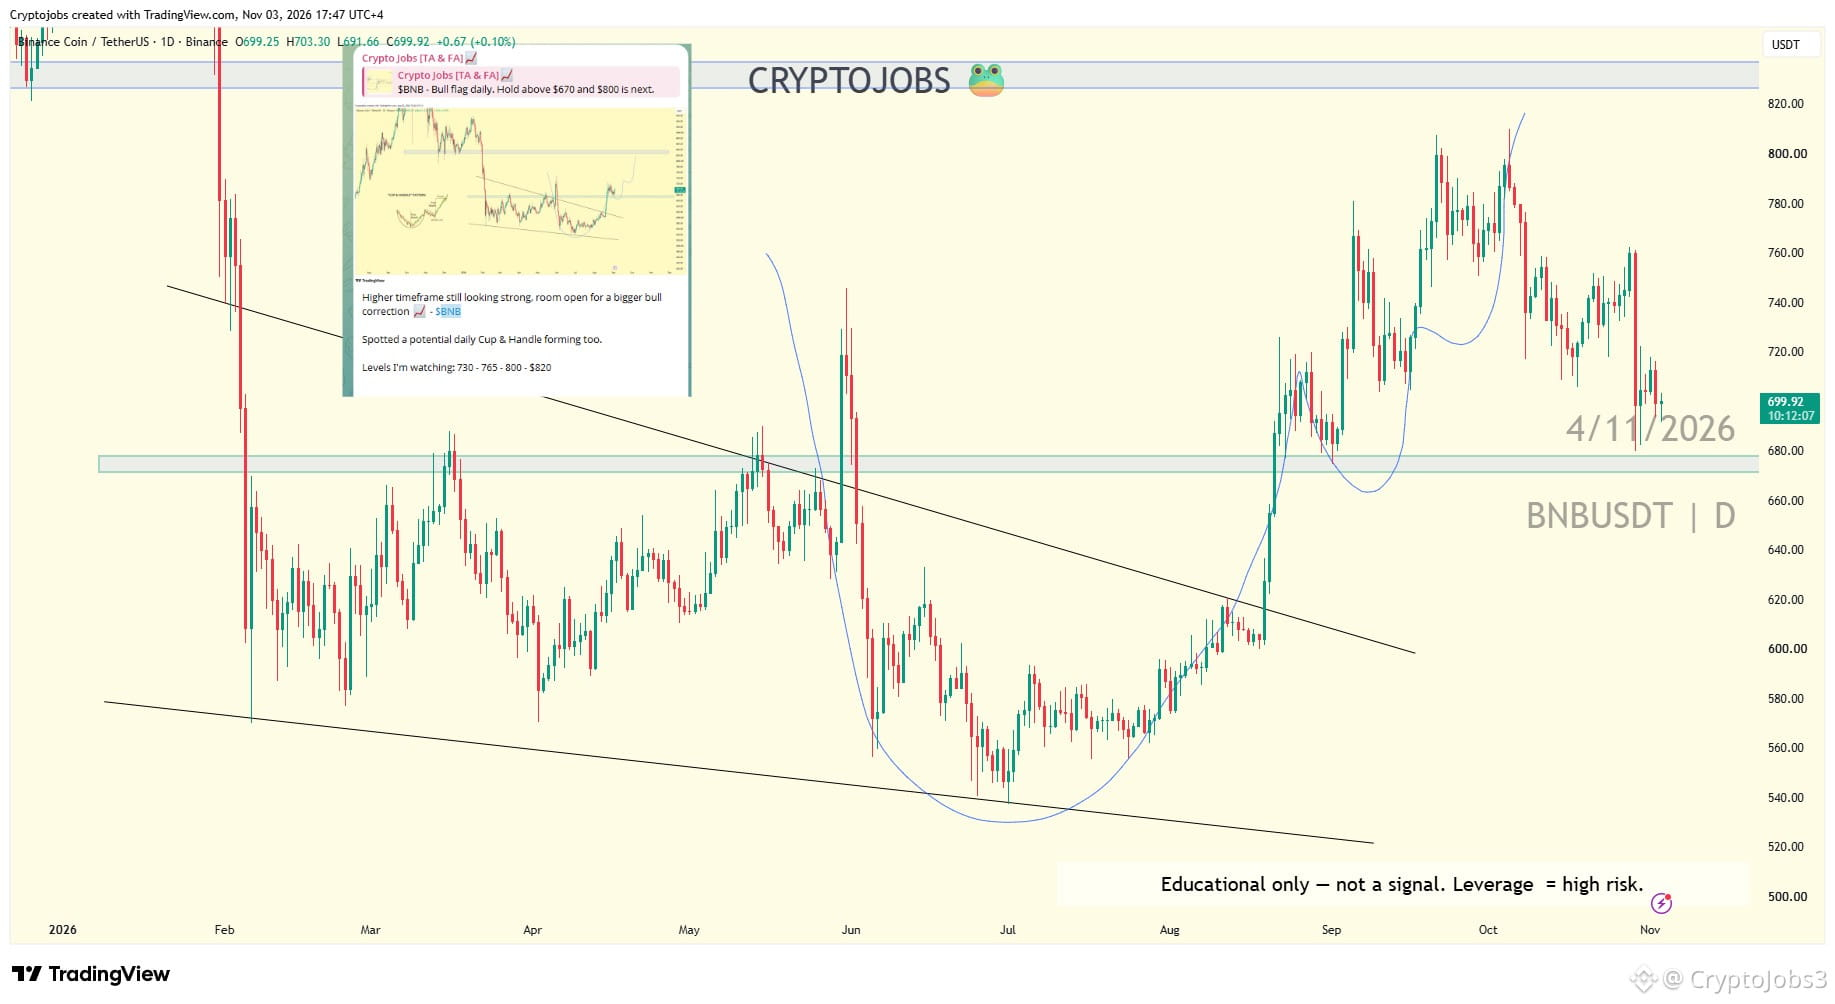
BOOM, $BNB played out 🎯
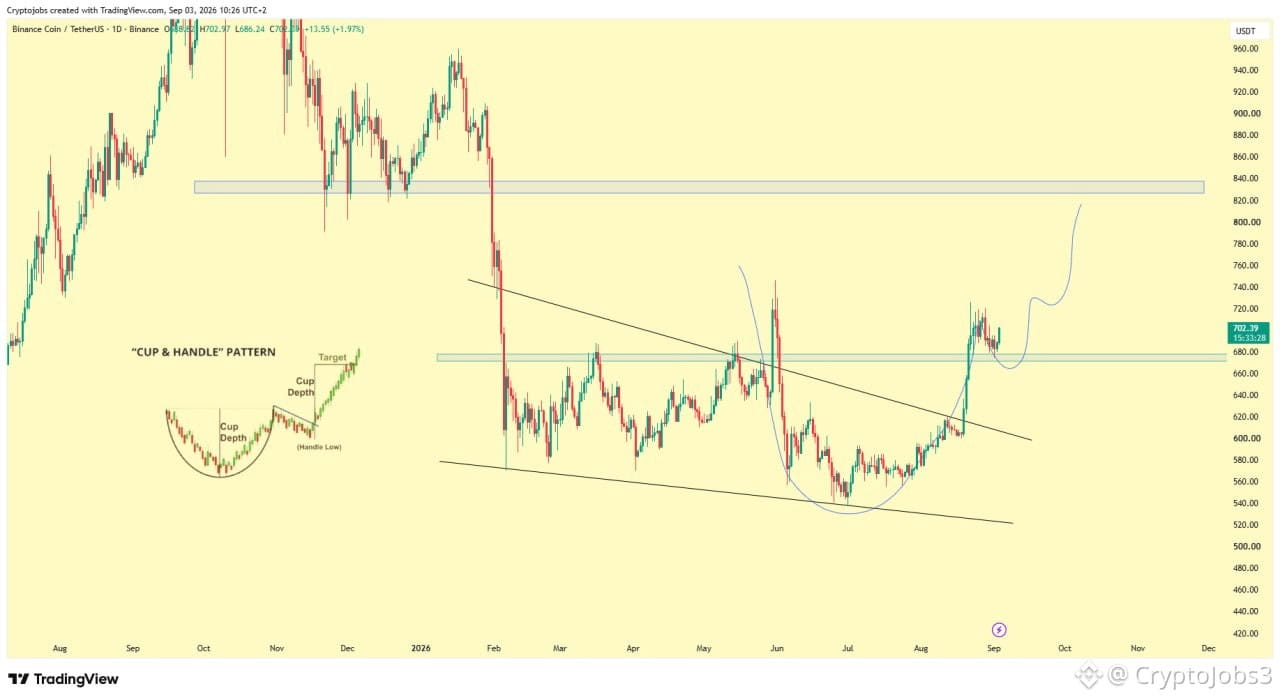
Spotted the bull flag and daily Cup & Handle on Sep 3
Holding above $670 was the key
17% setup delivered exactly, from $680 to $800
Should I update $BNB?
#BNB_Market_Update #bnb
BOOM, $BNB played out 🎯
Spotted the bull flag and daily Cup & Handle on Sep 3
Holding above $670 was the key
17% setup delivered exactly, from $680 to $800
Should I update $BNB ?
#BNB_Market_Update #bnb
Spotted the bull flag and daily Cup & Handle on Sep 3
Holding above $670 was the key
17% setup delivered exactly, from $680 to $800
Should I update $BNB ?
#BNB_Market_Update #bnb
Amir Rajpoot 贸易:
yes bro I'm BNB lover
3
9
3.7k

·
--
🚨 $BNB DIPS BELOW $690! 🚨
From $740 ➡️ $710 ➡️ $700 ➡️ Now $690
$BNB is bleeding slowly. My Price Alert just triggered.
Is this a DIP or a TRAP? 👀
Last time BNB went below $700, it pumped back to $710 within a day.
Are you BUYING this dip or WAITING for $650?
Comment your entry! 👇
#BNB #Binance #CryptoCrash #Binancesquare
{future}(BNBUSDT)
🚨 $BNB DIPS BELOW $690! 🚨
From $740 ➡️ $710 ➡️ $700 ➡️ Now $690
$BNB is bleeding slowly. My Price Alert just triggered.
Is this a DIP or a TRAP? 👀
Last time BNB went below $700, it pumped back to $710 within a day.
Are you BUYING this dip or WAITING for $650?
Comment your entry! 👇
#BNB #Binance #CryptoCrash #Binancesquare
From $740 ➡️ $710 ➡️ $700 ➡️ Now $690
$BNB is bleeding slowly. My Price Alert just triggered.
Is this a DIP or a TRAP? 👀
Last time BNB went below $700, it pumped back to $710 within a day.
Are you BUYING this dip or WAITING for $650?
Comment your entry! 👇
#BNB #Binance #CryptoCrash #Binancesquare
DrAID:
You don't understand the crypto. There's no deep.
1
468

$BNB
{spot}(BNBUSDT)
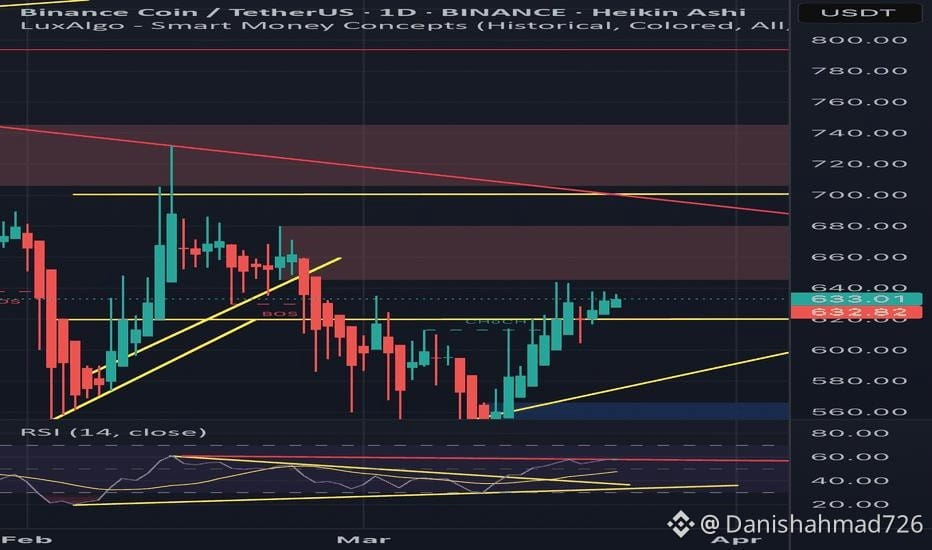
Today's BNB analysis should focus on three things: price trend, support and resistance, and trading volume. The key is to confirm whether buyers or sellers are controlling the market before entering a trade.
Technical analysis
The latest available technical readings show:
RSI (14): 47.46 – neutral to weak.
MACD: bearish signal.
Moving averages: strong sell, with 11 sell signals.
4-hour trend: downward.
Daily trend: sideways/downward.
Possible price scenarios
Bullish scenario
Break and hold above $706 could open a move toward $709–$710.
Bearish scenario
A breakdown below $694 could expose the next support near $680.
Sideways scenario
BNB may consolidate between $694 and $706.
Trading outlook
Short-term: Bearish until resistance is reclaimed.
Buy entry: Wait for confirmation above $706.
Sell/short watch: Rejection around $705–$706.
Risk management: Place a stop-loss based on your entry and timeframe.
#BinanceReopensWithdrawalsForMoreAssets #bnb #BNB_Market_Update #BNB走势 #BNBToken
$BNB
Today's BNB analysis should focus on three things: price trend, support and resistance, and trading volume. The key is to confirm whether buyers or sellers are controlling the market before entering a trade.
Technical analysis
The latest available technical readings show:
RSI (14): 47.46 – neutral to weak.
MACD: bearish signal.
Moving averages: strong sell, with 11 sell signals.
4-hour trend: downward.
Daily trend: sideways/downward.
Possible price scenarios
Bullish scenario
Break and hold above $706 could open a move toward $709–$710.
Bearish scenario
A breakdown below $694 could expose the next support near $680.
Sideways scenario
BNB may consolidate between $694 and $706.
Trading outlook
Short-term: Bearish until resistance is reclaimed.
Buy entry: Wait for confirmation above $706.
Sell/short watch: Rejection around $705–$706.
Risk management: Place a stop-loss based on your entry and timeframe.
#BinanceReopensWithdrawalsForMoreAssets #bnb #BNB_Market_Update #BNB走势 #BNBToken
Today's BNB analysis should focus on three things: price trend, support and resistance, and trading volume. The key is to confirm whether buyers or sellers are controlling the market before entering a trade.
Technical analysis
The latest available technical readings show:
RSI (14): 47.46 – neutral to weak.
MACD: bearish signal.
Moving averages: strong sell, with 11 sell signals.
4-hour trend: downward.
Daily trend: sideways/downward.
Possible price scenarios
Bullish scenario
Break and hold above $706 could open a move toward $709–$710.
Bearish scenario
A breakdown below $694 could expose the next support near $680.
Sideways scenario
BNB may consolidate between $694 and $706.
Trading outlook
Short-term: Bearish until resistance is reclaimed.
Buy entry: Wait for confirmation above $706.
Sell/short watch: Rejection around $705–$706.
Risk management: Place a stop-loss based on your entry and timeframe.
#BinanceReopensWithdrawalsForMoreAssets #bnb #BNB_Market_Update #BNB走势 #BNBToken
1
162

Tom Lee's Bitmine just bought another 5,000 ETH ($11.2M) — now holds 6.065M ETH, ~5% of supply — as ZachXBT flags a $133M crypto theft at a French bank. Risk-off anyway: $BNB -1.6% at 686.7, through yesterday's 690.65 low to 679.51 — lowest since the Oct-29 crash. Lower highs 716.7>714.9>701.7>698.2 cap every bounce; RSI 35, sell candles 6.6x buy volume. FOMO tape thin: $FLOAT $5K buy, $SI position $29K.
Which breaks first: 679.5 or 698.2?
#BNB #Crypto #Trading #writetoearn #cryptoniteuae
DYOR | NFA
Tom Lee's Bitmine just bought another 5,000 ETH ($11.2M) — now holds 6.065M ETH, ~5% of supply — as ZachXBT flags a $133M crypto theft at a French bank. Risk-off anyway: $BNB -1.6% at 686.7, through yesterday's 690.65 low to 679.51 — lowest since the Oct-29 crash. Lower highs 716.7>714.9>701.7>698.2 cap every bounce; RSI 35, sell candles 6.6x buy volume. FOMO tape thin: $FLOAT $5K buy, $SI position $29K.
Which breaks first: 679.5 or 698.2?
#BNB #Crypto #Trading #writetoearn #cryptoniteuae
DYOR | NFA
Which breaks first: 679.5 or 698.2?
#BNB #Crypto #Trading #writetoearn #cryptoniteuae
DYOR | NFA
3
614

·
--
Hey millionaire let's trade 👋
📈 SOL | ETH | BNB LONG SETUPS ‼️🤝♥️
Sharing the planned entry zones, risk levels, and target areas below. Crypto markets can move quickly—use independent risk management and verify prices before acting.
$SOL
{spot}(SOLUSDT)
SOL LONG
Entry Zone: 91.50 – 93.05
Risk Level: 89.62
🎯 Target 1: 93.93
🎯 Target 2: 94.90
🎯 Target 3: 96.00
🎯 Target 4: 98.00
$ETH
{spot}(ETHUSDT)
ETH LONG
Entry Zone: 2,228.00 – 2,299.17
Risk Level: 2,184.73
🎯 Target 1: 2,309.00
🎯 Target 2: 2,354.16
🎯 Target 3: 2,375.00
🎯 Target 4: 2,400.00
$BNB
{spot}(BNBUSDT)
BNB LONG
Entry Zone: 688.99 – 700.96
Risk Level: 672.55
🎯 Target 1: 703.30
🎯 Target 2: 720.00
🎯 Target 3: 740.00#bnb #zec
Hey millionaire let's trade 👋
📈 SOL | ETH | BNB LONG SETUPS ‼️🤝♥️
Sharing the planned entry zones, risk levels, and target areas below. Crypto markets can move quickly—use independent risk management and verify prices before acting.
$SOL
SOL LONG
Entry Zone: 91.50 – 93.05
Risk Level: 89.62
🎯 Target 1: 93.93
🎯 Target 2: 94.90
🎯 Target 3: 96.00
🎯 Target 4: 98.00
$ETH
ETH LONG
Entry Zone: 2,228.00 – 2,299.17
Risk Level: 2,184.73
🎯 Target 1: 2,309.00
🎯 Target 2: 2,354.16
🎯 Target 3: 2,375.00
🎯 Target 4: 2,400.00
$BNB
BNB LONG
Entry Zone: 688.99 – 700.96
Risk Level: 672.55
🎯 Target 1: 703.30
🎯 Target 2: 720.00
🎯 Target 3: 740.00#bnb #zec
📈 SOL | ETH | BNB LONG SETUPS ‼️🤝♥️
Sharing the planned entry zones, risk levels, and target areas below. Crypto markets can move quickly—use independent risk management and verify prices before acting.
$SOL
SOL LONG
Entry Zone: 91.50 – 93.05
Risk Level: 89.62
🎯 Target 1: 93.93
🎯 Target 2: 94.90
🎯 Target 3: 96.00
🎯 Target 4: 98.00
$ETH
ETH LONG
Entry Zone: 2,228.00 – 2,299.17
Risk Level: 2,184.73
🎯 Target 1: 2,309.00
🎯 Target 2: 2,354.16
🎯 Target 3: 2,375.00
🎯 Target 4: 2,400.00
$BNB
BNB LONG
Entry Zone: 688.99 – 700.96
Risk Level: 672.55
🎯 Target 1: 703.30
🎯 Target 2: 720.00
🎯 Target 3: 740.00#bnb #zec
88

·
--
$BNB
{future}(BNBUSDT)
is trading at 699.98, up 0.60% today, after a sharp drop and recovery on the 15m chart 📈
Chart levels I'm watching:
🔴 Resistance: 702.22 – 703.30 (chart high and 24h high)
🟢 Support: 694.77 – 691.72 (recovery zone and BOLL midline)
🟡 Key level: 680.74 (24h low, tested twice)
Price slid from around 702 to 680.74, printing two long lower wicks on heavy red volume. Buyers stepped in both times and pushed price back up in a V-shape. This is also the same 680 zone that held as the swing low on the daily chart.
Right now price is sitting at the upper Bollinger band (699.89), so the short-term move looks stretched and a small pause wouldn't be unusual. Volume on the bounce is lighter than on the selloff, which is worth watching.
A clean break and hold above 703 would show real strength. Losing 691 would put the recovery in doubt.
Do you think BNB holds 680 or comes back to retest it? 👇
#USOctoberNFP-AreRateCutsStillPossible #USMidterms-WhatAreMarketsExpecting? #bnb
Chart-based observation only, not financial advice. NFA, manage
$BNB
is trading at 699.98, up 0.60% today, after a sharp drop and recovery on the 15m chart 📈
Chart levels I'm watching:
🔴 Resistance: 702.22 – 703.30 (chart high and 24h high)
🟢 Support: 694.77 – 691.72 (recovery zone and BOLL midline)
🟡 Key level: 680.74 (24h low, tested twice)
Price slid from around 702 to 680.74, printing two long lower wicks on heavy red volume. Buyers stepped in both times and pushed price back up in a V-shape. This is also the same 680 zone that held as the swing low on the daily chart.
Right now price is sitting at the upper Bollinger band (699.89), so the short-term move looks stretched and a small pause wouldn't be unusual. Volume on the bounce is lighter than on the selloff, which is worth watching.
A clean break and hold above 703 would show real strength. Losing 691 would put the recovery in doubt.
Do you think BNB holds 680 or comes back to retest it? 👇
#USOctoberNFP-AreRateCutsStillPossible #USMidterms-WhatAreMarketsExpecting? #bnb
Chart-based observation only, not financial advice. NFA, manage
is trading at 699.98, up 0.60% today, after a sharp drop and recovery on the 15m chart 📈
Chart levels I'm watching:
🔴 Resistance: 702.22 – 703.30 (chart high and 24h high)
🟢 Support: 694.77 – 691.72 (recovery zone and BOLL midline)
🟡 Key level: 680.74 (24h low, tested twice)
Price slid from around 702 to 680.74, printing two long lower wicks on heavy red volume. Buyers stepped in both times and pushed price back up in a V-shape. This is also the same 680 zone that held as the swing low on the daily chart.
Right now price is sitting at the upper Bollinger band (699.89), so the short-term move looks stretched and a small pause wouldn't be unusual. Volume on the bounce is lighter than on the selloff, which is worth watching.
A clean break and hold above 703 would show real strength. Losing 691 would put the recovery in doubt.
Do you think BNB holds 680 or comes back to retest it? 👇
#USOctoberNFP-AreRateCutsStillPossible #USMidterms-WhatAreMarketsExpecting? #bnb
Chart-based observation only, not financial advice. NFA, manage
218

🔥 $BNB /USDT: BEARS IN CONTROL — CRITICAL SUPPORT UNDER PRESSURE!
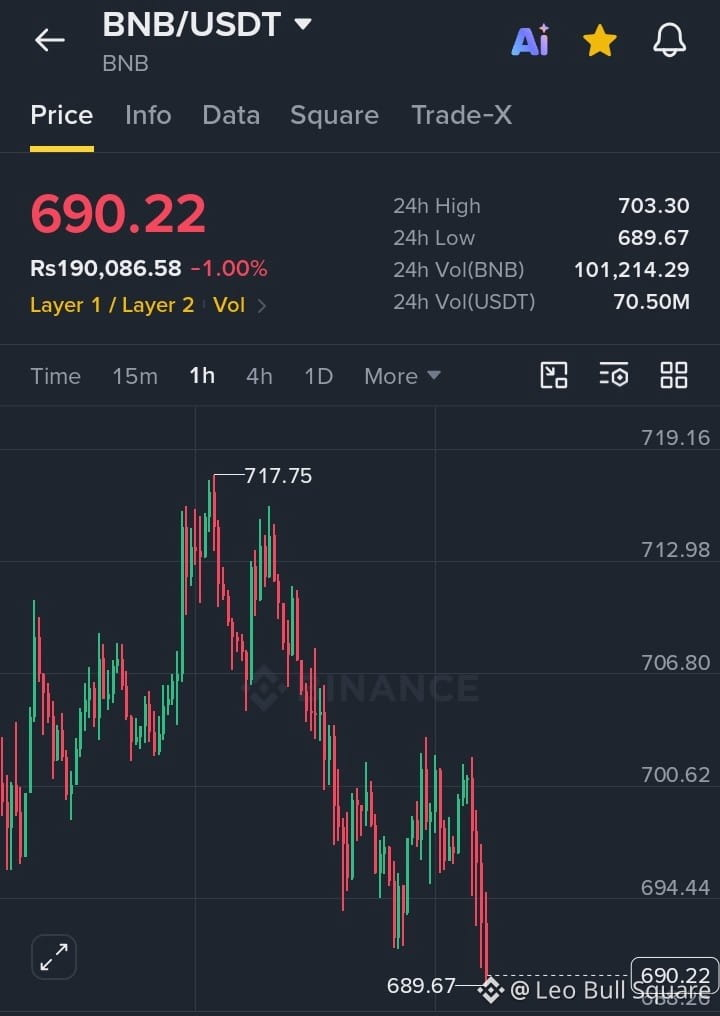
$BNB is showing strong bearish momentum on the 1H timeframe after facing rejection from the $717.75 high, forming a clear sequence of lower highs and lower lows. Currently trading at $690.22 (-1.00%), price is testing the critical support zone around $689.67–$688.26, with sellers maintaining control. A confirmed breakdown below $688.26 could trigger another downside move, while a recovery above $694.44 may offer the first sign of a short-term bullish reversal, with $700.62 acting as the next key resistance. With 24H trading volume reaching $70.50M USDT, traders should watch for a decisive candle close and volume confirmation before entering. Will BNB break support or deliver a relief bounce?
#bnb
{spot}(BNBUSDT)
🔥 $BNB /USDT: BEARS IN CONTROL — CRITICAL SUPPORT UNDER PRESSURE!
$BNB is showing strong bearish momentum on the 1H timeframe after facing rejection from the $717.75 high, forming a clear sequence of lower highs and lower lows. Currently trading at $690.22 (-1.00%), price is testing the critical support zone around $689.67–$688.26, with sellers maintaining control. A confirmed breakdown below $688.26 could trigger another downside move, while a recovery above $694.44 may offer the first sign of a short-term bullish reversal, with $700.62 acting as the next key resistance. With 24H trading volume reaching $70.50M USDT, traders should watch for a decisive candle close and volume confirmation before entering. Will BNB break support or deliver a relief bounce?
#bnb
$BNB is showing strong bearish momentum on the 1H timeframe after facing rejection from the $717.75 high, forming a clear sequence of lower highs and lower lows. Currently trading at $690.22 (-1.00%), price is testing the critical support zone around $689.67–$688.26, with sellers maintaining control. A confirmed breakdown below $688.26 could trigger another downside move, while a recovery above $694.44 may offer the first sign of a short-term bullish reversal, with $700.62 acting as the next key resistance. With 24H trading volume reaching $70.50M USDT, traders should watch for a decisive candle close and volume confirmation before entering. Will BNB break support or deliver a relief bounce?
#bnb
1
95
·
--
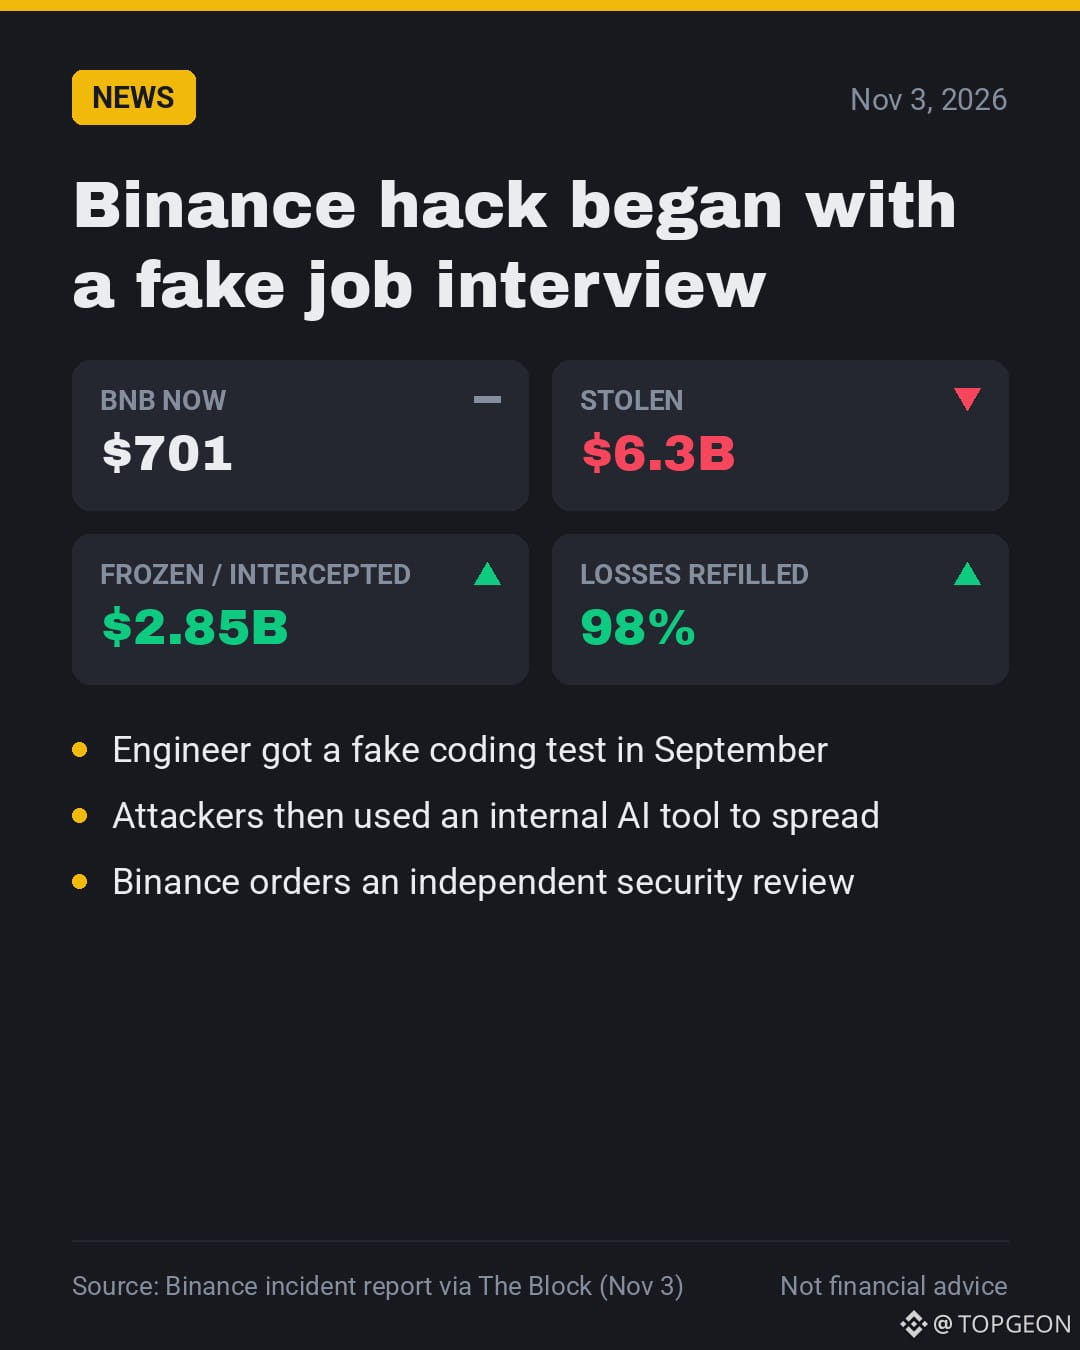
🕵️ The $6.3B $BNB hack started with a fake job interview.
📰 An engineer opened a "coding test" that hid malware, Binance's new report says.
🤔 Why it matters: the hackers never needed a single private key.
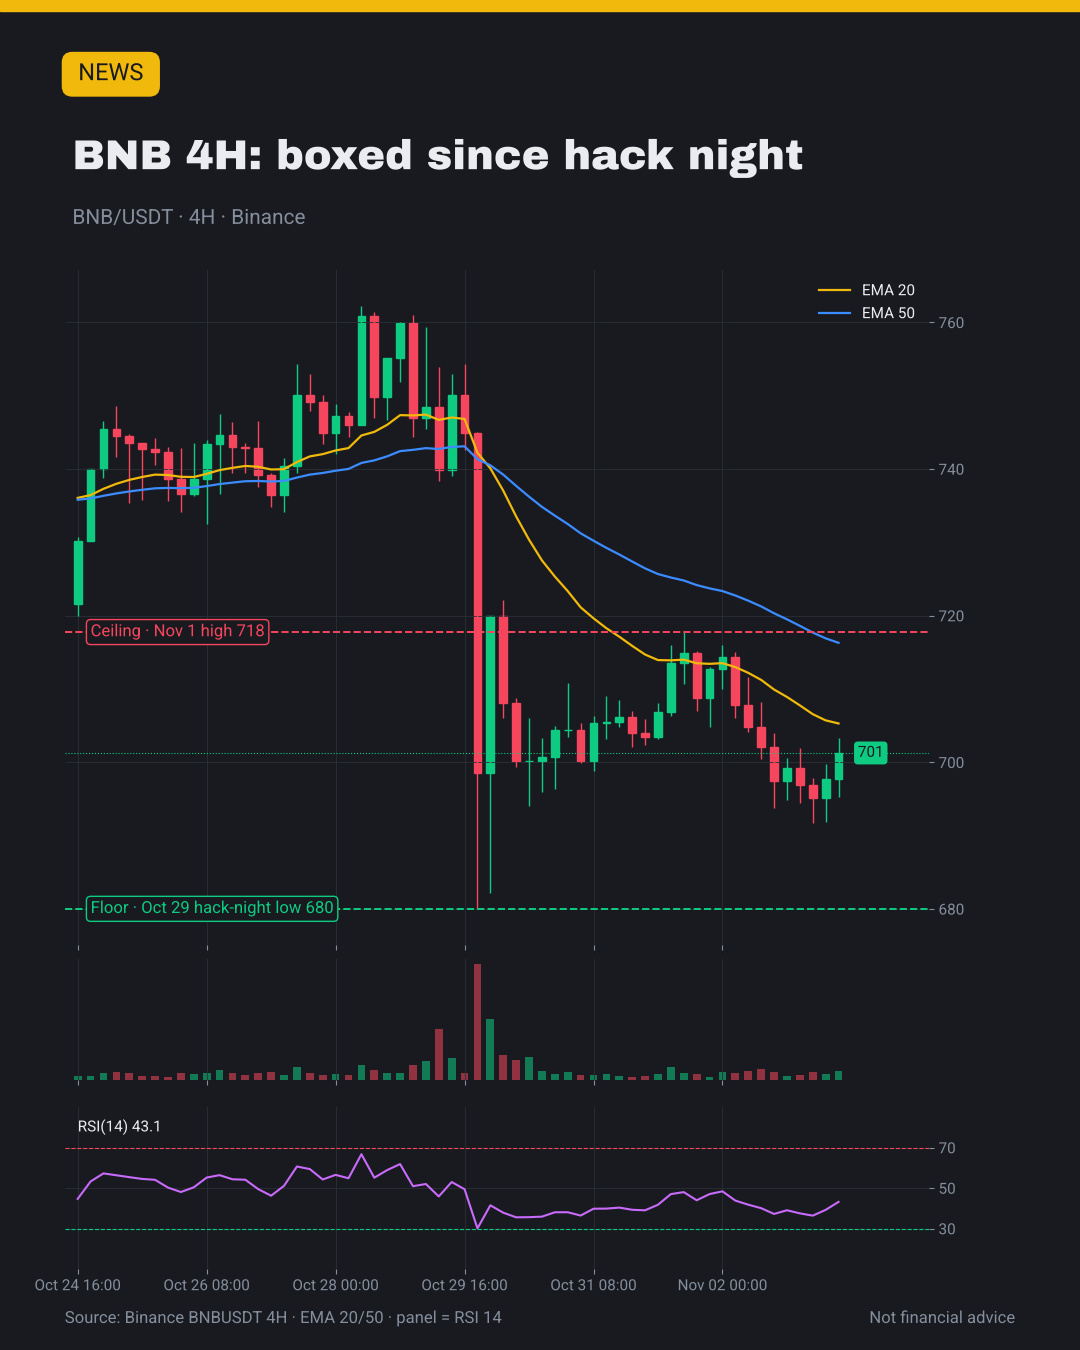
👀 BNB sits near $700, still boxed since hack night.
🎯 My take: a full report calms nerves more than any bounce.
💬 Would you have spotted the fake interview? 👇
#BinanceIncidentReport #BNB
🕵️ The $6.3B $BNB hack started with a fake job interview.
📰 An engineer opened a "coding test" that hid malware, Binance's new report says.
🤔 Why it matters: the hackers never needed a single private key.
👀 BNB sits near $700, still boxed since hack night.
🎯 My take: a full report calms nerves more than any bounce.
💬 Would you have spotted the fake interview? 👇
#BinanceIncidentReport #BNB
📰 An engineer opened a "coding test" that hid malware, Binance's new report says.
🤔 Why it matters: the hackers never needed a single private key.
👀 BNB sits near $700, still boxed since hack night.
🎯 My take: a full report calms nerves more than any bounce.
💬 Would you have spotted the fake interview? 👇
#BinanceIncidentReport #BNB
843

⚡ $BNB SURGES AFTER HARD TEST – SMART MONEY RECLAIMS THE HIGH 📈
The recent 4H candle carved a clean liquidity void below the 260‑level, forcing a sharp sell‑off that was instantly gobbled by a hidden order block at 262.5. 📊 Smart money cleared the deficit and now retests the demand zone with volume accelerating on the 1H timeframe.
A bullish divergence on the RSI and a tightening range suggest the next wave will target the prior swing high near 275, while the stop sits just under the broken low at 259. 💡 Institutional players are re‑establishing the imbalance, rewarding disciplined holders. 💬 Are you still holding or waiting for the next liquidity sweep? 👇
⚠️ Not financial advice. Always manage your risk. 🛡️
🏷️ #BNB #LongSetup #LiquiditySweep #SmartMoney #Crypto
🦈 🚀
⚡ $BNB SURGES AFTER HARD TEST – SMART MONEY RECLAIMS THE HIGH 📈
The recent 4H candle carved a clean liquidity void below the 260‑level, forcing a sharp sell‑off that was instantly gobbled by a hidden order block at 262.5. 📊 Smart money cleared the deficit and now retests the demand zone with volume accelerating on the 1H timeframe.
A bullish divergence on the RSI and a tightening range suggest the next wave will target the prior swing high near 275, while the stop sits just under the broken low at 259. 💡 Institutional players are re‑establishing the imbalance, rewarding disciplined holders. 💬 Are you still holding or waiting for the next liquidity sweep? 👇
⚠️ Not financial advice. Always manage your risk. 🛡️
🏷️ #BNB #LongSetup #LiquiditySweep #SmartMoney #Crypto
🦈 🚀
The recent 4H candle carved a clean liquidity void below the 260‑level, forcing a sharp sell‑off that was instantly gobbled by a hidden order block at 262.5. 📊 Smart money cleared the deficit and now retests the demand zone with volume accelerating on the 1H timeframe.
A bullish divergence on the RSI and a tightening range suggest the next wave will target the prior swing high near 275, while the stop sits just under the broken low at 259. 💡 Institutional players are re‑establishing the imbalance, rewarding disciplined holders. 💬 Are you still holding or waiting for the next liquidity sweep? 👇
⚠️ Not financial advice. Always manage your risk. 🛡️
🏷️ #BNB #LongSetup #LiquiditySweep #SmartMoney #Crypto
🦈 🚀

🚀 $BNB SURGES AFTER DRASTIC RED ACCOUNT REBOUND! 💥
📊 After watching a red‑inked account teeter on the edge of a stop‑loss, the market flipped and BNB roared back, turning panic into pure profit. ⚡ The overnight volume spike on a top‑tier exchange signals smart‑money stepping in, draining the last of the sell pressure and locking in a clean upside swing. 💰 Patience and discipline paid off, proving that the strongest hands thrive when everyone else is fleeing the chaos.
💬 Are you still holding tight or already riding the next wave? 👇
⚠️ Not financial advice. Always manage your risk. 🛡️
🏷️ #BNB #LongSetup #Momentum #Crypto
🔥 💎
🚀 $BNB SURGES AFTER DRASTIC RED ACCOUNT REBOUND! 💥
📊 After watching a red‑inked account teeter on the edge of a stop‑loss, the market flipped and BNB roared back, turning panic into pure profit. ⚡ The overnight volume spike on a top‑tier exchange signals smart‑money stepping in, draining the last of the sell pressure and locking in a clean upside swing. 💰 Patience and discipline paid off, proving that the strongest hands thrive when everyone else is fleeing the chaos.
💬 Are you still holding tight or already riding the next wave? 👇
⚠️ Not financial advice. Always manage your risk. 🛡️
🏷️ #BNB #LongSetup #Momentum #Crypto
🔥 💎
📊 After watching a red‑inked account teeter on the edge of a stop‑loss, the market flipped and BNB roared back, turning panic into pure profit. ⚡ The overnight volume spike on a top‑tier exchange signals smart‑money stepping in, draining the last of the sell pressure and locking in a clean upside swing. 💰 Patience and discipline paid off, proving that the strongest hands thrive when everyone else is fleeing the chaos.
💬 Are you still holding tight or already riding the next wave? 👇
⚠️ Not financial advice. Always manage your risk. 🛡️
🏷️ #BNB #LongSetup #Momentum #Crypto
🔥 💎
6

·
--
🚨 $BNB SECURITY WAKEUP CALL FROM CZ: TRANSPARENCY OR TRAP? 🦈
📊 CZ just sounded the alarm on the recent breach, calling out glaring security gaps that could ripple through every holder. His shareholder‑level demand for crystal‑clear incident reports and hardened access controls signals a rare top‑tier pressure on the platform. 🔍
🦈 The push for tighter vaults may reshape how smart money positions around $BNB , especially if the exchange proves it can lock down its defenses before the next liquidity surge. 💡
💬 How will you adjust your exposure to $BNB amid this security spotlight? 👇
⚠️ Not financial advice. Always manage your risk. 🛡️
🏷️ #BNB #Security #Exchange #Crypto
🔥 🦈
🚨 $BNB SECURITY WAKEUP CALL FROM CZ: TRANSPARENCY OR TRAP? 🦈
📊 CZ just sounded the alarm on the recent breach, calling out glaring security gaps that could ripple through every holder. His shareholder‑level demand for crystal‑clear incident reports and hardened access controls signals a rare top‑tier pressure on the platform. 🔍
🦈 The push for tighter vaults may reshape how smart money positions around $BNB , especially if the exchange proves it can lock down its defenses before the next liquidity surge. 💡
💬 How will you adjust your exposure to $BNB amid this security spotlight? 👇
⚠️ Not financial advice. Always manage your risk. 🛡️
🏷️ #BNB #Security #Exchange #Crypto
🔥 🦈
📊 CZ just sounded the alarm on the recent breach, calling out glaring security gaps that could ripple through every holder. His shareholder‑level demand for crystal‑clear incident reports and hardened access controls signals a rare top‑tier pressure on the platform. 🔍
🦈 The push for tighter vaults may reshape how smart money positions around $BNB , especially if the exchange proves it can lock down its defenses before the next liquidity surge. 💡
💬 How will you adjust your exposure to $BNB amid this security spotlight? 👇
⚠️ Not financial advice. Always manage your risk. 🛡️
🏷️ #BNB #Security #Exchange #Crypto
🔥 🦈
14


·
--
🚨 $BNB SECURITY ALERT: CZ CALLS FOR TRANSPARENT REFORMS AFTER security incident 🦈
📊 CZ’s shareholder‑level statement cuts through the noise, flagging the recent breach as a clear security failure that demands more than a quick patch. The smart‑money lens sees this as a potential liquidity‑risk catalyst for the ecosystem.
🔍 Transparency and accountability are now the price‑floor expectations; Binance must roll out hardened access controls, independent audits, and real‑time monitoring to restore confidence. Users should double‑check MFA and audit their own holdings while the platform rebuilds its defense layers. 💡
💬 How will you adjust your on‑chain risk strategy in light of these upcoming security upgrades? 👇
⚠️ Not financial advice. Always manage your risk. 🛡️
🏷️ #BNB #Security #Transparency #Crypto #Exchange
🔥 💎
🚨 $BNB SECURITY ALERT: CZ CALLS FOR TRANSPARENT REFORMS AFTER security incident 🦈
📊 CZ’s shareholder‑level statement cuts through the noise, flagging the recent breach as a clear security failure that demands more than a quick patch. The smart‑money lens sees this as a potential liquidity‑risk catalyst for the ecosystem.
🔍 Transparency and accountability are now the price‑floor expectations; Binance must roll out hardened access controls, independent audits, and real‑time monitoring to restore confidence. Users should double‑check MFA and audit their own holdings while the platform rebuilds its defense layers. 💡
💬 How will you adjust your on‑chain risk strategy in light of these upcoming security upgrades? 👇
⚠️ Not financial advice. Always manage your risk. 🛡️
🏷️ #BNB #Security #Transparency #Crypto #Exchange
🔥 💎
📊 CZ’s shareholder‑level statement cuts through the noise, flagging the recent breach as a clear security failure that demands more than a quick patch. The smart‑money lens sees this as a potential liquidity‑risk catalyst for the ecosystem.
🔍 Transparency and accountability are now the price‑floor expectations; Binance must roll out hardened access controls, independent audits, and real‑time monitoring to restore confidence. Users should double‑check MFA and audit their own holdings while the platform rebuilds its defense layers. 💡
💬 How will you adjust your on‑chain risk strategy in light of these upcoming security upgrades? 👇
⚠️ Not financial advice. Always manage your risk. 🛡️
🏷️ #BNB #Security #Transparency #Crypto #Exchange
🔥 💎
2

·
--
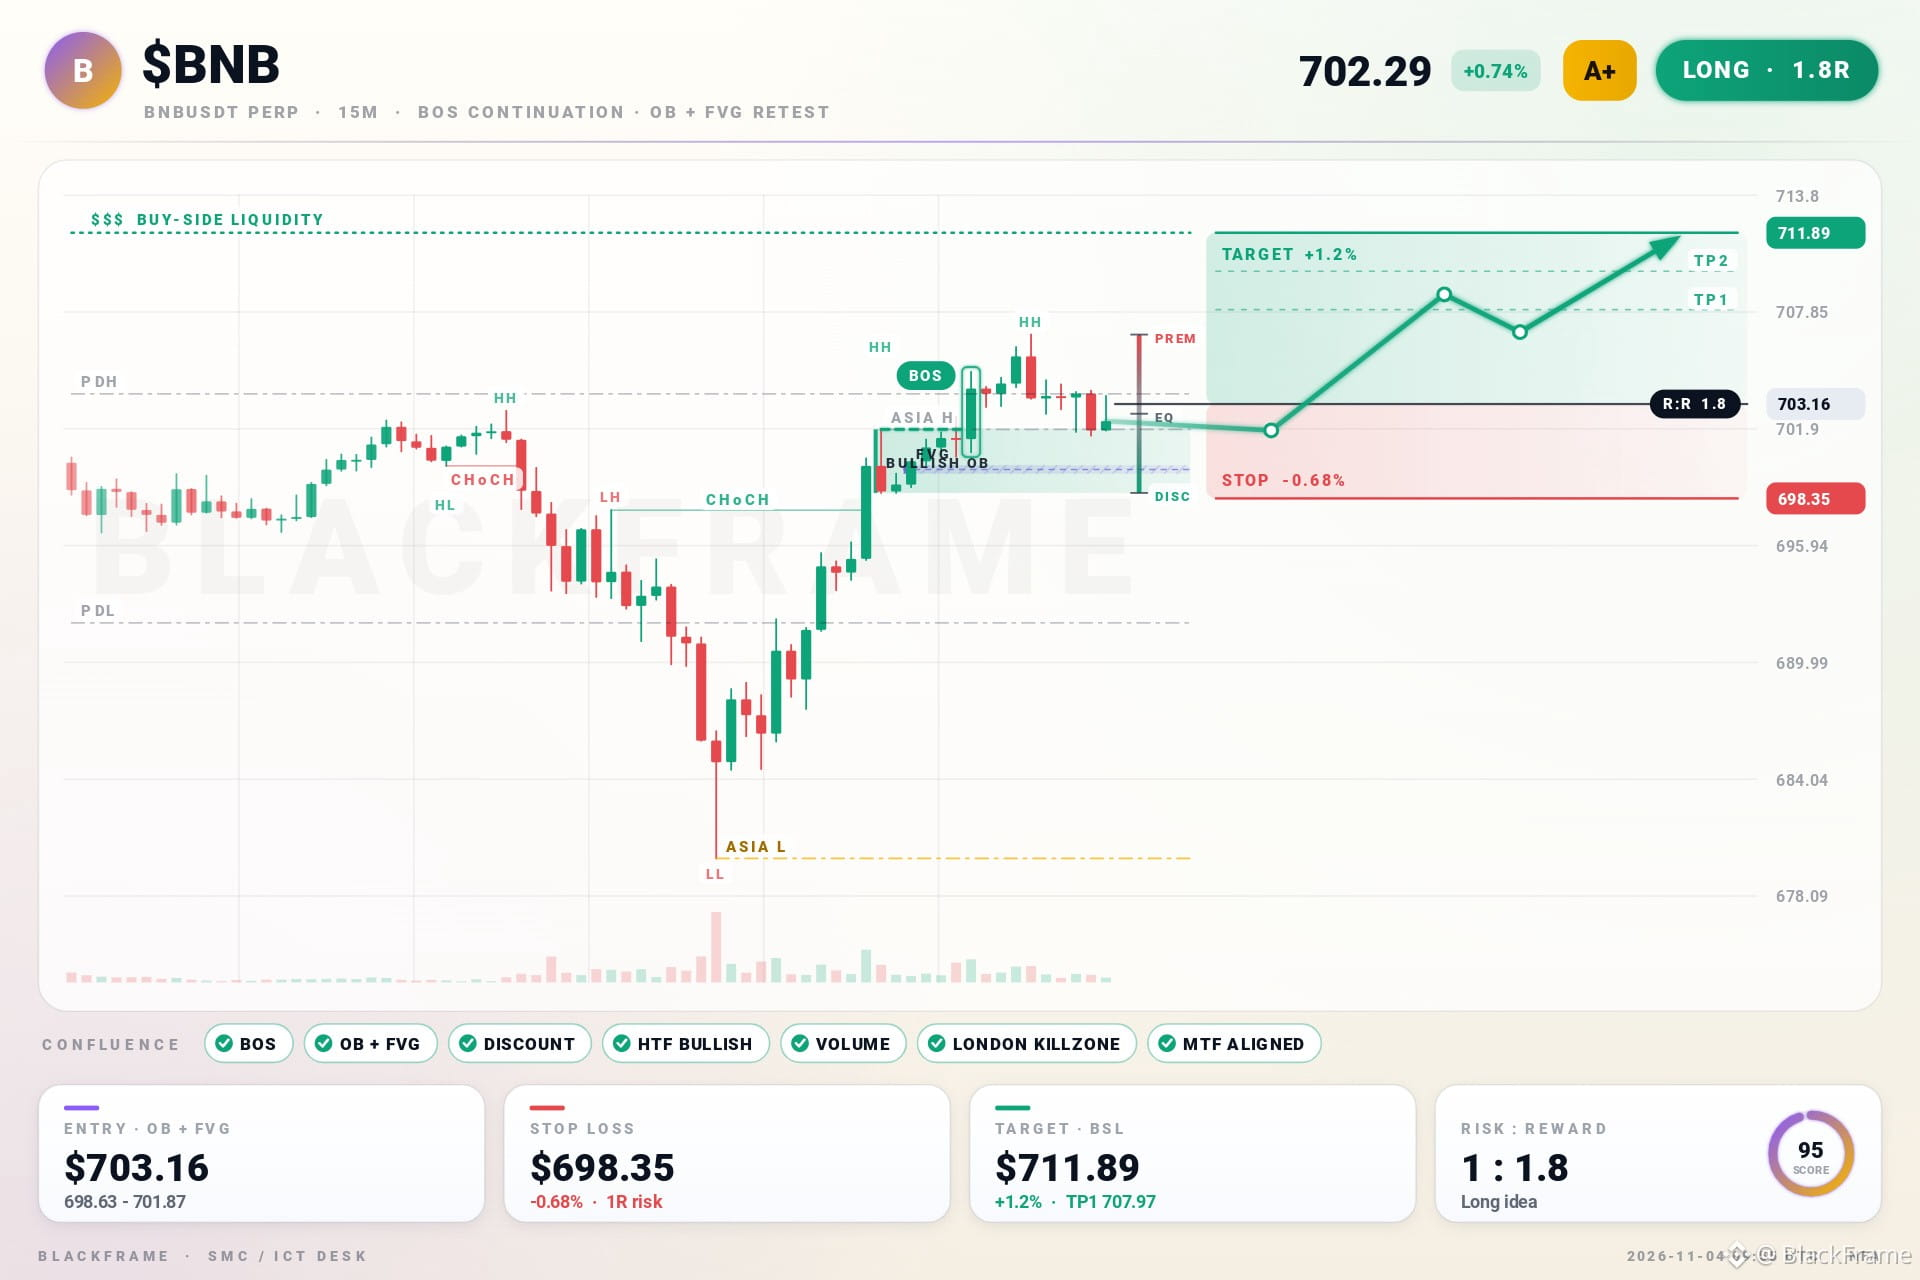
🟢 Bullish
$BNB Signal 🎯
Entry: 310.00
SL: 302.50
TP1: 318.00
TP2: 325.00
$BNB looking strong with continuous Binance ecosystem growth and utility expansion. Good support holding.
#BNB #CryptoSignals
🟢 Bullish
$BNB Signal 🎯
Entry: 310.00
SL: 302.50
TP1: 318.00
TP2: 325.00
$BNB looking strong with continuous Binance ecosystem growth and utility expansion. Good support holding.
#BNB #CryptoSignals
$BNB Signal 🎯
Entry: 310.00
SL: 302.50
TP1: 318.00
TP2: 325.00
$BNB looking strong with continuous Binance ecosystem growth and utility expansion. Good support holding.
#BNB #CryptoSignals

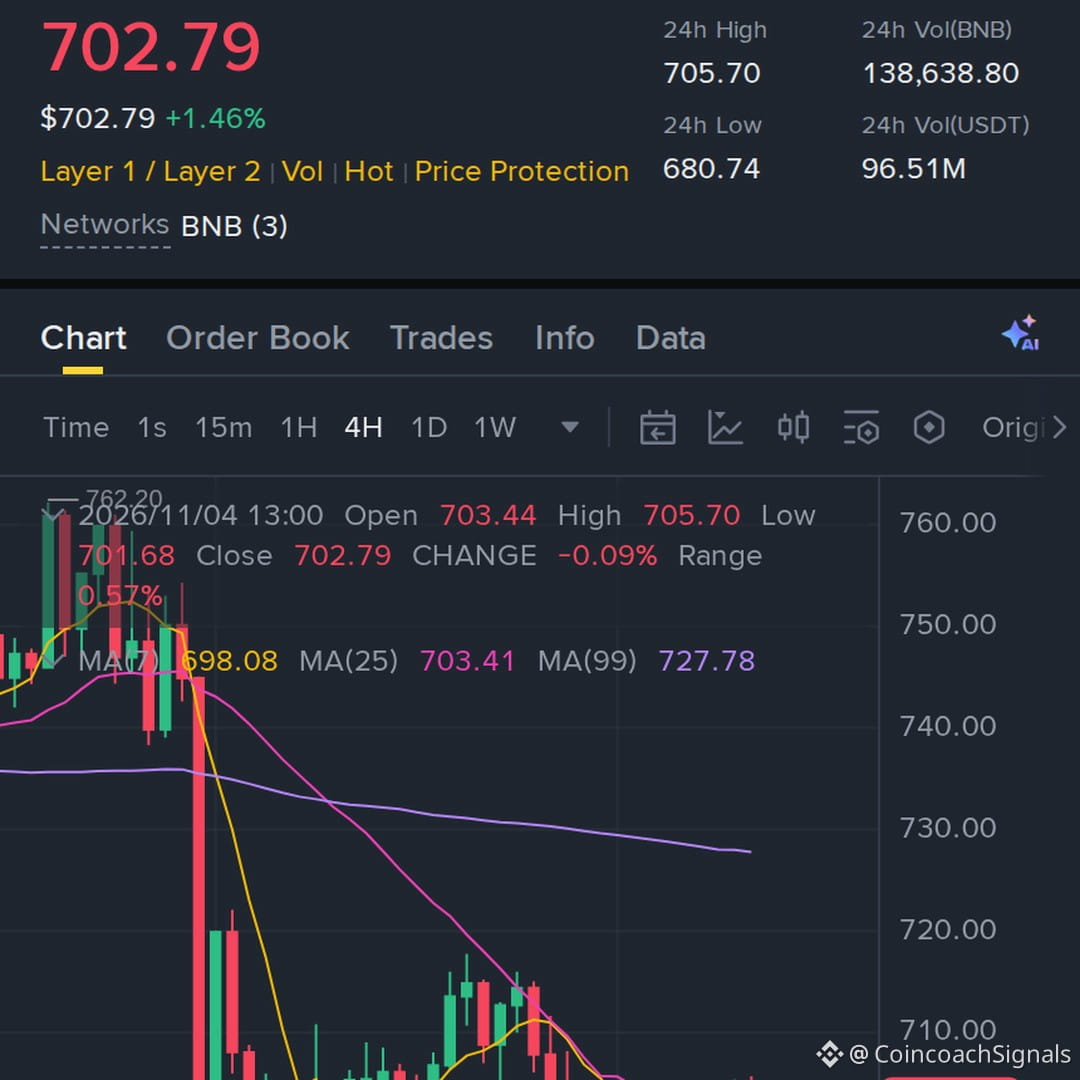
🦈 $BNB BOARD GAIN: SCARAMUCCI JOINS AS INDEPENDENT DIRECTOR 🚀
The appointment of Anthony Scaramucci, SkyBridge Capital founder, injects seasoned finance DNA into $BNB ’s treasury playbook. 📊 His track record in alternative assets signals a potential shift toward more disciplined capital allocation and risk oversight.
Smart‑money eyes are already scanning the boardroom for clues on how $BNB holdings will be managed, especially as volatility spikes on the chain. 🦈 A director with deep market insight could steer the company toward strategic purchases during price rallies while tightening governance buffers. 💡
💬 Will Scaramucci’s presence tilt the corporate balance sheet toward a more aggressive BNB accumulation strategy? 👇
⚠️ Not financial advice. Always manage your risk. 🛡️
🏷️ #BNB #BoardUpdate #Institutional #CryptoTreasury #SmartMoney
🔥 💎
🦈 $BNB BOARD GAIN: SCARAMUCCI JOINS AS INDEPENDENT DIRECTOR 🚀
The appointment of Anthony Scaramucci, SkyBridge Capital founder, injects seasoned finance DNA into $BNB ’s treasury playbook. 📊 His track record in alternative assets signals a potential shift toward more disciplined capital allocation and risk oversight.
Smart‑money eyes are already scanning the boardroom for clues on how $BNB holdings will be managed, especially as volatility spikes on the chain. 🦈 A director with deep market insight could steer the company toward strategic purchases during price rallies while tightening governance buffers. 💡
💬 Will Scaramucci’s presence tilt the corporate balance sheet toward a more aggressive BNB accumulation strategy? 👇
⚠️ Not financial advice. Always manage your risk. 🛡️
🏷️ #BNB #BoardUpdate #Institutional #CryptoTreasury #SmartMoney
🔥 💎
The appointment of Anthony Scaramucci, SkyBridge Capital founder, injects seasoned finance DNA into $BNB ’s treasury playbook. 📊 His track record in alternative assets signals a potential shift toward more disciplined capital allocation and risk oversight.
Smart‑money eyes are already scanning the boardroom for clues on how $BNB holdings will be managed, especially as volatility spikes on the chain. 🦈 A director with deep market insight could steer the company toward strategic purchases during price rallies while tightening governance buffers. 💡
💬 Will Scaramucci’s presence tilt the corporate balance sheet toward a more aggressive BNB accumulation strategy? 👇
⚠️ Not financial advice. Always manage your risk. 🛡️
🏷️ #BNB #BoardUpdate #Institutional #CryptoTreasury #SmartMoney
🔥 💎
1

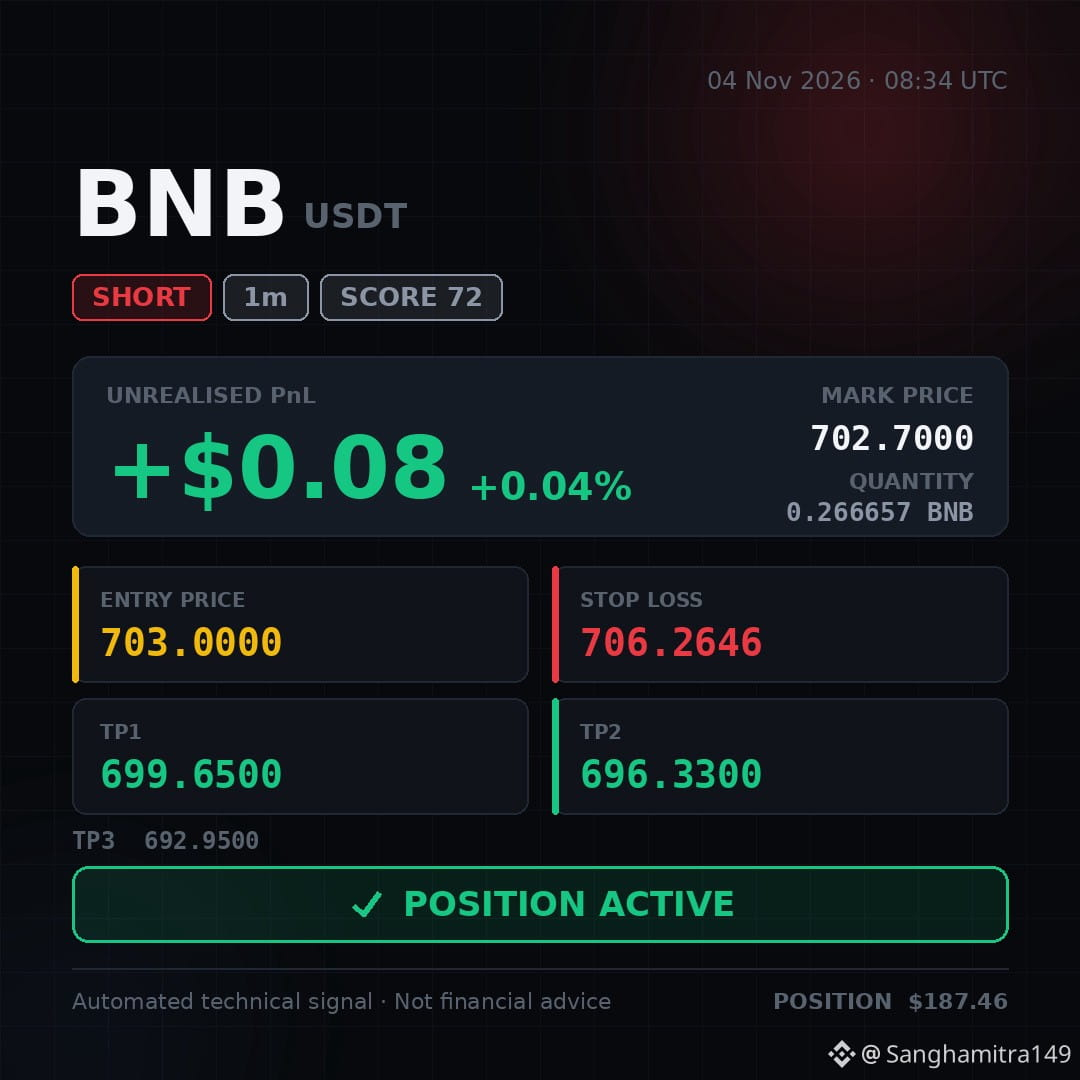
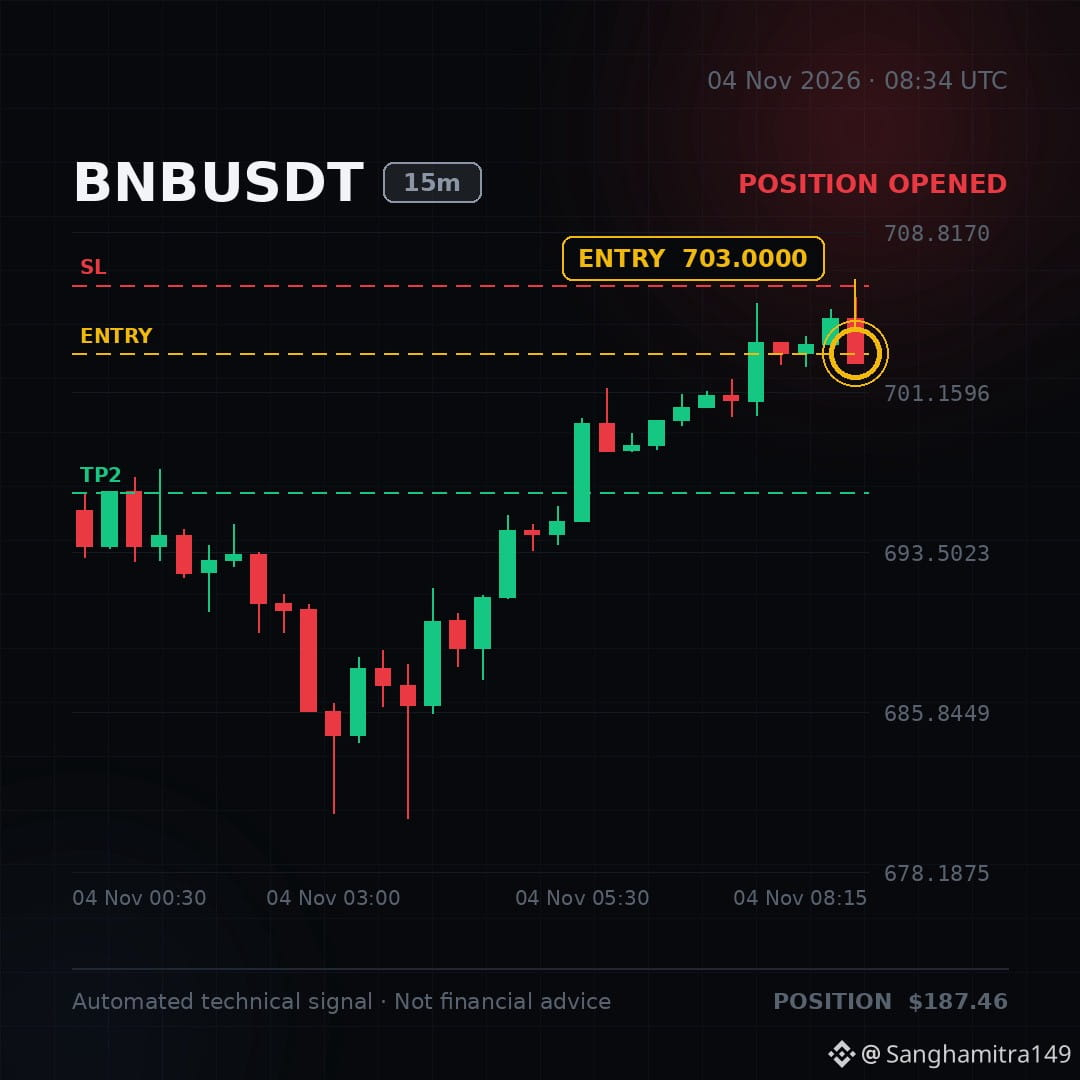
✅ POSITION ACTIVE — I've taken this short. Running at +0.04%.
🚨 #BNB SMC SWEEP CRUSHES THE MARKET! 🤯🐻
I'm shorting hard right now. $BNB 👇
Short..... Now..... Watch..... It..... Surge.....‼️‼️‼️
Entry: 703.0000 – 703.2400
Stop-loss: 706.2646
🟢 TP1: 699.6500
🟢 TP2: 696.3300
🟢 TP3: 692.9500
Join my trade, ride the dip! 👇⬇️⬇️ Short.. With meee...👇⬇️ $BNB
✅ POSITION ACTIVE — I've taken this short. Running at +0.04%.
🚨 #BNB SMC SWEEP CRUSHES THE MARKET! 🤯🐻
I'm shorting hard right now. $BNB 👇
Short..... Now..... Watch..... It..... Surge.....‼️‼️‼️
Entry: 703.0000 – 703.2400
Stop-loss: 706.2646
🟢 TP1: 699.6500
🟢 TP2: 696.3300
🟢 TP3: 692.9500
Join my trade, ride the dip! 👇⬇️⬇️ Short.. With meee...👇⬇️ $BNB
🚨 #BNB SMC SWEEP CRUSHES THE MARKET! 🤯🐻
I'm shorting hard right now. $BNB 👇
Short..... Now..... Watch..... It..... Surge.....‼️‼️‼️
Entry: 703.0000 – 703.2400
Stop-loss: 706.2646
🟢 TP1: 699.6500
🟢 TP2: 696.3300
🟢 TP3: 692.9500
Join my trade, ride the dip! 👇⬇️⬇️ Short.. With meee...👇⬇️ $BNB
5

·
--
🚀 $BNB PARTNERS WITH TRADERS FAIR PHILIPPINES 2027 – UNLOCK ASEAN LIQUIDITY 🦈
📊 BD Ventures aligns with the Manila edition, signaling smart‑money focus on Southeast Asia’s expanding trading ecosystem. The 2,500‑plus attendee roster and 30+ exhibitors create a concentrated liquidity pool where institutional brokers and fintech innovators converge. 📈 Expect order‑flow insights to cascade from the keynote panels, feeding the next wave of platform upgrades and cross‑border partnerships.
💬 How will this regional nexus reshape your exposure to ASEAN‑centric assets? 👇
⚠️ Not financial advice. Always manage your risk. 🛡️
🏷️ #BNB #Partnership #ASEANMarket #TradingEvent #Crypto
🔥 💎
🚀 $BNB PARTNERS WITH TRADERS FAIR PHILIPPINES 2027 – UNLOCK ASEAN LIQUIDITY 🦈
📊 BD Ventures aligns with the Manila edition, signaling smart‑money focus on Southeast Asia’s expanding trading ecosystem. The 2,500‑plus attendee roster and 30+ exhibitors create a concentrated liquidity pool where institutional brokers and fintech innovators converge. 📈 Expect order‑flow insights to cascade from the keynote panels, feeding the next wave of platform upgrades and cross‑border partnerships.
💬 How will this regional nexus reshape your exposure to ASEAN‑centric assets? 👇
⚠️ Not financial advice. Always manage your risk. 🛡️
🏷️ #BNB #Partnership #ASEANMarket #TradingEvent #Crypto
🔥 💎
📊 BD Ventures aligns with the Manila edition, signaling smart‑money focus on Southeast Asia’s expanding trading ecosystem. The 2,500‑plus attendee roster and 30+ exhibitors create a concentrated liquidity pool where institutional brokers and fintech innovators converge. 📈 Expect order‑flow insights to cascade from the keynote panels, feeding the next wave of platform upgrades and cross‑border partnerships.
💬 How will this regional nexus reshape your exposure to ASEAN‑centric assets? 👇
⚠️ Not financial advice. Always manage your risk. 🛡️
🏷️ #BNB #Partnership #ASEANMarket #TradingEvent #Crypto
🔥 💎


2
·
--
Bullish
{spot}(BNBUSDT)
{spot}(BTCUSDT)
{spot}(ETHUSDT)
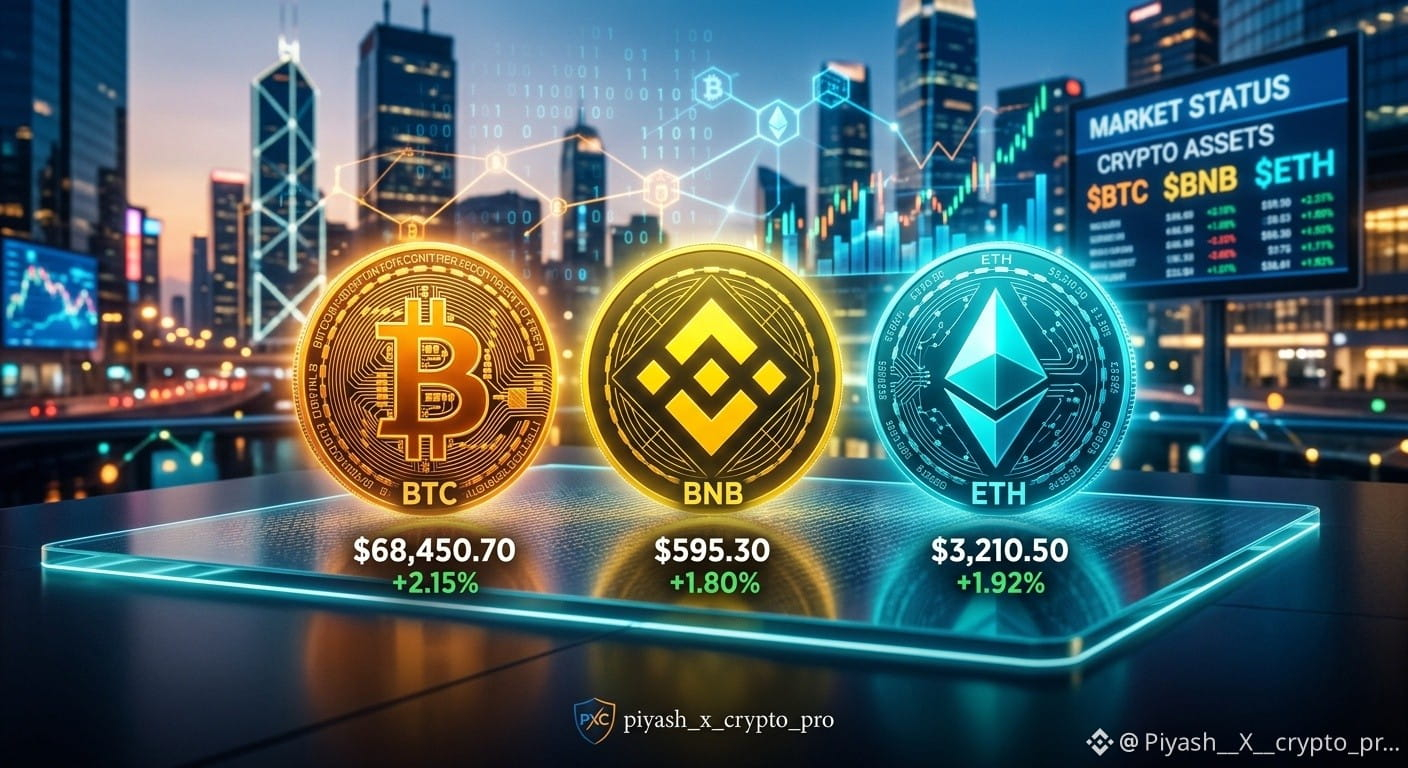
#USMidterms-WhatAreMarketsExpecting? 🚀🔥 CRYPTO MARKET UPDATE — BTC, BNB & ETH ARE IN THE GREEN! 📈
The crypto market is showing positive momentum, with three major cryptocurrencies moving upward! 💎
📊 Today's Market Highlights:
🟠 $BTC (Bitcoin) 💰 Price: $68,450.70 📈 Change: +2.15%
🟡 $BNB (BNB) 💰 Price: $595.30 📈 Change: +1.80%
🔵 $ETH (Ethereum) 💰 Price: $3,210.50 📈 Change: +1.92%
🔥 Market Outlook:
BTC continues to lead the market.
BNB is showing steady bullish momentum.
ETH is maintaining positive movement.
Keep an eye on volume, support, and resistance levels.
💡 My Watchlist: $BTC | $BNB | $ETH
⚠️ Crypto markets are volatile. Always DYOR and manage your risk. This is not financial advice (NFA).
#Bitcoin #BNB #Ethereum #CryptoMarket #BinanceSquare #CryptoTrading #Piyash_X_Crypto_Pro #BinanceReopensWithdrawalsForMoreAssets
#USMidterms-WhatAreMarketsExpecting? 🚀🔥 CRYPTO MARKET UPDATE — BTC, BNB & ETH ARE IN THE GREEN! 📈
The crypto market is showing positive momentum, with three major cryptocurrencies moving upward! 💎
📊 Today's Market Highlights:
🟠 $BTC (Bitcoin) 💰 Price: $68,450.70 📈 Change: +2.15%
🟡 $BNB (BNB) 💰 Price: $595.30 📈 Change: +1.80%
🔵 $ETH (Ethereum) 💰 Price: $3,210.50 📈 Change: +1.92%
🔥 Market Outlook:
BTC continues to lead the market.
BNB is showing steady bullish momentum.
ETH is maintaining positive movement.
Keep an eye on volume, support, and resistance levels.
💡 My Watchlist: $BTC | $BNB | $ETH
⚠️ Crypto markets are volatile. Always DYOR and manage your risk. This is not financial advice (NFA).
#Bitcoin #BNB #Ethereum #CryptoMarket #BinanceSquare #CryptoTrading #Piyash_X_Crypto_Pro #BinanceReopensWithdrawalsForMoreAssets
The crypto market is showing positive momentum, with three major cryptocurrencies moving upward! 💎
📊 Today's Market Highlights:
🟠 $BTC (Bitcoin) 💰 Price: $68,450.70 📈 Change: +2.15%
🟡 $BNB (BNB) 💰 Price: $595.30 📈 Change: +1.80%
🔵 $ETH (Ethereum) 💰 Price: $3,210.50 📈 Change: +1.92%
🔥 Market Outlook:
BTC continues to lead the market.
BNB is showing steady bullish momentum.
ETH is maintaining positive movement.
Keep an eye on volume, support, and resistance levels.
💡 My Watchlist: $BTC | $BNB | $ETH
⚠️ Crypto markets are volatile. Always DYOR and manage your risk. This is not financial advice (NFA).
#Bitcoin #BNB #Ethereum #CryptoMarket #BinanceSquare #CryptoTrading #Piyash_X_Crypto_Pro #BinanceReopensWithdrawalsForMoreAssets
2
55
Log in to explore more content
Join global crypto users on Binance Square
⚡️ Get latest and useful information about crypto.
💬 Trusted by the world’s largest crypto exchange.
👍 Discover real insights from verified creators.
Email / Phone number
Trending Topics
1
#USMidterms-WhatAreMarketsExpecting?
80,286 views
718 Discussing
2
#USOctoberNFP-AreRateCutsStillPossible
242,315 views
1,897 Discussing
3
#AMDBeatsExpectations-AINarrativeContinues
18,751 views
265 Discussing
4
#BinanceIncidentReport
240,047 views
1,325 Discussing
5
#AnthropicIPOPricedDownasInvestorsEye$1.5T
14,798 views
105 Discussing
6
#37thQuarterlyBNBBurnRemoves1.64MillionBNB
0 views
0 Discussing
7
#BinanceReopensWithdrawalsForMoreAssets
356,122 views
2,346 Discussing
8
#HongKongToLicenseVirtualAssetCustodyAndAdvisory
2,476 views
78 Discussing
9
#BinanceHourlyDepositsExceedWithdrawals
150,802 views
1,154 Discussing
10
#SouthKoreaRulingPartyLeaderSeeksCryptoTaxDelay
3,472 views
59 Discussing