
#bitcoinetf
bitcoinetf
1.9M views
5,713 Discussing
Hot
Latest

·
--
BITCOIN ($BTC ) — Institutional Money Is Moving Out! 🟠
U.S. spot Bitcoin ETFs recorded approximately $1.07 billion in net outflows during the week ending November 13.
Institutional money flows are becoming an important signal for Bitcoin's short-term market sentiment.
Do you think BTC can recover its momentum before December? 👀
#BitcoinETF #CryptoMarket #CryptoNews
BITCOIN ($BTC ) — Institutional Money Is Moving Out! 🟠
U.S. spot Bitcoin ETFs recorded approximately $1.07 billion in net outflows during the week ending November 13.
Institutional money flows are becoming an important signal for Bitcoin's short-term market sentiment.
Do you think BTC can recover its momentum before December? 👀
#BitcoinETF #CryptoMarket #CryptoNews
U.S. spot Bitcoin ETFs recorded approximately $1.07 billion in net outflows during the week ending November 13.
Institutional money flows are becoming an important signal for Bitcoin's short-term market sentiment.
Do you think BTC can recover its momentum before December? 👀
#BitcoinETF #CryptoMarket #CryptoNews

8

·
--
$BTC | SatoshiMacro's cumulative spot Bitcoin ETF flow tracker shows the line round-tripping, not climbing one way. From the US$62.7 billion peak on 9 October 2025 it fell US$11.8 billion to a July 2026 low, recovered to US$57.3 billion by late October, then slipped to US$54.6 billion as of 16 November 2026. On the desk I watch the slope, not the level. A second leg down after a bounce reads like profit taking, not a structural exit. My actual read is it needs to hold above the July low to stay a pause, not a trend change. SatoshiMacro's tracker runs a 0.7 to 0.8 rolling correlation with price, a demand proxy, not a forecast. Australia's ASX listed BTC ETFs hold just A$458.7 million combined.
https://satoshimacro.com/tools/crypto/etf-flows/cumulative-btc-etf-holdings/?utm_source=binance_square&utm_medium=social&utm_campaign=autopilot_short-1
#SatoshiMacro #BitcoinETF #ETFFlows #Bitcoin
$BTC | SatoshiMacro's cumulative spot Bitcoin ETF flow tracker shows the line round-tripping, not climbing one way. From the US$62.7 billion peak on 9 October 2025 it fell US$11.8 billion to a July 2026 low, recovered to US$57.3 billion by late October, then slipped to US$54.6 billion as of 16 November 2026. On the desk I watch the slope, not the level. A second leg down after a bounce reads like profit taking, not a structural exit. My actual read is it needs to hold above the July low to stay a pause, not a trend change. SatoshiMacro's tracker runs a 0.7 to 0.8 rolling correlation with price, a demand proxy, not a forecast. Australia's ASX listed BTC ETFs hold just A$458.7 million combined.
https://satoshimacro.com/tools/crypto/etf-flows/cumulative-btc-etf-holdings/?utm_source=binance_square&utm_medium=social&utm_campaign=autopilot_short-1
#SatoshiMacro #BitcoinETF #ETFFlows #Bitcoin
https://satoshimacro.com/tools/crypto/etf-flows/cumulative-btc-etf-holdings/?utm_source=binance_square&utm_medium=social&utm_campaign=autopilot_short-1
#SatoshiMacro #BitcoinETF #ETFFlows #Bitcoin
10

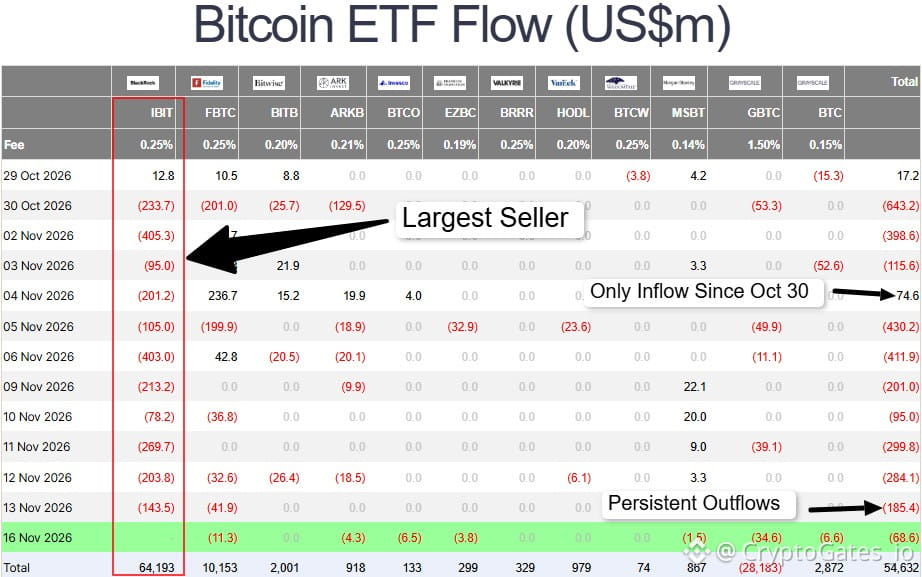
Spot $BTC ETFs: 11 Red Sessions Out of 12
From 30 Oct to 16 Nov, daily net flows were negative in 11 of 12 sessions. The only inflow came on 4 Nov (+$74.6M). 💸 Cumulative net outflow over the window exceeds $3B.
BTC is still holding around $65K, so this is not a panic exit. It is a steady absence of fresh institutional demand.
Scenario map:
Outflows fade: price can stabilize without extra support
Outflows persist while price chops: dips rely on spot and leverage alone, and liquidity can thin out quickly
ETF flows lag demand and are not a timing tool. Check funding, open interest and price reaction at key levels before increasing exposure.
Verify first. Risk later. Scale slowly.
#BitcoinETF #BTC
Spot $BTC ETFs: 11 Red Sessions Out of 12
From 30 Oct to 16 Nov, daily net flows were negative in 11 of 12 sessions. The only inflow came on 4 Nov (+$74.6M). 💸 Cumulative net outflow over the window exceeds $3B.
BTC is still holding around $65K, so this is not a panic exit. It is a steady absence of fresh institutional demand.
Scenario map:
Outflows fade: price can stabilize without extra support
Outflows persist while price chops: dips rely on spot and leverage alone, and liquidity can thin out quickly
ETF flows lag demand and are not a timing tool. Check funding, open interest and price reaction at key levels before increasing exposure.
Verify first. Risk later. Scale slowly.
#BitcoinETF #BTC
From 30 Oct to 16 Nov, daily net flows were negative in 11 of 12 sessions. The only inflow came on 4 Nov (+$74.6M). 💸 Cumulative net outflow over the window exceeds $3B.
BTC is still holding around $65K, so this is not a panic exit. It is a steady absence of fresh institutional demand.
Scenario map:
Outflows fade: price can stabilize without extra support
Outflows persist while price chops: dips rely on spot and leverage alone, and liquidity can thin out quickly
ETF flows lag demand and are not a timing tool. Check funding, open interest and price reaction at key levels before increasing exposure.
Verify first. Risk later. Scale slowly.
#BitcoinETF #BTC
BTC+0.27%
IBITETF-0.19%
13

·
--
After a period of outflows, Bitcoin ETFs have seen renewed inflows. This shift indicates growing institutional interest and confidence in Bitcoin as an asset class. The renewed buying pressure could support Bitcoin's price in the short to medium term, potentially signaling the start of a new upward trend. Investors are closely watching these flows for further confirmation of market sentiment.
Disclaimer: This is not investment advice.
#BitcoinETF $BTC
After a period of outflows, Bitcoin ETFs have seen renewed inflows. This shift indicates growing institutional interest and confidence in Bitcoin as an asset class. The renewed buying pressure could support Bitcoin's price in the short to medium term, potentially signaling the start of a new upward trend. Investors are closely watching these flows for further confirmation of market sentiment.
Disclaimer: This is not investment advice.
#BitcoinETF $BTC
Disclaimer: This is not investment advice.
#BitcoinETF $BTC

Trong_Hatachi:
Dòng tiền ETF Bitcoin quay lại sau giai đoạn rút vốn là tín hiệu đáng chú ý, nhưng vẫn cần theo dõi thêm để xác nhận xu hướng. Theo dõi mình nhé, mình follow lại!
1
41

Article
INSTITUTIONAL BITCOIN INTELLIGENCE 03BITCOIN ETFs LOSE $1.91 BILLION: IS INSTITUTIONAL DEMAND DISAPPEARING?
Bitcoin's latest correction has exposed a critical question.
What happens when one of the market's most important regulated investment channels stops attracting capital?
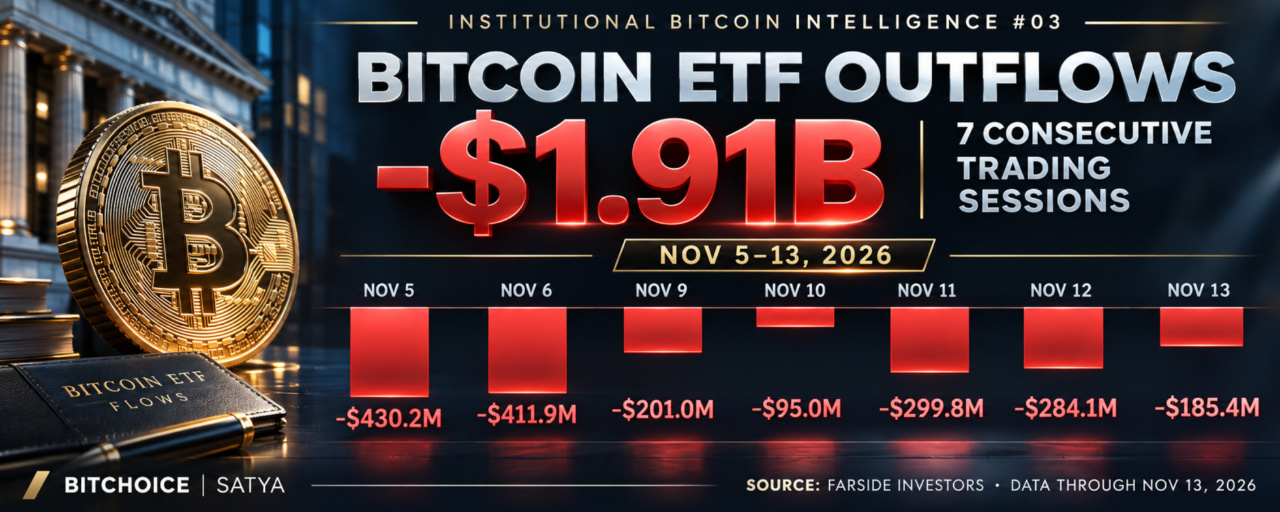
Between November 5 and November 13, 2026, U.S. spot Bitcoin ETFs recorded approximately $1.91 billion in cumulative net outflows across seven consecutive trading sessions.
This was not a single-day event.
It was a sustained period of negative fund flows.
THE SEVEN-SESSION DRAIN
Daily net flows across U.S. spot Bitcoin ETFs:
November 5: −$430.2M
November 6: −$411.9M
November 9: −$201.0M
November 10: −$95.0M
November 11: −$299.8M
November 12: −$284.1M
November 13: −$185.4M
Total: approximately −$1.91B.
The week of November 9–13 alone recorded $1.07B in net outflows.
Across the two full trading weeks ending November 13, the cumulative figure reached approximately $2.35B.
These are separate measurement windows, not figures to be added together.
THE BLACKROCK FACTOR
On November 13, BlackRock's IBIT recorded $143.5M in net outflows, while Fidelity's FBTC lost $41.9M.
IBIT therefore represented approximately 77% of the aggregate $185.4M negative flow that day.
Across the entire seven-session period, IBIT alone accounted for approximately $1.42B in net outflows.
This concentration is important.
Large regulated Bitcoin investment vehicles can influence the balance of incremental demand even when the underlying cryptocurrency continues trading across many other markets.
BUT ETF OUTFLOWS ARE NOT THE SAME AS SPOT SELLING
There is an important distinction often lost in market headlines.
ETF shares can trade between investors on the secondary market without changing the number of shares outstanding.
Fund creations and redemptions are different transactions.
Reported ETF net flows measure the net movement through the fund creation and redemption process.
They do not mean that precisely $1.91B worth of Bitcoin was immediately sold on spot exchanges at the moment the figures were published.
The timing and market impact depend on the funds' operating mechanisms and trading activity.
Still, seven negative sessions indicate that this channel was not delivering positive net demand during the period.
WHAT WOULD SIGNAL A REAL RECOVERY?
1. Consistent positive ETF flows
One green day can interrupt the streak. Several consecutive inflow sessions would provide stronger evidence of improving demand.
2. Reduced derivatives stress
Lower forced liquidation pressure would make price discovery less dependent on sudden leverage unwinds.
3. Stronger market liquidity
ETF flows should be considered alongside stablecoin supply, spot liquidity and broader financial conditions.
4. Broader participation
A healthier recovery would be more convincing if buying pressure was not concentrated in only one fund or one trading session.
THREE INSTITUTIONAL SIGNALS
The latest Bitcoin market data reveal three different pressures.
Options markets continue pricing downside protection.
Strategy has allocated substantial capital to preferred-stock repurchases while continuing to buy BTC.
And U.S. spot Bitcoin ETFs have experienced seven consecutive sessions of withdrawals.
These signals describe different parts of the market.
They should not be mechanically combined or presented as evidence of coordinated institutional selling.
But together they show why the next sustainable Bitcoin advance may depend as much on liquidity and financing conditions as on market sentiment.
OUR ASSESSMENT
Bitcoin does not require uninterrupted ETF inflows to appreciate.
However, a sustained return of positive net flows would strengthen the case that institutional demand is rebuilding.
Until then, a price bounce and a durable recovery should not be treated as the same thing.
What would convince you more: one large ETF inflow day or five consecutive positive sessions?
BITCHOICE | SATYA
Institutional Bitcoin Intelligence #03
Farside Investors, U.S. spot Bitcoin ETF flows through November 13, 2026.
#Bitcoin #BitcoinETF #InstitutionalBitcoin #CryptoLiquidity #CapitalMarkets $BTC
{spot}(BTCUSDT)
INSTITUTIONAL BITCOIN INTELLIGENCE 03
BITCOIN ETFs LOSE $1.91 BILLION: IS INSTITUTIONAL DEMAND DISAPPEARING?
Bitcoin's latest correction has exposed a critical question.
What happens when one of the market's most important regulated investment channels stops attracting capital?
Between November 5 and November 13, 2026, U.S. spot Bitcoin ETFs recorded approximately $1.91 billion in cumulative net outflows across seven consecutive trading sessions.
This was not a single-day event.
It was a sustained period of negative fund flows.
THE SEVEN-SESSION DRAIN
Daily net flows across U.S. spot Bitcoin ETFs:
November 5: −$430.2M
November 6: −$411.9M
November 9: −$201.0M
November 10: −$95.0M
November 11: −$299.8M
November 12: −$284.1M
November 13: −$185.4M
Total: approximately −$1.91B.
The week of November 9–13 alone recorded $1.07B in net outflows.
Across the two full trading weeks ending November 13, the cumulative figure reached approximately $2.35B.
These are separate measurement windows, not figures to be added together.
THE BLACKROCK FACTOR
On November 13, BlackRock's IBIT recorded $143.5M in net outflows, while Fidelity's FBTC lost $41.9M.
IBIT therefore represented approximately 77% of the aggregate $185.4M negative flow that day.
Across the entire seven-session period, IBIT alone accounted for approximately $1.42B in net outflows.
This concentration is important.
Large regulated Bitcoin investment vehicles can influence the balance of incremental demand even when the underlying cryptocurrency continues trading across many other markets.
BUT ETF OUTFLOWS ARE NOT THE SAME AS SPOT SELLING
There is an important distinction often lost in market headlines.
ETF shares can trade between investors on the secondary market without changing the number of shares outstanding.
Fund creations and redemptions are different transactions.
Reported ETF net flows measure the net movement through the fund creation and redemption process.
They do not mean that precisely $1.91B worth of Bitcoin was immediately sold on spot exchanges at the moment the figures were published.
The timing and market impact depend on the funds' operating mechanisms and trading activity.
Still, seven negative sessions indicate that this channel was not delivering positive net demand during the period.
WHAT WOULD SIGNAL A REAL RECOVERY?
1. Consistent positive ETF flows
One green day can interrupt the streak. Several consecutive inflow sessions would provide stronger evidence of improving demand.
2. Reduced derivatives stress
Lower forced liquidation pressure would make price discovery less dependent on sudden leverage unwinds.
3. Stronger market liquidity
ETF flows should be considered alongside stablecoin supply, spot liquidity and broader financial conditions.
4. Broader participation
A healthier recovery would be more convincing if buying pressure was not concentrated in only one fund or one trading session.
THREE INSTITUTIONAL SIGNALS
The latest Bitcoin market data reveal three different pressures.
Options markets continue pricing downside protection.
Strategy has allocated substantial capital to preferred-stock repurchases while continuing to buy BTC.
And U.S. spot Bitcoin ETFs have experienced seven consecutive sessions of withdrawals.
These signals describe different parts of the market.
They should not be mechanically combined or presented as evidence of coordinated institutional selling.
But together they show why the next sustainable Bitcoin advance may depend as much on liquidity and financing conditions as on market sentiment.
OUR ASSESSMENT
Bitcoin does not require uninterrupted ETF inflows to appreciate.
However, a sustained return of positive net flows would strengthen the case that institutional demand is rebuilding.
Until then, a price bounce and a durable recovery should not be treated as the same thing.
What would convince you more: one large ETF inflow day or five consecutive positive sessions?
BITCHOICE | SATYA
Institutional Bitcoin Intelligence #03
Farside Investors, U.S. spot Bitcoin ETF flows through November 13, 2026.
#Bitcoin #BitcoinETF #InstitutionalBitcoin #CryptoLiquidity #CapitalMarkets $BTC
Bitcoin's latest correction has exposed a critical question.
What happens when one of the market's most important regulated investment channels stops attracting capital?
Between November 5 and November 13, 2026, U.S. spot Bitcoin ETFs recorded approximately $1.91 billion in cumulative net outflows across seven consecutive trading sessions.
This was not a single-day event.
It was a sustained period of negative fund flows.
THE SEVEN-SESSION DRAIN
Daily net flows across U.S. spot Bitcoin ETFs:
November 5: −$430.2M
November 6: −$411.9M
November 9: −$201.0M
November 10: −$95.0M
November 11: −$299.8M
November 12: −$284.1M
November 13: −$185.4M
Total: approximately −$1.91B.
The week of November 9–13 alone recorded $1.07B in net outflows.
Across the two full trading weeks ending November 13, the cumulative figure reached approximately $2.35B.
These are separate measurement windows, not figures to be added together.
THE BLACKROCK FACTOR
On November 13, BlackRock's IBIT recorded $143.5M in net outflows, while Fidelity's FBTC lost $41.9M.
IBIT therefore represented approximately 77% of the aggregate $185.4M negative flow that day.
Across the entire seven-session period, IBIT alone accounted for approximately $1.42B in net outflows.
This concentration is important.
Large regulated Bitcoin investment vehicles can influence the balance of incremental demand even when the underlying cryptocurrency continues trading across many other markets.
BUT ETF OUTFLOWS ARE NOT THE SAME AS SPOT SELLING
There is an important distinction often lost in market headlines.
ETF shares can trade between investors on the secondary market without changing the number of shares outstanding.
Fund creations and redemptions are different transactions.
Reported ETF net flows measure the net movement through the fund creation and redemption process.
They do not mean that precisely $1.91B worth of Bitcoin was immediately sold on spot exchanges at the moment the figures were published.
The timing and market impact depend on the funds' operating mechanisms and trading activity.
Still, seven negative sessions indicate that this channel was not delivering positive net demand during the period.
WHAT WOULD SIGNAL A REAL RECOVERY?
1. Consistent positive ETF flows
One green day can interrupt the streak. Several consecutive inflow sessions would provide stronger evidence of improving demand.
2. Reduced derivatives stress
Lower forced liquidation pressure would make price discovery less dependent on sudden leverage unwinds.
3. Stronger market liquidity
ETF flows should be considered alongside stablecoin supply, spot liquidity and broader financial conditions.
4. Broader participation
A healthier recovery would be more convincing if buying pressure was not concentrated in only one fund or one trading session.
THREE INSTITUTIONAL SIGNALS
The latest Bitcoin market data reveal three different pressures.
Options markets continue pricing downside protection.
Strategy has allocated substantial capital to preferred-stock repurchases while continuing to buy BTC.
And U.S. spot Bitcoin ETFs have experienced seven consecutive sessions of withdrawals.
These signals describe different parts of the market.
They should not be mechanically combined or presented as evidence of coordinated institutional selling.
But together they show why the next sustainable Bitcoin advance may depend as much on liquidity and financing conditions as on market sentiment.
OUR ASSESSMENT
Bitcoin does not require uninterrupted ETF inflows to appreciate.
However, a sustained return of positive net flows would strengthen the case that institutional demand is rebuilding.
Until then, a price bounce and a durable recovery should not be treated as the same thing.
What would convince you more: one large ETF inflow day or five consecutive positive sessions?
BITCHOICE | SATYA
Institutional Bitcoin Intelligence #03
Farside Investors, U.S. spot Bitcoin ETF flows through November 13, 2026.
#Bitcoin #BitcoinETF #InstitutionalBitcoin #CryptoLiquidity #CapitalMarkets $BTC
1
71

·
--
Bearish
🚨 Bitcoin ETFs saw $1.07B in outflows this week. $BTC
{future}(BTCUSDT)
BlackRock and other spot Bitcoin ETFs sold $1.07B worth of BTC. Monthly outflows now total $2.35B, which adds to the selling pressure. All eyes are on ETF flows. 👀
$BTC #BitcoinETF #Crypto #CryptoSelloffTriggersMultipleWhaleLiquidations
🚨 Bitcoin ETFs saw $1.07B in outflows this week. $BTC
BlackRock and other spot Bitcoin ETFs sold $1.07B worth of BTC. Monthly outflows now total $2.35B, which adds to the selling pressure. All eyes are on ETF flows. 👀
$BTC #BitcoinETF #Crypto #CryptoSelloffTriggersMultipleWhaleLiquidations
BlackRock and other spot Bitcoin ETFs sold $1.07B worth of BTC. Monthly outflows now total $2.35B, which adds to the selling pressure. All eyes are on ETF flows. 👀
$BTC #BitcoinETF #Crypto #CryptoSelloffTriggersMultipleWhaleLiquidations


BTC+0.27%
BLKUS-0.03%
11


Article
Bitcoin ETFs Lose $1.065B for a Third Straight Week: IBIT Leads the Exits as BTC Falls to $62K🏦 About $2.35B has left US spot Bitcoin ETFs in two weeks. Here is who is selling, what the flows can't prove, and what to watch.
Last week BlackRock's Bitcoin ETF lost $909M. Morgan Stanley's gained $54M. 🤔 I wanted to see what that split says about who is selling.
📊 What Happened?
US spot Bitcoin ETFs lost $1.065B in the week of November 9-13, according to SoSoValue. It was their third straight week of outflows and the fifth outflow week in the last six. The week before lost $1.28B, so about $2.35B has left in two weeks. That came as BTC fell to about $62,000 on Sunday, its lowest level since mid-July.
🏦 Who Led It
BlackRock's IBIT: -$909M. Its cumulative net inflow is still $64.19B.Fidelity's FBTC: -$111M, with $10.15B cumulative.Morgan Stanley's MSBT: +$54.3M, leading inflows. It's the newest of the big names, with $837M cumulative.
Total ETF assets are about $86.2B, around 6.2% of Bitcoin's market cap. Ether ETFs lost $399M in the same week, their seventh straight weekly outflow.
🔗 The Wider Picture
The ETFs aren't the only place money is leaving. Stablecoin supply fell about $17B over 30 days, which suggests less cash waiting on the sidelines. One analyst points out that most spot selling is happening on Coinbase, which lines up with the ETF exits. Treasury sellers matter too: MARA alone has sold about 40,600 BTC this year.
📈 Why Flows Matter Both Ways
One analysis credit $1.92B in weekly ETF inflows as a driver of August's 23.5% rally in seven days. Flows can push price up as well as down, which is why the streak is worth tracking.
🛑 What the Flows Don't Prove
A net outflow just means redemptions beat creations. It doesn't say why. Some of it can be hedge or basis-trade unwinds, which aren't bearish bets on Bitcoin. The cumulative total is also still strongly positive at $54.63B, and the funds' assets fell mostly because the price fell. This is pressure, not a collapse.
⚠️ The Risk Scenario
Another billion-dollar week would say the selling isn't fading, and Wednesday's Fed minutes could add fuel. Glassnode flagged a cluster of potential liquidations between $59,500 and $62,600, right where Sunday's low sat. If ETFs keep bleeding while that zone breaks, the pressure builds.
👀 Three Things to Watch Next
Does a fourth straight week of outflows follow?Does IBIT keep leading the exits?Does any fund post a clear inflow day?
💡 The Takeaway
The streak is the signal, more than any single number. I'd watch whether one real inflow day appears before reading anything into a bounce. Until then, the missing ETF bid is the gap I'd worry about most.
If you had to watch one this week, would you pick the weekly ETF total or IBIT's daily flow? And do you think MSBT's inflow is an early sign of a turn or just noise? I'd like to hear how you read it. 👇
That is the part worth watching.
This post is for informational and educational purposes only and is not financial advice. Crypto markets are volatile. Always conduct your own research before making financial decisions.
#BinanceSquare #BitcoinETF #IBIT #Bitcoin #CryptoNews
{spot}(BTCUSDT)
Bitcoin ETFs Lose $1.065B for a Third Straight Week: IBIT Leads the Exits as BTC Falls to $62K
🏦 About $2.35B has left US spot Bitcoin ETFs in two weeks. Here is who is selling, what the flows can't prove, and what to watch.
Last week BlackRock's Bitcoin ETF lost $909M. Morgan Stanley's gained $54M. 🤔 I wanted to see what that split says about who is selling.
📊 What Happened?
US spot Bitcoin ETFs lost $1.065B in the week of November 9-13, according to SoSoValue. It was their third straight week of outflows and the fifth outflow week in the last six. The week before lost $1.28B, so about $2.35B has left in two weeks. That came as BTC fell to about $62,000 on Sunday, its lowest level since mid-July.
🏦 Who Led It
BlackRock's IBIT: -$909M. Its cumulative net inflow is still $64.19B.Fidelity's FBTC: -$111M, with $10.15B cumulative.Morgan Stanley's MSBT: +$54.3M, leading inflows. It's the newest of the big names, with $837M cumulative.
Total ETF assets are about $86.2B, around 6.2% of Bitcoin's market cap. Ether ETFs lost $399M in the same week, their seventh straight weekly outflow.
🔗 The Wider Picture
The ETFs aren't the only place money is leaving. Stablecoin supply fell about $17B over 30 days, which suggests less cash waiting on the sidelines. One analyst points out that most spot selling is happening on Coinbase, which lines up with the ETF exits. Treasury sellers matter too: MARA alone has sold about 40,600 BTC this year.
📈 Why Flows Matter Both Ways
One analysis credit $1.92B in weekly ETF inflows as a driver of August's 23.5% rally in seven days. Flows can push price up as well as down, which is why the streak is worth tracking.
🛑 What the Flows Don't Prove
A net outflow just means redemptions beat creations. It doesn't say why. Some of it can be hedge or basis-trade unwinds, which aren't bearish bets on Bitcoin. The cumulative total is also still strongly positive at $54.63B, and the funds' assets fell mostly because the price fell. This is pressure, not a collapse.
⚠️ The Risk Scenario
Another billion-dollar week would say the selling isn't fading, and Wednesday's Fed minutes could add fuel. Glassnode flagged a cluster of potential liquidations between $59,500 and $62,600, right where Sunday's low sat. If ETFs keep bleeding while that zone breaks, the pressure builds.
👀 Three Things to Watch Next
Does a fourth straight week of outflows follow?Does IBIT keep leading the exits?Does any fund post a clear inflow day?
💡 The Takeaway
The streak is the signal, more than any single number. I'd watch whether one real inflow day appears before reading anything into a bounce. Until then, the missing ETF bid is the gap I'd worry about most.
If you had to watch one this week, would you pick the weekly ETF total or IBIT's daily flow? And do you think MSBT's inflow is an early sign of a turn or just noise? I'd like to hear how you read it. 👇
That is the part worth watching.
This post is for informational and educational purposes only and is not financial advice. Crypto markets are volatile. Always conduct your own research before making financial decisions.
#BinanceSquare #BitcoinETF #IBIT #Bitcoin #CryptoNews
Last week BlackRock's Bitcoin ETF lost $909M. Morgan Stanley's gained $54M. 🤔 I wanted to see what that split says about who is selling.
📊 What Happened?
US spot Bitcoin ETFs lost $1.065B in the week of November 9-13, according to SoSoValue. It was their third straight week of outflows and the fifth outflow week in the last six. The week before lost $1.28B, so about $2.35B has left in two weeks. That came as BTC fell to about $62,000 on Sunday, its lowest level since mid-July.
🏦 Who Led It
BlackRock's IBIT: -$909M. Its cumulative net inflow is still $64.19B.Fidelity's FBTC: -$111M, with $10.15B cumulative.Morgan Stanley's MSBT: +$54.3M, leading inflows. It's the newest of the big names, with $837M cumulative.
Total ETF assets are about $86.2B, around 6.2% of Bitcoin's market cap. Ether ETFs lost $399M in the same week, their seventh straight weekly outflow.
🔗 The Wider Picture
The ETFs aren't the only place money is leaving. Stablecoin supply fell about $17B over 30 days, which suggests less cash waiting on the sidelines. One analyst points out that most spot selling is happening on Coinbase, which lines up with the ETF exits. Treasury sellers matter too: MARA alone has sold about 40,600 BTC this year.
📈 Why Flows Matter Both Ways
One analysis credit $1.92B in weekly ETF inflows as a driver of August's 23.5% rally in seven days. Flows can push price up as well as down, which is why the streak is worth tracking.
🛑 What the Flows Don't Prove
A net outflow just means redemptions beat creations. It doesn't say why. Some of it can be hedge or basis-trade unwinds, which aren't bearish bets on Bitcoin. The cumulative total is also still strongly positive at $54.63B, and the funds' assets fell mostly because the price fell. This is pressure, not a collapse.
⚠️ The Risk Scenario
Another billion-dollar week would say the selling isn't fading, and Wednesday's Fed minutes could add fuel. Glassnode flagged a cluster of potential liquidations between $59,500 and $62,600, right where Sunday's low sat. If ETFs keep bleeding while that zone breaks, the pressure builds.
👀 Three Things to Watch Next
Does a fourth straight week of outflows follow?Does IBIT keep leading the exits?Does any fund post a clear inflow day?
💡 The Takeaway
The streak is the signal, more than any single number. I'd watch whether one real inflow day appears before reading anything into a bounce. Until then, the missing ETF bid is the gap I'd worry about most.
If you had to watch one this week, would you pick the weekly ETF total or IBIT's daily flow? And do you think MSBT's inflow is an early sign of a turn or just noise? I'd like to hear how you read it. 👇
That is the part worth watching.
This post is for informational and educational purposes only and is not financial advice. Crypto markets are volatile. Always conduct your own research before making financial decisions.
#BinanceSquare #BitcoinETF #IBIT #Bitcoin #CryptoNews
1
2
181

📉 ETF BLEED — 7 STRAIGHT SESSIONS
$BTC funds: -$185M on Friday. -$1.91 BILLION since Nov 5.
BlackRock IBIT: 11 straight days out, -$143.5M on Friday alone.
BUT — $ETH funds just broke their own streak: +$2.3M inflow Friday, first green day in 7 sessions.
All crypto ETFs combined: -$1.53B last week.
Tonights Monday flows are the next test. Green or red — it decides the week.
Not financial advice. #BitcoinETF #BTC
📉 ETF BLEED — 7 STRAIGHT SESSIONS
$BTC funds: -$185M on Friday. -$1.91 BILLION since Nov 5.
BlackRock IBIT: 11 straight days out, -$143.5M on Friday alone.
BUT — $ETH funds just broke their own streak: +$2.3M inflow Friday, first green day in 7 sessions.
All crypto ETFs combined: -$1.53B last week.
Tonights Monday flows are the next test. Green or red — it decides the week.
Not financial advice. #BitcoinETF #BTC
$BTC funds: -$185M on Friday. -$1.91 BILLION since Nov 5.
BlackRock IBIT: 11 straight days out, -$143.5M on Friday alone.
BUT — $ETH funds just broke their own streak: +$2.3M inflow Friday, first green day in 7 sessions.
All crypto ETFs combined: -$1.53B last week.
Tonights Monday flows are the next test. Green or red — it decides the week.
Not financial advice. #BitcoinETF #BTC
50

·
--
US spot Bitcoin ETFs lost $1.065 billion in one week. The money is still walking out. 📉
Farside Investors data cited by Big5Capital shows US spot Bitcoin funds recorded net outflows of about $1.065 billion across the five sessions from November 9 to 13, extending the outflow streak to seven straight trading days, with the November total now near $2.1 billion. ⚠️ My reading is that institutions are de-risking ahead of Nvidia earnings and the Fed minutes, and until one green flow day appears, every rally is fighting the tape, because real buyers are on the sidelines.
What brings ETF money back first, a Fed pause or a Nvidia beat? 🤔
Follow for more trades.
#Crypto #Bitcoin #FuturesTrading #TradingSignals #BitcoinETF
US spot Bitcoin ETFs lost $1.065 billion in one week. The money is still walking out. 📉
Farside Investors data cited by Big5Capital shows US spot Bitcoin funds recorded net outflows of about $1.065 billion across the five sessions from November 9 to 13, extending the outflow streak to seven straight trading days, with the November total now near $2.1 billion. ⚠️ My reading is that institutions are de-risking ahead of Nvidia earnings and the Fed minutes, and until one green flow day appears, every rally is fighting the tape, because real buyers are on the sidelines.
What brings ETF money back first, a Fed pause or a Nvidia beat? 🤔
Follow for more trades.
#Crypto #Bitcoin #FuturesTrading #TradingSignals #BitcoinETF
Farside Investors data cited by Big5Capital shows US spot Bitcoin funds recorded net outflows of about $1.065 billion across the five sessions from November 9 to 13, extending the outflow streak to seven straight trading days, with the November total now near $2.1 billion. ⚠️ My reading is that institutions are de-risking ahead of Nvidia earnings and the Fed minutes, and until one green flow day appears, every rally is fighting the tape, because real buyers are on the sidelines.
What brings ETF money back first, a Fed pause or a Nvidia beat? 🤔
Follow for more trades.
#Crypto #Bitcoin #FuturesTrading #TradingSignals #BitcoinETF
2
·
--
Bitcoin ETFs lost $2.1 billion in November. Seven straight days of outflows. 📉
The Currency Analytics reports US spot Bitcoin ETFs shed $185.4 million on Friday alone, extending the outflow streak to seven consecutive trading days, with about $1.91 billion withdrawn from November 5 to 13 according to Farside Investors data cited by crypto.news. ⚠️ The November total now stands near $2.1 billion, the worst monthly flow reversal since the summer rally. My reading is that institutions are de-risking ahead of Nvidia earnings and the Fed minutes, and until one green flow day appears, every rally is fighting the tape.
What brings ETF money back first, a Fed pause or a Nvidia beat? 🤔
Follow for more trades.
#Crypto #Bitcoin #FuturesTrading #TradingSignals #BitcoinETF
Bitcoin ETFs lost $2.1 billion in November. Seven straight days of outflows. 📉
The Currency Analytics reports US spot Bitcoin ETFs shed $185.4 million on Friday alone, extending the outflow streak to seven consecutive trading days, with about $1.91 billion withdrawn from November 5 to 13 according to Farside Investors data cited by crypto.news. ⚠️ The November total now stands near $2.1 billion, the worst monthly flow reversal since the summer rally. My reading is that institutions are de-risking ahead of Nvidia earnings and the Fed minutes, and until one green flow day appears, every rally is fighting the tape.
What brings ETF money back first, a Fed pause or a Nvidia beat? 🤔
Follow for more trades.
#Crypto #Bitcoin #FuturesTrading #TradingSignals #BitcoinETF
The Currency Analytics reports US spot Bitcoin ETFs shed $185.4 million on Friday alone, extending the outflow streak to seven consecutive trading days, with about $1.91 billion withdrawn from November 5 to 13 according to Farside Investors data cited by crypto.news. ⚠️ The November total now stands near $2.1 billion, the worst monthly flow reversal since the summer rally. My reading is that institutions are de-risking ahead of Nvidia earnings and the Fed minutes, and until one green flow day appears, every rally is fighting the tape.
What brings ETF money back first, a Fed pause or a Nvidia beat? 🤔
Follow for more trades.
#Crypto #Bitcoin #FuturesTrading #TradingSignals #BitcoinETF
2


Bitcoin: Is Institutional Demand Showing Signs of Weakness?
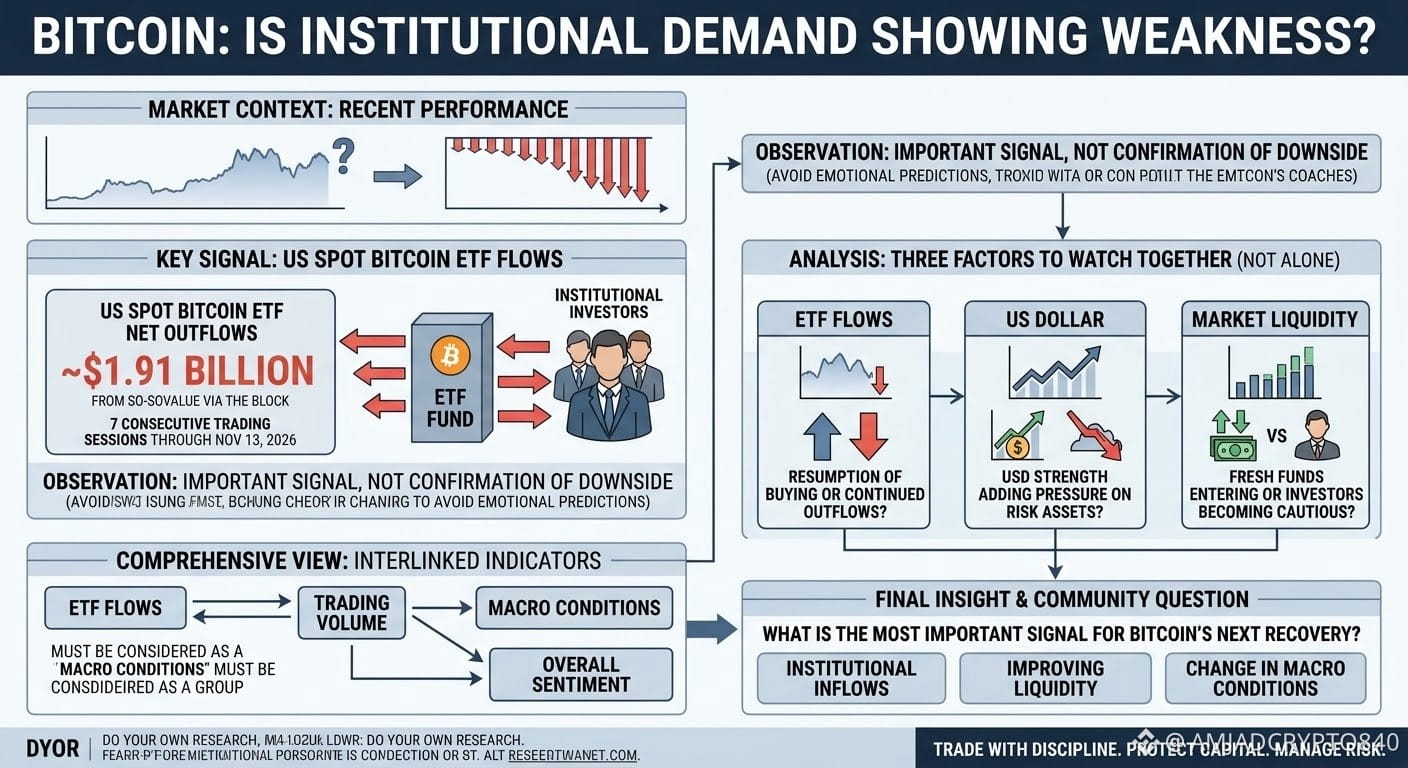
Bitcoin's recent market behavior raises an interesting question: Is institutional demand weakening, or is the market going through a temporary liquidity challenge?
According to data reported by The Block, based on SoSoValue figures, US spot Bitcoin ETFs recorded approximately $1.91 billion in net outflows over seven consecutive trading sessions, through November 13, 2026.
In my personal observation, this is an important market signal, but it should not be interpreted as confirmation of further downside.
Three factors deserve attention:
1. ETF Flows: Will institutional investors resume buying, or will outflows continue?
2. US Dollar: Could continued dollar strength increase pressure on risk assets?
3. Market Liquidity: Are fresh funds entering the crypto market, or are investors becoming more cautious?
I believe no single indicator can explain Bitcoin's entire market direction. ETF flows, trading volume, macroeconomic conditions and overall sentiment should be considered together.
My question to the community: Which factor do you consider the most important signal for Bitcoin's next recovery: institutional inflows, improving liquidity, or a change in macroeconomic conditions?
Let's share research, facts and thoughtful opinions instead of emotional predictions.
Disclaimer: This is an educational post based on my personal observations and understanding of market data. It is not financial or investment advice. Always DYOR (Do Your Own Research) before making any investment or trading decision.
Trade with discipline. Protect your capital. Manage your risk.
#Bitcoin #BTC #BitcoinETF #DYOR
{spot}(BTCUSDT)
Bitcoin: Is Institutional Demand Showing Signs of Weakness?
Bitcoin's recent market behavior raises an interesting question: Is institutional demand weakening, or is the market going through a temporary liquidity challenge?
According to data reported by The Block, based on SoSoValue figures, US spot Bitcoin ETFs recorded approximately $1.91 billion in net outflows over seven consecutive trading sessions, through November 13, 2026.
In my personal observation, this is an important market signal, but it should not be interpreted as confirmation of further downside.
Three factors deserve attention:
1. ETF Flows: Will institutional investors resume buying, or will outflows continue?
2. US Dollar: Could continued dollar strength increase pressure on risk assets?
3. Market Liquidity: Are fresh funds entering the crypto market, or are investors becoming more cautious?
I believe no single indicator can explain Bitcoin's entire market direction. ETF flows, trading volume, macroeconomic conditions and overall sentiment should be considered together.
My question to the community: Which factor do you consider the most important signal for Bitcoin's next recovery: institutional inflows, improving liquidity, or a change in macroeconomic conditions?
Let's share research, facts and thoughtful opinions instead of emotional predictions.
Disclaimer: This is an educational post based on my personal observations and understanding of market data. It is not financial or investment advice. Always DYOR (Do Your Own Research) before making any investment or trading decision.
Trade with discipline. Protect your capital. Manage your risk.
#Bitcoin #BTC #BitcoinETF #DYOR
Bitcoin's recent market behavior raises an interesting question: Is institutional demand weakening, or is the market going through a temporary liquidity challenge?
According to data reported by The Block, based on SoSoValue figures, US spot Bitcoin ETFs recorded approximately $1.91 billion in net outflows over seven consecutive trading sessions, through November 13, 2026.
In my personal observation, this is an important market signal, but it should not be interpreted as confirmation of further downside.
Three factors deserve attention:
1. ETF Flows: Will institutional investors resume buying, or will outflows continue?
2. US Dollar: Could continued dollar strength increase pressure on risk assets?
3. Market Liquidity: Are fresh funds entering the crypto market, or are investors becoming more cautious?
I believe no single indicator can explain Bitcoin's entire market direction. ETF flows, trading volume, macroeconomic conditions and overall sentiment should be considered together.
My question to the community: Which factor do you consider the most important signal for Bitcoin's next recovery: institutional inflows, improving liquidity, or a change in macroeconomic conditions?
Let's share research, facts and thoughtful opinions instead of emotional predictions.
Disclaimer: This is an educational post based on my personal observations and understanding of market data. It is not financial or investment advice. Always DYOR (Do Your Own Research) before making any investment or trading decision.
Trade with discipline. Protect your capital. Manage your risk.
#Bitcoin #BTC #BitcoinETF #DYOR
1
265

·
--
BITCOIN BOUNCED — BUT IS THE MARKET'S CASH FLOW BACK?
Bitcoin recently dropped to around $62,006 before rebounding toward $65,925. But a price bounce doesn't automatically mean market conditions have recovered.
Here's what deserves attention:
📉 ETF outflows: US spot Bitcoin ETFs recorded approximately $1.065 billion in net outflows from November 9–13. Farside's data shows withdrawals on all five trading sessions that week, extending a seven-session outflow streak.
💵 Stablecoin liquidity: BeInCrypto, citing Lookonchain and Glassnode data, reported five consecutive weeks of declining stablecoin supply and a $17.1 billion contraction over 30 days.
⚖️ Spot vs. leverage: Its analysis also found spot DEX volume falling about 18% while perpetual futures volume increased about 7% over the six weeks to November 8.
These signals don't prove that any single factor caused Bitcoin's decline. But together, they raise an important question: is fresh buying power returning, or are traders simply reacting to a short-term rebound?
My perspective: A sustainable recovery needs more than a green candle. Watch for ETF inflows returning, stablecoin liquidity stabilizing, and stronger spot-market participation.
💬 What would convince you that Bitcoin's recovery is becoming stronger: ETF inflows, stablecoin supply growth, or increasing spot volume?
#Bitcoin #CryptoMarkets #BitcoinETF #Stablecoins #MarketLiquidity $BTC
BITCOIN BOUNCED — BUT IS THE MARKET'S CASH FLOW BACK?
Bitcoin recently dropped to around $62,006 before rebounding toward $65,925. But a price bounce doesn't automatically mean market conditions have recovered.
Here's what deserves attention:
📉 ETF outflows: US spot Bitcoin ETFs recorded approximately $1.065 billion in net outflows from November 9–13. Farside's data shows withdrawals on all five trading sessions that week, extending a seven-session outflow streak.
💵 Stablecoin liquidity: BeInCrypto, citing Lookonchain and Glassnode data, reported five consecutive weeks of declining stablecoin supply and a $17.1 billion contraction over 30 days.
⚖️ Spot vs. leverage: Its analysis also found spot DEX volume falling about 18% while perpetual futures volume increased about 7% over the six weeks to November 8.
These signals don't prove that any single factor caused Bitcoin's decline. But together, they raise an important question: is fresh buying power returning, or are traders simply reacting to a short-term rebound?
My perspective: A sustainable recovery needs more than a green candle. Watch for ETF inflows returning, stablecoin liquidity stabilizing, and stronger spot-market participation.
💬 What would convince you that Bitcoin's recovery is becoming stronger: ETF inflows, stablecoin supply growth, or increasing spot volume?
#Bitcoin #CryptoMarkets #BitcoinETF #Stablecoins #MarketLiquidity $BTC
Bitcoin recently dropped to around $62,006 before rebounding toward $65,925. But a price bounce doesn't automatically mean market conditions have recovered.
Here's what deserves attention:
📉 ETF outflows: US spot Bitcoin ETFs recorded approximately $1.065 billion in net outflows from November 9–13. Farside's data shows withdrawals on all five trading sessions that week, extending a seven-session outflow streak.
💵 Stablecoin liquidity: BeInCrypto, citing Lookonchain and Glassnode data, reported five consecutive weeks of declining stablecoin supply and a $17.1 billion contraction over 30 days.
⚖️ Spot vs. leverage: Its analysis also found spot DEX volume falling about 18% while perpetual futures volume increased about 7% over the six weeks to November 8.
These signals don't prove that any single factor caused Bitcoin's decline. But together, they raise an important question: is fresh buying power returning, or are traders simply reacting to a short-term rebound?
My perspective: A sustainable recovery needs more than a green candle. Watch for ETF inflows returning, stablecoin liquidity stabilizing, and stronger spot-market participation.
💬 What would convince you that Bitcoin's recovery is becoming stronger: ETF inflows, stablecoin supply growth, or increasing spot volume?
#Bitcoin #CryptoMarkets #BitcoinETF #Stablecoins #MarketLiquidity $BTC

104
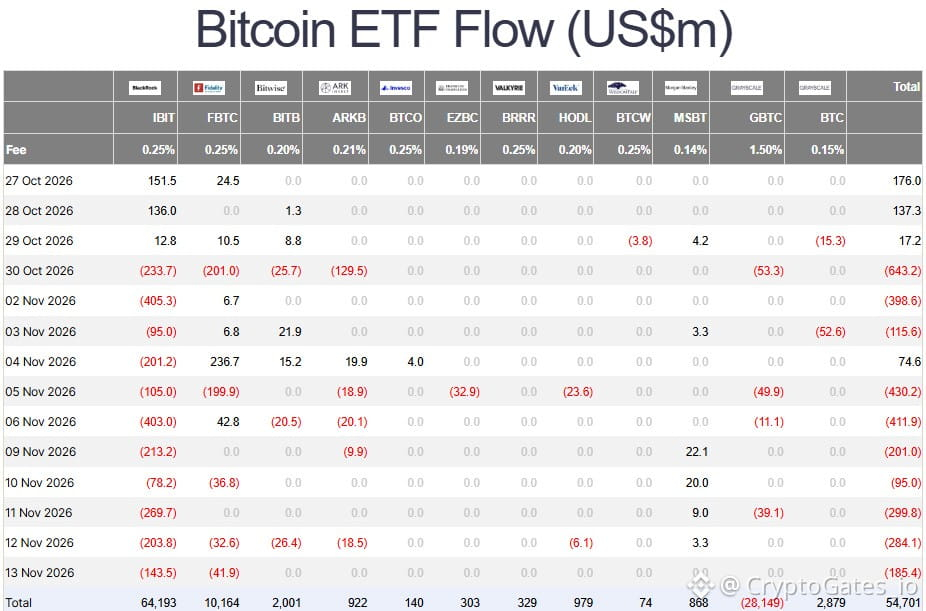
$BTC ETF Flows: The Data Behind the Dip 📉
US spot BTC ETFs recorded $1.07B in net outflows during Nov 9-13, after $1.28B the week before. That’s $2.35B out in two weeks.
Only one positive session in the last eleven (+$74.6M on Nov 4). The largest fund posted 11 consecutive outflow days. Before that, Oct 27-29 had roughly $330M in inflows, so the shift was sharp.
BTC printed a low of 62,006 and is trading near 64.5K.
What it means: ETF demand was a steady bid. When it turns into net redemptions, dip support thins out.
Scenarios to track:
Flows stabilize and 62K holds: base-building phase
Outflows continue and 62K breaks: 60K comes into focus
One day of inflows is not a trend change. Verify first. Risk later. Scale slowly.
#BTC #BitcoinETF
$BTC ETF Flows: The Data Behind the Dip 📉
US spot BTC ETFs recorded $1.07B in net outflows during Nov 9-13, after $1.28B the week before. That’s $2.35B out in two weeks.
Only one positive session in the last eleven (+$74.6M on Nov 4). The largest fund posted 11 consecutive outflow days. Before that, Oct 27-29 had roughly $330M in inflows, so the shift was sharp.
BTC printed a low of 62,006 and is trading near 64.5K.
What it means: ETF demand was a steady bid. When it turns into net redemptions, dip support thins out.
Scenarios to track:
Flows stabilize and 62K holds: base-building phase
Outflows continue and 62K breaks: 60K comes into focus
One day of inflows is not a trend change. Verify first. Risk later. Scale slowly.
#BTC #BitcoinETF
US spot BTC ETFs recorded $1.07B in net outflows during Nov 9-13, after $1.28B the week before. That’s $2.35B out in two weeks.
Only one positive session in the last eleven (+$74.6M on Nov 4). The largest fund posted 11 consecutive outflow days. Before that, Oct 27-29 had roughly $330M in inflows, so the shift was sharp.
BTC printed a low of 62,006 and is trading near 64.5K.
What it means: ETF demand was a steady bid. When it turns into net redemptions, dip support thins out.
Scenarios to track:
Flows stabilize and 62K holds: base-building phase
Outflows continue and 62K breaks: 60K comes into focus
One day of inflows is not a trend change. Verify first. Risk later. Scale slowly.
#BTC #BitcoinETF
93
·
--
US Bitcoin ETFs reopen Monday after 1.91 billion dollars left in seven sessions. 📰
Farside Investors data reported by crypto.news shows US spot Bitcoin ETFs recorded about 1.91 billion dollars in net withdrawals across seven straight trading sessions from November 5 to 13, with Friday alone at minus 185.4 million dollars, including 143.5 million from BlackRock IBIT. ⚠️ SoSoValue data cited by Corgano puts the two week total at 2.35 billion dollars, the largest two week outflow since early June, and cumulative net inflows since launch have fallen from 57 billion to about 54.6 billion. My reading is that Monday's flow print is the most important number of the week, because an end to the outflow streak is the clearest sign institutional selling is easing.
Do ETF flows turn positive on Monday, or does the seventh session streak become eight? 🤔
Follow for more trades.
#Crypto #Bitcoin #FuturesTrading #TradingSignals #BitcoinETF
US Bitcoin ETFs reopen Monday after 1.91 billion dollars left in seven sessions. 📰
Farside Investors data reported by crypto.news shows US spot Bitcoin ETFs recorded about 1.91 billion dollars in net withdrawals across seven straight trading sessions from November 5 to 13, with Friday alone at minus 185.4 million dollars, including 143.5 million from BlackRock IBIT. ⚠️ SoSoValue data cited by Corgano puts the two week total at 2.35 billion dollars, the largest two week outflow since early June, and cumulative net inflows since launch have fallen from 57 billion to about 54.6 billion. My reading is that Monday's flow print is the most important number of the week, because an end to the outflow streak is the clearest sign institutional selling is easing.
Do ETF flows turn positive on Monday, or does the seventh session streak become eight? 🤔
Follow for more trades.
#Crypto #Bitcoin #FuturesTrading #TradingSignals #BitcoinETF
Farside Investors data reported by crypto.news shows US spot Bitcoin ETFs recorded about 1.91 billion dollars in net withdrawals across seven straight trading sessions from November 5 to 13, with Friday alone at minus 185.4 million dollars, including 143.5 million from BlackRock IBIT. ⚠️ SoSoValue data cited by Corgano puts the two week total at 2.35 billion dollars, the largest two week outflow since early June, and cumulative net inflows since launch have fallen from 57 billion to about 54.6 billion. My reading is that Monday's flow print is the most important number of the week, because an end to the outflow streak is the clearest sign institutional selling is easing.
Do ETF flows turn positive on Monday, or does the seventh session streak become eight? 🤔
Follow for more trades.
#Crypto #Bitcoin #FuturesTrading #TradingSignals #BitcoinETF


·
--

Article
Bitcoin ETFs Lose $2.35 Billion in Two Weeks as Withdrawals ContinueWall Street’s Bitcoin investment funds are experiencing a sustained withdrawal streak. U.S. spot Bitcoin exchange-traded funds (ETFs) recorded roughly $2.35 billion in net outflows across two weeks, raising fresh questions about investor demand for crypto exposure.
The latest week, November 9–13, accounted for about $1.07 billion of those withdrawals, according to Farside Investors’ fund-flow data. Friday alone saw $185.4 million in net outflows, led by BlackRock’s IBIT at $143.5 million and Fidelity’s FBTC at $41.9 million. That marked seven consecutive trading days of net withdrawals.
Why does this matter? Spot Bitcoin ETFs allow investors to gain exposure to Bitcoin through regular brokerage accounts without handling the cryptocurrency directly. When money consistently leaves these funds, it signals reduced demand for these investment products—but it does not reveal every investor’s motive or guarantee a fall in Bitcoin’s price.
The next important checkpoint is the U.S. trading session on Monday, November 16, when new ETF flow figures become available. Will withdrawals continue, or will demand stabilize? The data, not speculation, will provide the clearer signal.#Bitcoin #BitcoinETF #CryptoNew #BTC #InstitutionalCrypt
Bitcoin ETFs Lose $2.35 Billion in Two Weeks as Withdrawals Continue
Wall Street’s Bitcoin investment funds are experiencing a sustained withdrawal streak. U.S. spot Bitcoin exchange-traded funds (ETFs) recorded roughly $2.35 billion in net outflows across two weeks, raising fresh questions about investor demand for crypto exposure.
The latest week, November 9–13, accounted for about $1.07 billion of those withdrawals, according to Farside Investors’ fund-flow data. Friday alone saw $185.4 million in net outflows, led by BlackRock’s IBIT at $143.5 million and Fidelity’s FBTC at $41.9 million. That marked seven consecutive trading days of net withdrawals.
Why does this matter? Spot Bitcoin ETFs allow investors to gain exposure to Bitcoin through regular brokerage accounts without handling the cryptocurrency directly. When money consistently leaves these funds, it signals reduced demand for these investment products—but it does not reveal every investor’s motive or guarantee a fall in Bitcoin’s price.
The next important checkpoint is the U.S. trading session on Monday, November 16, when new ETF flow figures become available. Will withdrawals continue, or will demand stabilize? The data, not speculation, will provide the clearer signal.#Bitcoin #BitcoinETF #CryptoNew #BTC #InstitutionalCrypt
The latest week, November 9–13, accounted for about $1.07 billion of those withdrawals, according to Farside Investors’ fund-flow data. Friday alone saw $185.4 million in net outflows, led by BlackRock’s IBIT at $143.5 million and Fidelity’s FBTC at $41.9 million. That marked seven consecutive trading days of net withdrawals.
Why does this matter? Spot Bitcoin ETFs allow investors to gain exposure to Bitcoin through regular brokerage accounts without handling the cryptocurrency directly. When money consistently leaves these funds, it signals reduced demand for these investment products—but it does not reveal every investor’s motive or guarantee a fall in Bitcoin’s price.
The next important checkpoint is the U.S. trading session on Monday, November 16, when new ETF flow figures become available. Will withdrawals continue, or will demand stabilize? The data, not speculation, will provide the clearer signal.#Bitcoin #BitcoinETF #CryptoNew #BTC #InstitutionalCrypt
106

🏦 Bitcoin ETFs Keep Bleeding While Stock ETFs Soak Up the Dip
What happened: US spot Bitcoin ETFs had lost about $1.6B in net outflows in November through Nov 10, per SoSoValue. Over the same five sessions, all 17 of the top US ETFs by inflows were equity funds. Outflows had eased for three straight sessions, but no sustained return of demand has shown up.
Why it matters now: ETF demand was a key support for BTC. With equities taking the dip-buying flows, crypto lacks a big spot bid. That helps explain why leveraged longs were so exposed this week.
What to watch next:
• Monday's ETF flow print after the weekend crash
• Whether outflows accelerate, or dip buyers return near $62K–$65K
$BTC
#BitcoinETF #ETFFlows #Bitcoin #Institutional
🏦 Bitcoin ETFs Keep Bleeding While Stock ETFs Soak Up the Dip
What happened: US spot Bitcoin ETFs had lost about $1.6B in net outflows in November through Nov 10, per SoSoValue. Over the same five sessions, all 17 of the top US ETFs by inflows were equity funds. Outflows had eased for three straight sessions, but no sustained return of demand has shown up.
Why it matters now: ETF demand was a key support for BTC. With equities taking the dip-buying flows, crypto lacks a big spot bid. That helps explain why leveraged longs were so exposed this week.
What to watch next:
• Monday's ETF flow print after the weekend crash
• Whether outflows accelerate, or dip buyers return near $62K–$65K
$BTC
#BitcoinETF #ETFFlows #Bitcoin #Institutional
What happened: US spot Bitcoin ETFs had lost about $1.6B in net outflows in November through Nov 10, per SoSoValue. Over the same five sessions, all 17 of the top US ETFs by inflows were equity funds. Outflows had eased for three straight sessions, but no sustained return of demand has shown up.
Why it matters now: ETF demand was a key support for BTC. With equities taking the dip-buying flows, crypto lacks a big spot bid. That helps explain why leveraged longs were so exposed this week.
What to watch next:
• Monday's ETF flow print after the weekend crash
• Whether outflows accelerate, or dip buyers return near $62K–$65K
$BTC
#BitcoinETF #ETFFlows #Bitcoin #Institutional
92

Massive November ETF Outflows Accelerate
Spot Bitcoin ETFs saw $2.1B in total net outflows throughout November as the streak of daily outflows hit 7 days.
#BitcoinETF #InstitutionalFlows
Massive November ETF Outflows Accelerate
Spot Bitcoin ETFs saw $2.1B in total net outflows throughout November as the streak of daily outflows hit 7 days.
#BitcoinETF #InstitutionalFlows
Spot Bitcoin ETFs saw $2.1B in total net outflows throughout November as the streak of daily outflows hit 7 days.
#BitcoinETF #InstitutionalFlows

87
📉 ETF BLEED — 7 STRAIGHT SESSIONS
$BTC funds: -$1.91 BILLION since Nov 5. -$1.07B this week alone.
BlackRock IBIT: 11 straight days of outflows, -$908M this week.
$ETH funds: -$399M this week too.
Two-week total: ~$2.35B gone.
US markets are closed for the weekend — Mondays flows are the next test.
Institutions arent buying this dip. Yet.
Not financial advice. #BitcoinETF #BTC
📉 ETF BLEED — 7 STRAIGHT SESSIONS
$BTC funds: -$1.91 BILLION since Nov 5. -$1.07B this week alone.
BlackRock IBIT: 11 straight days of outflows, -$908M this week.
$ETH funds: -$399M this week too.
Two-week total: ~$2.35B gone.
US markets are closed for the weekend — Mondays flows are the next test.
Institutions arent buying this dip. Yet.
Not financial advice. #BitcoinETF #BTC
$BTC funds: -$1.91 BILLION since Nov 5. -$1.07B this week alone.
BlackRock IBIT: 11 straight days of outflows, -$908M this week.
$ETH funds: -$399M this week too.
Two-week total: ~$2.35B gone.
US markets are closed for the weekend — Mondays flows are the next test.
Institutions arent buying this dip. Yet.
Not financial advice. #BitcoinETF #BTC
Crypto Scientist Expert44:
i follows you sweet brothers and sisters please follows me back........plzzz follows me all sweet guyzzzz......❤️❤️😘😘🌹🌹
1
38

·
--
🚨 Bitcoin ETFs: $1.07B Outflow Reported! 🚨
BTC is down 2.65% today. Puts are heating up 🔥
📉 BTC-261127-60000-P → +111.9%
📉 BTC-261120-62000-P → +169.2%
Traders seem to be hedging for more downside. Note: this is likely a net outflow, not BlackRock dumping coins.
⚠️ High risk. DYOR.
Will outflows continue this week? 👇
#Bitcoin #BitcoinETF #Options #Binance #BinanceSquare $BTC
{future}(BTCUSDT)
$ETFT.ETF
{etf_us}(ETFT.ETF)
🚨 Bitcoin ETFs: $1.07B Outflow Reported! 🚨
BTC is down 2.65% today. Puts are heating up 🔥
📉 BTC-261127-60000-P → +111.9%
📉 BTC-261120-62000-P → +169.2%
Traders seem to be hedging for more downside. Note: this is likely a net outflow, not BlackRock dumping coins.
⚠️ High risk. DYOR.
Will outflows continue this week? 👇
#Bitcoin #BitcoinETF #Options #Binance #BinanceSquare $BTC
$ETFT.ETF
BTC is down 2.65% today. Puts are heating up 🔥
📉 BTC-261127-60000-P → +111.9%
📉 BTC-261120-62000-P → +169.2%
Traders seem to be hedging for more downside. Note: this is likely a net outflow, not BlackRock dumping coins.
⚠️ High risk. DYOR.
Will outflows continue this week? 👇
#Bitcoin #BitcoinETF #Options #Binance #BinanceSquare $BTC
$ETFT.ETF
4
144

JPMorgan’s latest 13F filing shows roughly $981 million in crypto-linked holdings as of September 30, including about $549 million in spot Bitcoin ETFs (led by BlackRock’s IBIT) and a 36% increase in its Strategy shares. The total likely exceeds $1 billion when including related positions in Coinbase and miners.
$JPMB $IBIT.ETF $BTC #CoinVahini #JPMorgan #BitcoinETF #InstitutionalCrypto
JPMorgan’s latest 13F filing shows roughly $981 million in crypto-linked holdings as of September 30, including about $549 million in spot Bitcoin ETFs (led by BlackRock’s IBIT) and a 36% increase in its Strategy shares. The total likely exceeds $1 billion when including related positions in Coinbase and miners.
$JPMB $IBIT.ETF $BTC #CoinVahini #JPMorgan #BitcoinETF #InstitutionalCrypto
$JPMB $IBIT.ETF $BTC #CoinVahini #JPMorgan #BitcoinETF #InstitutionalCrypto
8
Log in to explore more content
Join global crypto users on Binance Square
⚡️ Get latest and useful information about crypto.
💬 Trusted by the world’s largest crypto exchange.
👍 Discover real insights from verified creators.
Email / Phone number
Trending Topics
1
#A Packed Week of Earnings and Data Tests Markets
77,959 views
471 Discussing
2
#AnthropicIPOTestsInvestorAppetiteForAI
151,897 views
1,641 Discussing
3
#NvidiaBoardNotConsideringHuang’sReturnasCEO
10,635 views
167 Discussing
4
#WhatInvestmentSignalsDo13FFilingsReveal?
6,449 views
121 Discussing
5
#InvescoStablecoinReservesFundLaunchesOnEthereum
2,147 views
53 Discussing
6
#CypherpunkReports$306MQ3NetProfit
600 views
9 Discussing
7
#OPTIMJACKAttackInfectsAtLeast186Websites
4,740 views
92 Discussing
8
#StrategySells2.09MMSTRSharesFor$244.7M
1,971 views
17 Discussing
9
#StablecoinMarketShrinksAtFastestPaceSinceTerraLuna
6,090 views
67 Discussing
10
#BitcoinExtendsLosingStreakToSixWeeks
117,456 views
844 Discussing