

#btcpriceforecast
btcpriceforecast
668,317 views
413 Discussing
Hot
Latest

·
--
Bearish
Every one thinks btc make high but mark my words btc is ready to gone down from 83100
Put short entries on btc at 83100-83500
Put Sl according to your account size if you afford put above 86000
#btc #BTCPriceForecast
Every one thinks btc make high but mark my words btc is ready to gone down from 83100
Put short entries on btc at 83100-83500
Put Sl according to your account size if you afford put above 86000
#btc #BTCPriceForecast
Put short entries on btc at 83100-83500
Put Sl according to your account size if you afford put above 86000
#btc #BTCPriceForecast
98

·
--
🚀 $BTC Reclaims $83,000! Bullish Shift or Relief Bounce? 📊
Hello Binancians! Bitcoin is making headlines today as it successfully rebounds from its local low of $80,350 to trade back around the $82,500 – $83,000 zone. Despite over $1 Billion in liquidations hitting leveraged long positions over the past 48 hours, buyers have stepped in aggressively to defend critical macro support.
🔥 Trending Market Drivers Today:
🦅 Midterm Geopolitics: President Trump's latest statement ruling out pre-midterm strikes on Iran has temporarily cooled down Brent crude oil prices. This drop in energy-driven inflation pressure is giving crypto markets a sigh of relief.
💼 ETF Outflows & CPI Anticipation: Institutional traders are trading with high caution ahead of the upcoming U.S. CPI Inflation release on October 14, especially after seeing a combined $729 Million in two-day spot ETF outflows.
🔒 Wallet Security Fears: On-chain sentiment faced mild panic earlier today following reports of stolen funds related to Ledger cold wallet hardware purchased via unauthorized third-party resellers.
🔍 Key Technical Levels to Watch:
Immediate Support: $81,300 – $80,700. Bulls must maintain daily closes above this baseline to invalidate a deeper flush toward $78,000.
Crucial Resistance: $84,000 – $84,450. Bitcoin requires a high-volume breakout past this zone to fully reverse the short-term bearish pressure and eye higher targets.
⚠️ Risk Warning: Market volatility remains heavily elevated. Always protect your trading capital using a proper Stop Loss. Do Your Own Research (DYOR)!
#BTCPriceForecast #CryptoNew #CryptoNewss s #MarketUpdate
🚀 $BTC Reclaims $83,000! Bullish Shift or Relief Bounce? 📊
Hello Binancians! Bitcoin is making headlines today as it successfully rebounds from its local low of $80,350 to trade back around the $82,500 – $83,000 zone. Despite over $1 Billion in liquidations hitting leveraged long positions over the past 48 hours, buyers have stepped in aggressively to defend critical macro support.
🔥 Trending Market Drivers Today:
🦅 Midterm Geopolitics: President Trump's latest statement ruling out pre-midterm strikes on Iran has temporarily cooled down Brent crude oil prices. This drop in energy-driven inflation pressure is giving crypto markets a sigh of relief.
💼 ETF Outflows & CPI Anticipation: Institutional traders are trading with high caution ahead of the upcoming U.S. CPI Inflation release on October 14, especially after seeing a combined $729 Million in two-day spot ETF outflows.
🔒 Wallet Security Fears: On-chain sentiment faced mild panic earlier today following reports of stolen funds related to Ledger cold wallet hardware purchased via unauthorized third-party resellers.
🔍 Key Technical Levels to Watch:
Immediate Support: $81,300 – $80,700. Bulls must maintain daily closes above this baseline to invalidate a deeper flush toward $78,000.
Crucial Resistance: $84,000 – $84,450. Bitcoin requires a high-volume breakout past this zone to fully reverse the short-term bearish pressure and eye higher targets.
⚠️ Risk Warning: Market volatility remains heavily elevated. Always protect your trading capital using a proper Stop Loss. Do Your Own Research (DYOR)!
#BTCPriceForecast #CryptoNew #CryptoNewss s #MarketUpdate
Hello Binancians! Bitcoin is making headlines today as it successfully rebounds from its local low of $80,350 to trade back around the $82,500 – $83,000 zone. Despite over $1 Billion in liquidations hitting leveraged long positions over the past 48 hours, buyers have stepped in aggressively to defend critical macro support.
🔥 Trending Market Drivers Today:
🦅 Midterm Geopolitics: President Trump's latest statement ruling out pre-midterm strikes on Iran has temporarily cooled down Brent crude oil prices. This drop in energy-driven inflation pressure is giving crypto markets a sigh of relief.
💼 ETF Outflows & CPI Anticipation: Institutional traders are trading with high caution ahead of the upcoming U.S. CPI Inflation release on October 14, especially after seeing a combined $729 Million in two-day spot ETF outflows.
🔒 Wallet Security Fears: On-chain sentiment faced mild panic earlier today following reports of stolen funds related to Ledger cold wallet hardware purchased via unauthorized third-party resellers.
🔍 Key Technical Levels to Watch:
Immediate Support: $81,300 – $80,700. Bulls must maintain daily closes above this baseline to invalidate a deeper flush toward $78,000.
Crucial Resistance: $84,000 – $84,450. Bitcoin requires a high-volume breakout past this zone to fully reverse the short-term bearish pressure and eye higher targets.
⚠️ Risk Warning: Market volatility remains heavily elevated. Always protect your trading capital using a proper Stop Loss. Do Your Own Research (DYOR)!
#BTCPriceForecast #CryptoNew #CryptoNewss s #MarketUpdate
56

·
--
Bullish
Simple $BTC setup most people are missing:
- Higher low holding
- Volume starting to come back
- Liquidity sitting just above
This is the type of structure that pays when it breaks.
Don’t just watch the chart — trade it.
Click $BTC → set your levels → manage risk.
Who’s taking this one?
{spot}(BTCUSDT)
#BTCPriceForecast
Simple $BTC setup most people are missing:
- Higher low holding
- Volume starting to come back
- Liquidity sitting just above
This is the type of structure that pays when it breaks.
Don’t just watch the chart — trade it.
Click $BTC → set your levels → manage risk.
Who’s taking this one?
#BTCPriceForecast
- Higher low holding
- Volume starting to come back
- Liquidity sitting just above
This is the type of structure that pays when it breaks.
Don’t just watch the chart — trade it.
Click $BTC → set your levels → manage risk.
Who’s taking this one?
#BTCPriceForecast
1
71

💡 Holding Through Dips Is Only Half The Skill. Riding Gains Is The Other Half.
Most people learn one. Few master both. 👀
The Uncomfortable Truth:
💎 Everyone claims diamond hands on the way down
😰 But panic sells too early on the way up
💀 Both kill your returns equally
📊 My Current BTC Take:
❌ BTC hitting $70K in June?
I don't see it happening. 🎯
Macro conditions, liquidity environment, and current structure don't support that timeline in my view.
But here's what matters more:
✅ Know your entry
✅ Know your exit
✅ Have a plan for both directions
Conviction works both ways. 💪
⚠️ DYOR — Not financial advice.
#Bitcoin #BTC #CryptoTrading #TradingMindset #BTCPriceForecast
💡 Holding Through Dips Is Only Half The Skill. Riding Gains Is The Other Half.
Most people learn one. Few master both. 👀
The Uncomfortable Truth:
💎 Everyone claims diamond hands on the way down
😰 But panic sells too early on the way up
💀 Both kill your returns equally
📊 My Current BTC Take:
❌ BTC hitting $70K in June?
I don't see it happening. 🎯
Macro conditions, liquidity environment, and current structure don't support that timeline in my view.
But here's what matters more:
✅ Know your entry
✅ Know your exit
✅ Have a plan for both directions
Conviction works both ways. 💪
⚠️ DYOR — Not financial advice.
#Bitcoin #BTC #CryptoTrading #TradingMindset #BTCPriceForecast
Most people learn one. Few master both. 👀
The Uncomfortable Truth:
💎 Everyone claims diamond hands on the way down
😰 But panic sells too early on the way up
💀 Both kill your returns equally
📊 My Current BTC Take:
❌ BTC hitting $70K in June?
I don't see it happening. 🎯
Macro conditions, liquidity environment, and current structure don't support that timeline in my view.
But here's what matters more:
✅ Know your entry
✅ Know your exit
✅ Have a plan for both directions
Conviction works both ways. 💪
⚠️ DYOR — Not financial advice.
#Bitcoin #BTC #CryptoTrading #TradingMindset #BTCPriceForecast
112

·
--
Bullish
🐋 Whales have reportedly moved 49,000 $BTC to exchanges. Is Bitcoin preparing for another leg down?
Large transfers to exchanges often grab attention because they can signal an intention to sell. With Bitcoin struggling to hold the $60,000 support level, some traders are now watching $53,000 as the next major support if the current level breaks.
That said, it's important not to jump to conclusions. Not every whale deposit leads to a sell-off. Some large holders move funds for liquidity, OTC transactions, or portfolio management.
Right now, the market is at a critical point. If buyers successfully defend the $60K zone, Bitcoin could regain momentum and squeeze short sellers. But if that support fails, volatility could increase quickly as traders react to the breakdown.
The next few trading sessions may determine whether this is just another shakeout—or the start of a deeper correction.
Do you think Bitcoin holds $60K, or are we heading toward $53K next? 👇
#Bitcoin #BTCPriceForecast #Crypto #Trading #Markets
🐋 Whales have reportedly moved 49,000 $BTC to exchanges. Is Bitcoin preparing for another leg down?
Large transfers to exchanges often grab attention because they can signal an intention to sell. With Bitcoin struggling to hold the $60,000 support level, some traders are now watching $53,000 as the next major support if the current level breaks.
That said, it's important not to jump to conclusions. Not every whale deposit leads to a sell-off. Some large holders move funds for liquidity, OTC transactions, or portfolio management.
Right now, the market is at a critical point. If buyers successfully defend the $60K zone, Bitcoin could regain momentum and squeeze short sellers. But if that support fails, volatility could increase quickly as traders react to the breakdown.
The next few trading sessions may determine whether this is just another shakeout—or the start of a deeper correction.
Do you think Bitcoin holds $60K, or are we heading toward $53K next? 👇
#Bitcoin #BTCPriceForecast #Crypto #Trading #Markets
Large transfers to exchanges often grab attention because they can signal an intention to sell. With Bitcoin struggling to hold the $60,000 support level, some traders are now watching $53,000 as the next major support if the current level breaks.
That said, it's important not to jump to conclusions. Not every whale deposit leads to a sell-off. Some large holders move funds for liquidity, OTC transactions, or portfolio management.
Right now, the market is at a critical point. If buyers successfully defend the $60K zone, Bitcoin could regain momentum and squeeze short sellers. But if that support fails, volatility could increase quickly as traders react to the breakdown.
The next few trading sessions may determine whether this is just another shakeout—or the start of a deeper correction.
Do you think Bitcoin holds $60K, or are we heading toward $53K next? 👇
#Bitcoin #BTCPriceForecast #Crypto #Trading #Markets
1
4
1.5k
BTC/USDTBTC/USDT Technical Analysis (Based on Your Daily Chart)
#Bitcoin$60K$70KRangeHits307DayConsolidation
#BTCPriceForecast
#btc70k
#BitcoinRetestsKeyResistanceAt$64400
#BTC🔥🔥🔥🔥🔥
Current Price: ~$63,950
Timeframe: 1D (Daily)
Bullish Signals 📈
Price is above the Bollinger Band middle line (MB 61,868), showing buyers are gaining control.
MACD bullish crossover:
DIF: -456
DEA: -1055
MACD Histogram: +599
Momentum is improving after the recent bottom around $57,800.
RSI(6): 64
Strong but not yet extremely overbought.
Recent candles show a recovery from the downtrend.
Bearish Signals 📉
Stochastic RSI: 84.89
Williams %R: -10.84
Both indicate BTC is approaching overbought territory.
Bollinger upper band is near $65,315, which may act as immediate resistance.
Key Levels
Resistance
$65,300 (Bollinger Upper Band)
$67,000 – $68,500
$72,000+ if momentum accelerates
Support
$61,800 (Bollinger Middle Band)
$60,000 psychological support
$57,800 major swing low
Next 24–72 Hours Prediction
Bullish Scenario (60% Probability)
BTC holds above $61,800
Breaks $65,300
Targets:
$66,500
$68,000
$70,000
Bearish Scenario (40% Probability)
Rejection at $65,300
Pullback toward:
$62,000
$60,500
Worst case $57,800
Trading Plan
Long Setup
Entry: $62,500–63,500
Stop Loss: $60,800
Targets:
TP1: $65,300
TP2: $68,000
TP3: $70,000
Short Setup
Only if BTC fails at $65,300–66,000
Targets:
$62,000
$60,500
Overall View
The daily chart has shifted from bearish to short-term bullish. MACD and RSI support further upside, but overbought oscillators suggest a pullback could occur before a larger move. As long as BTC remains above $61,800, the path of least resistance is toward $66k–68k.
My 7-day target range: $66,000–$69,000
Invalidation: Daily close below $61,800.
$BTC
{spot}(BTCUSDT)
BTC/USDT
BTC/USDT Technical Analysis (Based on Your Daily Chart)
#Bitcoin$60K$70KRangeHits307DayConsolidation
#BTCPriceForecast
#btc70k
#BitcoinRetestsKeyResistanceAt$64400
#BTC🔥🔥🔥🔥🔥
Current Price: ~$63,950
Timeframe: 1D (Daily)
Bullish Signals 📈
Price is above the Bollinger Band middle line (MB 61,868), showing buyers are gaining control.
MACD bullish crossover:
DIF: -456
DEA: -1055
MACD Histogram: +599
Momentum is improving after the recent bottom around $57,800.
RSI(6): 64
Strong but not yet extremely overbought.
Recent candles show a recovery from the downtrend.
Bearish Signals 📉
Stochastic RSI: 84.89
Williams %R: -10.84
Both indicate BTC is approaching overbought territory.
Bollinger upper band is near $65,315, which may act as immediate resistance.
Key Levels
Resistance
$65,300 (Bollinger Upper Band)
$67,000 – $68,500
$72,000+ if momentum accelerates
Support
$61,800 (Bollinger Middle Band)
$60,000 psychological support
$57,800 major swing low
Next 24–72 Hours Prediction
Bullish Scenario (60% Probability)
BTC holds above $61,800
Breaks $65,300
Targets:
$66,500
$68,000
$70,000
Bearish Scenario (40% Probability)
Rejection at $65,300
Pullback toward:
$62,000
$60,500
Worst case $57,800
Trading Plan
Long Setup
Entry: $62,500–63,500
Stop Loss: $60,800
Targets:
TP1: $65,300
TP2: $68,000
TP3: $70,000
Short Setup
Only if BTC fails at $65,300–66,000
Targets:
$62,000
$60,500
Overall View
The daily chart has shifted from bearish to short-term bullish. MACD and RSI support further upside, but overbought oscillators suggest a pullback could occur before a larger move. As long as BTC remains above $61,800, the path of least resistance is toward $66k–68k.
My 7-day target range: $66,000–$69,000
Invalidation: Daily close below $61,800.
$BTC
#Bitcoin$60K$70KRangeHits307DayConsolidation
#BTCPriceForecast
#btc70k
#BitcoinRetestsKeyResistanceAt$64400
#BTC🔥🔥🔥🔥🔥
Current Price: ~$63,950
Timeframe: 1D (Daily)
Bullish Signals 📈
Price is above the Bollinger Band middle line (MB 61,868), showing buyers are gaining control.
MACD bullish crossover:
DIF: -456
DEA: -1055
MACD Histogram: +599
Momentum is improving after the recent bottom around $57,800.
RSI(6): 64
Strong but not yet extremely overbought.
Recent candles show a recovery from the downtrend.
Bearish Signals 📉
Stochastic RSI: 84.89
Williams %R: -10.84
Both indicate BTC is approaching overbought territory.
Bollinger upper band is near $65,315, which may act as immediate resistance.
Key Levels
Resistance
$65,300 (Bollinger Upper Band)
$67,000 – $68,500
$72,000+ if momentum accelerates
Support
$61,800 (Bollinger Middle Band)
$60,000 psychological support
$57,800 major swing low
Next 24–72 Hours Prediction
Bullish Scenario (60% Probability)
BTC holds above $61,800
Breaks $65,300
Targets:
$66,500
$68,000
$70,000
Bearish Scenario (40% Probability)
Rejection at $65,300
Pullback toward:
$62,000
$60,500
Worst case $57,800
Trading Plan
Long Setup
Entry: $62,500–63,500
Stop Loss: $60,800
Targets:
TP1: $65,300
TP2: $68,000
TP3: $70,000
Short Setup
Only if BTC fails at $65,300–66,000
Targets:
$62,000
$60,500
Overall View
The daily chart has shifted from bearish to short-term bullish. MACD and RSI support further upside, but overbought oscillators suggest a pullback could occur before a larger move. As long as BTC remains above $61,800, the path of least resistance is toward $66k–68k.
My 7-day target range: $66,000–$69,000
Invalidation: Daily close below $61,800.
$BTC
1
155

BTC Back at $79k After $80k Breakout - Is $100k Next or Just Another Trap?*
Bitcoin just touched $81,238 - highest since May - and now trading around $79,000. After a 23% pump in 7 days, everyone is asking one question: $100k coming or not?
I did some homework for you.
*PROS - Why $100k is Possible:*
*1. Treasury Debasement Trade:* US Treasury announced to at least double bond buybacks ($4B+). Whenever government prints / buys its own debt, people run to BTC. Same happened in 2020. This is fueling the rally.
*2. ETF Inflows Back:* Last week $1.92 Billion inflow in spot BTC ETFs - biggest since October 2025. Institutions are buying again.
*3. Short Squeeze:* $4 Billion in short positions liquidated in 3 days. That's the biggest short squeeze since 2023. Once bears are out, path to $90k-$100k is open. Many analysts now targeting $100k by year-end.
*CONS - Why Be Careful:*
*1. Strong Resistance at $80k-$82k:* This zone rejected BTC 3 times since May. Profit-taking is huge here. Without new volume, we can consolidate between $76k-$79k again.
*2. Rally Fueled by News, Not Fundamentals:* This pump came after Trump's push for Clarity Act and Treasury news. If regulation bill fails on Sept 15 vote, optimism can bleed out fast.
*3. No Fresh Retail Yet:* Current move is institutional. Retail wallets are just starting to enter. If retail doesn't follow, rally will lose fuel.
*My Take:*
BTC at $79k is not cheap, but it's not top either. ATH was $126k in Oct 2025, so we are still 38% down from top. $100k is possible but not in a straight line.
I'm not buying at $80k with leverage. I'm waiting for a retest of $76k-$77k support. If we hold $77k, then $100k is just a matter of time.
Spot > Futures. Patience > FOMO.
Are you buying this $79k or waiting for a dip?
#Bitcoin #BTC100k #CryptoAnalysis #BTCPriceForecast
BTC Back at $79k After $80k Breakout - Is $100k Next or Just Another Trap?*
Bitcoin just touched $81,238 - highest since May - and now trading around $79,000. After a 23% pump in 7 days, everyone is asking one question: $100k coming or not?
I did some homework for you.
*PROS - Why $100k is Possible:*
*1. Treasury Debasement Trade:* US Treasury announced to at least double bond buybacks ($4B+). Whenever government prints / buys its own debt, people run to BTC. Same happened in 2020. This is fueling the rally.
*2. ETF Inflows Back:* Last week $1.92 Billion inflow in spot BTC ETFs - biggest since October 2025. Institutions are buying again.
*3. Short Squeeze:* $4 Billion in short positions liquidated in 3 days. That's the biggest short squeeze since 2023. Once bears are out, path to $90k-$100k is open. Many analysts now targeting $100k by year-end.
*CONS - Why Be Careful:*
*1. Strong Resistance at $80k-$82k:* This zone rejected BTC 3 times since May. Profit-taking is huge here. Without new volume, we can consolidate between $76k-$79k again.
*2. Rally Fueled by News, Not Fundamentals:* This pump came after Trump's push for Clarity Act and Treasury news. If regulation bill fails on Sept 15 vote, optimism can bleed out fast.
*3. No Fresh Retail Yet:* Current move is institutional. Retail wallets are just starting to enter. If retail doesn't follow, rally will lose fuel.
*My Take:*
BTC at $79k is not cheap, but it's not top either. ATH was $126k in Oct 2025, so we are still 38% down from top. $100k is possible but not in a straight line.
I'm not buying at $80k with leverage. I'm waiting for a retest of $76k-$77k support. If we hold $77k, then $100k is just a matter of time.
Spot > Futures. Patience > FOMO.
Are you buying this $79k or waiting for a dip?
#Bitcoin #BTC100k #CryptoAnalysis #BTCPriceForecast
Bitcoin just touched $81,238 - highest since May - and now trading around $79,000. After a 23% pump in 7 days, everyone is asking one question: $100k coming or not?
I did some homework for you.
*PROS - Why $100k is Possible:*
*1. Treasury Debasement Trade:* US Treasury announced to at least double bond buybacks ($4B+). Whenever government prints / buys its own debt, people run to BTC. Same happened in 2020. This is fueling the rally.
*2. ETF Inflows Back:* Last week $1.92 Billion inflow in spot BTC ETFs - biggest since October 2025. Institutions are buying again.
*3. Short Squeeze:* $4 Billion in short positions liquidated in 3 days. That's the biggest short squeeze since 2023. Once bears are out, path to $90k-$100k is open. Many analysts now targeting $100k by year-end.
*CONS - Why Be Careful:*
*1. Strong Resistance at $80k-$82k:* This zone rejected BTC 3 times since May. Profit-taking is huge here. Without new volume, we can consolidate between $76k-$79k again.
*2. Rally Fueled by News, Not Fundamentals:* This pump came after Trump's push for Clarity Act and Treasury news. If regulation bill fails on Sept 15 vote, optimism can bleed out fast.
*3. No Fresh Retail Yet:* Current move is institutional. Retail wallets are just starting to enter. If retail doesn't follow, rally will lose fuel.
*My Take:*
BTC at $79k is not cheap, but it's not top either. ATH was $126k in Oct 2025, so we are still 38% down from top. $100k is possible but not in a straight line.
I'm not buying at $80k with leverage. I'm waiting for a retest of $76k-$77k support. If we hold $77k, then $100k is just a matter of time.
Spot > Futures. Patience > FOMO.
Are you buying this $79k or waiting for a dip?
#Bitcoin #BTC100k #CryptoAnalysis #BTCPriceForecast
80

·
--
Article
Bitcoin's Morning Move: A Flush A Reclaim and One Level That Decides Everything$BTC USDT 4H Chart Read
Watched this one this morning. BTC's sitting at 66,400, up 1.42% on the day. Quick note upfront: this is a 4H timeframe sO it's an intraday/short term read not a swing or macro call treat it accordingly.
Price action: The standout move is the sharp wick down to 63,100 followed by an immediate V-shaped recovery. That long lower wick matters it suggests a fast liquidation flush rather than a controlled selloff, and buyers absorbed it quickly. Price then reclaimed 64,603 and 65,452 (former resistance, now support) and ran up to today's high of 66,956.15. Since then it's been consolidating in a tight 66,000 ,66,900 range a mix of small red/green candles, basically digestion after the rally.
Momentum (RSI): RSI(6) at 66.21, RSI(14) at 64.89 both bullish but not overbought (70+ is the usual threshold). There's still headroom before this gets stretched.
Volume: Volume spiked hard on the recovery candles off the 63,100 low real buying interest, not a thin bounce. It's cooled off since, consistent with the current consolidation.
MACD: DIF (603.49) is well above DEA (475.28), histogram bars have been green and expanding through the rally. Worth watching, though the last couple bars look like they might be flattening slightly, an early hint momentum could be decelerating. Not a reversal signal yet, just something to keep an eye on.
Levels to watch:
Resistance: 66,956 (today's high) a clean break above could open room toward 67,148
Support: 65,452, then 64,603 a close below either would weaken the bullish case
Invalidation: a move back under 63,755 would undo the recovery structure
Bottom line: Healthy pullback-and-reclaim structure with volume confirmation. Bulls have room per RSI, but the tightening MACD bars are worth monitoring. Not financial advice just my read off the chart.
If BTC breaks 66,956 with strong volume, are you rotating in Or waiting for a retest of 65,452 first? 🤔
#KospiJumpsOver5%AsChipmakersRebound
# #Semiconductors
#TechStocks
#BTCPriceForecast #BitcoinETFsPostLongestInflowStreakSinceMay $BNB $NIGHT
Bitcoin's Morning Move: A Flush A Reclaim and One Level That Decides Everything
$BTC USDT 4H Chart Read
Watched this one this morning. BTC's sitting at 66,400, up 1.42% on the day. Quick note upfront: this is a 4H timeframe sO it's an intraday/short term read not a swing or macro call treat it accordingly.
Price action: The standout move is the sharp wick down to 63,100 followed by an immediate V-shaped recovery. That long lower wick matters it suggests a fast liquidation flush rather than a controlled selloff, and buyers absorbed it quickly. Price then reclaimed 64,603 and 65,452 (former resistance, now support) and ran up to today's high of 66,956.15. Since then it's been consolidating in a tight 66,000 ,66,900 range a mix of small red/green candles, basically digestion after the rally.
Momentum (RSI): RSI(6) at 66.21, RSI(14) at 64.89 both bullish but not overbought (70+ is the usual threshold). There's still headroom before this gets stretched.
Volume: Volume spiked hard on the recovery candles off the 63,100 low real buying interest, not a thin bounce. It's cooled off since, consistent with the current consolidation.
MACD: DIF (603.49) is well above DEA (475.28), histogram bars have been green and expanding through the rally. Worth watching, though the last couple bars look like they might be flattening slightly, an early hint momentum could be decelerating. Not a reversal signal yet, just something to keep an eye on.
Levels to watch:
Resistance: 66,956 (today's high) a clean break above could open room toward 67,148
Support: 65,452, then 64,603 a close below either would weaken the bullish case
Invalidation: a move back under 63,755 would undo the recovery structure
Bottom line: Healthy pullback-and-reclaim structure with volume confirmation. Bulls have room per RSI, but the tightening MACD bars are worth monitoring. Not financial advice just my read off the chart.
If BTC breaks 66,956 with strong volume, are you rotating in Or waiting for a retest of 65,452 first? 🤔
#KospiJumpsOver5%AsChipmakersRebound
# #Semiconductors
#TechStocks
#BTCPriceForecast #BitcoinETFsPostLongestInflowStreakSinceMay $BNB $NIGHT
Watched this one this morning. BTC's sitting at 66,400, up 1.42% on the day. Quick note upfront: this is a 4H timeframe sO it's an intraday/short term read not a swing or macro call treat it accordingly.
Price action: The standout move is the sharp wick down to 63,100 followed by an immediate V-shaped recovery. That long lower wick matters it suggests a fast liquidation flush rather than a controlled selloff, and buyers absorbed it quickly. Price then reclaimed 64,603 and 65,452 (former resistance, now support) and ran up to today's high of 66,956.15. Since then it's been consolidating in a tight 66,000 ,66,900 range a mix of small red/green candles, basically digestion after the rally.
Momentum (RSI): RSI(6) at 66.21, RSI(14) at 64.89 both bullish but not overbought (70+ is the usual threshold). There's still headroom before this gets stretched.
Volume: Volume spiked hard on the recovery candles off the 63,100 low real buying interest, not a thin bounce. It's cooled off since, consistent with the current consolidation.
MACD: DIF (603.49) is well above DEA (475.28), histogram bars have been green and expanding through the rally. Worth watching, though the last couple bars look like they might be flattening slightly, an early hint momentum could be decelerating. Not a reversal signal yet, just something to keep an eye on.
Levels to watch:
Resistance: 66,956 (today's high) a clean break above could open room toward 67,148
Support: 65,452, then 64,603 a close below either would weaken the bullish case
Invalidation: a move back under 63,755 would undo the recovery structure
Bottom line: Healthy pullback-and-reclaim structure with volume confirmation. Bulls have room per RSI, but the tightening MACD bars are worth monitoring. Not financial advice just my read off the chart.
If BTC breaks 66,956 with strong volume, are you rotating in Or waiting for a retest of 65,452 first? 🤔
#KospiJumpsOver5%AsChipmakersRebound
# #Semiconductors
#TechStocks
#BTCPriceForecast #BitcoinETFsPostLongestInflowStreakSinceMay $BNB $NIGHT
5
4
19
646
📉 Bitcoin Price Keeps Falling — Here Is My Honest Analysis
I have been studying this carefully. And here is what I genuinely believe right now.
📊 Why Bitcoin Keeps Dropping
Three real reasons behind this continuous decline:
🏦 ETF outflows — institutional money quietly exiting
⚖️ Regulatory uncertainty — global governments still fighting over crypto rules
📉 Macro pressure — high interest rates keeping risk assets suppressed
🐋 Whale distribution — smart money selling into every bounce
🗓️ Where Are We In The Cycle?
Bitcoin entered a bear market around November 2025.
Historical bear markets last between 12 to 18 months on average.
That puts a potential bottom window somewhere between late 2026 to early 2027.
🎯 Key Levels To Watch
🔴 $58,000 — if this breaks next stop is $51,750
🔴 $50,000 — massive psychological support
🔴 $41,500 — Head and Shoulders full target
🟢 $38,000 — $42,000 — my personal strong accumulation zone
💡 My Honest Opinion
This pain is temporary. Bitcoin has survived:
📉 2018 — dropped 84% then hit $69K
📉 2022 — dropped 77% then hit $74K
📉 Now — history suggests another recovery is coming
The bottom is not in yet. But it is closer than the top was.
📌 What I Would Do Right Now
✅ Stop checking price every hour
✅ Set buy orders at your target levels
✅ DCA slowly — do not buy all at once
✅ Keep some cash ready for the real capitulation moment
✅ Think in years not weeks
The people buying between $38K — $50K will be the ones smiling at $150K. 👇
#BTC #Bitcoin #BTCUSDT #CryptoTrading #BinanceSquare #CryptoAnalysis #Binance #BearMarket #MarketCycle #CryptoInvestor #Web3 #Blockchain #CryptoAlert #DYOR #CryptoMarket #TradingStrategy #CryptoSignals #Accumulation #DCA #BTCPriceForecast #CPIWatch $BTC
📉 Bitcoin Price Keeps Falling — Here Is My Honest Analysis
I have been studying this carefully. And here is what I genuinely believe right now.
📊 Why Bitcoin Keeps Dropping
Three real reasons behind this continuous decline:
🏦 ETF outflows — institutional money quietly exiting
⚖️ Regulatory uncertainty — global governments still fighting over crypto rules
📉 Macro pressure — high interest rates keeping risk assets suppressed
🐋 Whale distribution — smart money selling into every bounce
🗓️ Where Are We In The Cycle?
Bitcoin entered a bear market around November 2025.
Historical bear markets last between 12 to 18 months on average.
That puts a potential bottom window somewhere between late 2026 to early 2027.
🎯 Key Levels To Watch
🔴 $58,000 — if this breaks next stop is $51,750
🔴 $50,000 — massive psychological support
🔴 $41,500 — Head and Shoulders full target
🟢 $38,000 — $42,000 — my personal strong accumulation zone
💡 My Honest Opinion
This pain is temporary. Bitcoin has survived:
📉 2018 — dropped 84% then hit $69K
📉 2022 — dropped 77% then hit $74K
📉 Now — history suggests another recovery is coming
The bottom is not in yet. But it is closer than the top was.
📌 What I Would Do Right Now
✅ Stop checking price every hour
✅ Set buy orders at your target levels
✅ DCA slowly — do not buy all at once
✅ Keep some cash ready for the real capitulation moment
✅ Think in years not weeks
The people buying between $38K — $50K will be the ones smiling at $150K. 👇
#BTC #Bitcoin #BTCUSDT #CryptoTrading #BinanceSquare #CryptoAnalysis #Binance #BearMarket #MarketCycle #CryptoInvestor #Web3 #Blockchain #CryptoAlert #DYOR #CryptoMarket #TradingStrategy #CryptoSignals #Accumulation #DCA #BTCPriceForecast #CPIWatch $BTC
I have been studying this carefully. And here is what I genuinely believe right now.
📊 Why Bitcoin Keeps Dropping
Three real reasons behind this continuous decline:
🏦 ETF outflows — institutional money quietly exiting
⚖️ Regulatory uncertainty — global governments still fighting over crypto rules
📉 Macro pressure — high interest rates keeping risk assets suppressed
🐋 Whale distribution — smart money selling into every bounce
🗓️ Where Are We In The Cycle?
Bitcoin entered a bear market around November 2025.
Historical bear markets last between 12 to 18 months on average.
That puts a potential bottom window somewhere between late 2026 to early 2027.
🎯 Key Levels To Watch
🔴 $58,000 — if this breaks next stop is $51,750
🔴 $50,000 — massive psychological support
🔴 $41,500 — Head and Shoulders full target
🟢 $38,000 — $42,000 — my personal strong accumulation zone
💡 My Honest Opinion
This pain is temporary. Bitcoin has survived:
📉 2018 — dropped 84% then hit $69K
📉 2022 — dropped 77% then hit $74K
📉 Now — history suggests another recovery is coming
The bottom is not in yet. But it is closer than the top was.
📌 What I Would Do Right Now
✅ Stop checking price every hour
✅ Set buy orders at your target levels
✅ DCA slowly — do not buy all at once
✅ Keep some cash ready for the real capitulation moment
✅ Think in years not weeks
The people buying between $38K — $50K will be the ones smiling at $150K. 👇
#BTC #Bitcoin #BTCUSDT #CryptoTrading #BinanceSquare #CryptoAnalysis #Binance #BearMarket #MarketCycle #CryptoInvestor #Web3 #Blockchain #CryptoAlert #DYOR #CryptoMarket #TradingStrategy #CryptoSignals #Accumulation #DCA #BTCPriceForecast #CPIWatch $BTC
1
1
82

·
--
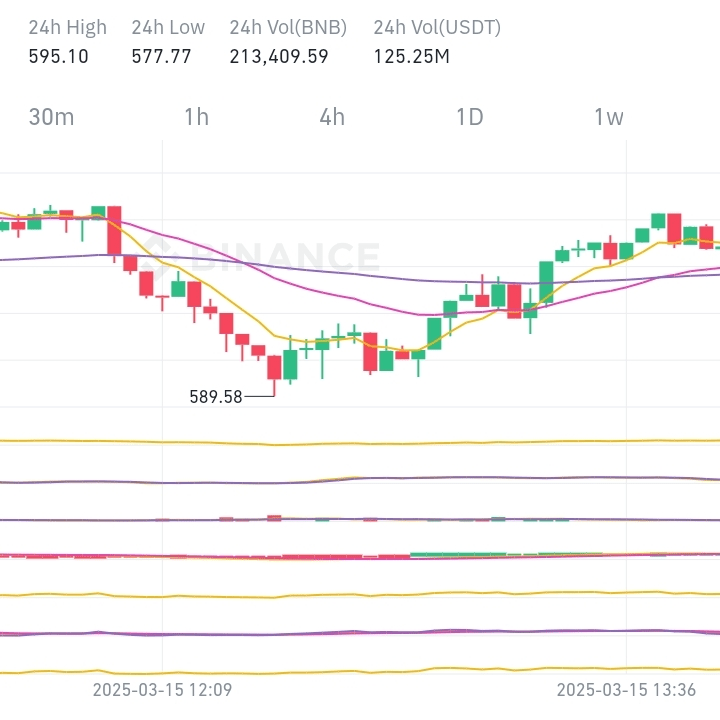
$BTC The momentum shows a good attempt by buyers to push the price higher and test the important resistance zone at $64,000, which the price is currently touching." 🔥 🔥
#BTCPriceForecast #gold $TAG $SPCX
{future}(BTCUSDT)
$BTC The momentum shows a good attempt by buyers to push the price higher and test the important resistance zone at $64,000, which the price is currently touching." 🔥 🔥
#BTCPriceForecast #gold $TAG $SPCX
#BTCPriceForecast #gold $TAG $SPCX
1
173
📊 $BTC — 2nd Largest Unrealized Loss In History. But Nobody Is Selling.
This is one of the most important on chain signals in the current market. And most people are completely missing it.
📊 The Two Charts That Tell Everything
Unrealized Loss — 2nd largest in Bitcoin history
Massive amounts of coins sitting in deep paper losses right now.
Realized Loss — still relatively low
Despite all that pain — holders are NOT selling.
That divergence is everything. 👀
💡 What This Actually Means
Classic bear market capitulation looks like this:
📉 Price drops → 😰 holders panic → 💸 mass selling → realized losses explode → final bottom forms
We have the first part. We do NOT have the last parts yet.
Unrealized pain is at historic levels. But the mass panic selling wave — the one that signals true capitulation — has not arrived.
⚠️ The Risk Ahead
If Realized Loss starts exploding upward — that is the final cleansing phase beginning.
Fast. Violent. Painful for late sellers.
But also historically — the best buying opportunity of the entire cycle.
📌 The Signal Right Now
Market is suffering. Holders are not surrendering.
That tells you two things simultaneously:
🔴 More downside possible if holders finally break
🟢 Strong hands are accumulating at these levels quietly
The question is simple —
Are you surrendering your coins or accumulating them? 👇
#BTC #Bitcoin #BTCUSDT #CryptoTrading #BinanceSquare #CryptoAnalysis #Binance #OnChain #UnrealizedLoss #CryptoInvestor #Web3 #Blockchain #CryptoAlert #DYOR #CryptoMarket #TradingStrategy #CryptoSignals #Capitulation #Accumulation #BTCPriceForecast #USIranDealConfirmed
📊 $BTC — 2nd Largest Unrealized Loss In History. But Nobody Is Selling.
This is one of the most important on chain signals in the current market. And most people are completely missing it.
📊 The Two Charts That Tell Everything
Unrealized Loss — 2nd largest in Bitcoin history
Massive amounts of coins sitting in deep paper losses right now.
Realized Loss — still relatively low
Despite all that pain — holders are NOT selling.
That divergence is everything. 👀
💡 What This Actually Means
Classic bear market capitulation looks like this:
📉 Price drops → 😰 holders panic → 💸 mass selling → realized losses explode → final bottom forms
We have the first part. We do NOT have the last parts yet.
Unrealized pain is at historic levels. But the mass panic selling wave — the one that signals true capitulation — has not arrived.
⚠️ The Risk Ahead
If Realized Loss starts exploding upward — that is the final cleansing phase beginning.
Fast. Violent. Painful for late sellers.
But also historically — the best buying opportunity of the entire cycle.
📌 The Signal Right Now
Market is suffering. Holders are not surrendering.
That tells you two things simultaneously:
🔴 More downside possible if holders finally break
🟢 Strong hands are accumulating at these levels quietly
The question is simple —
Are you surrendering your coins or accumulating them? 👇
#BTC #Bitcoin #BTCUSDT #CryptoTrading #BinanceSquare #CryptoAnalysis #Binance #OnChain #UnrealizedLoss #CryptoInvestor #Web3 #Blockchain #CryptoAlert #DYOR #CryptoMarket #TradingStrategy #CryptoSignals #Capitulation #Accumulation #BTCPriceForecast #USIranDealConfirmed
This is one of the most important on chain signals in the current market. And most people are completely missing it.
📊 The Two Charts That Tell Everything
Unrealized Loss — 2nd largest in Bitcoin history
Massive amounts of coins sitting in deep paper losses right now.
Realized Loss — still relatively low
Despite all that pain — holders are NOT selling.
That divergence is everything. 👀
💡 What This Actually Means
Classic bear market capitulation looks like this:
📉 Price drops → 😰 holders panic → 💸 mass selling → realized losses explode → final bottom forms
We have the first part. We do NOT have the last parts yet.
Unrealized pain is at historic levels. But the mass panic selling wave — the one that signals true capitulation — has not arrived.
⚠️ The Risk Ahead
If Realized Loss starts exploding upward — that is the final cleansing phase beginning.
Fast. Violent. Painful for late sellers.
But also historically — the best buying opportunity of the entire cycle.
📌 The Signal Right Now
Market is suffering. Holders are not surrendering.
That tells you two things simultaneously:
🔴 More downside possible if holders finally break
🟢 Strong hands are accumulating at these levels quietly
The question is simple —
Are you surrendering your coins or accumulating them? 👇
#BTC #Bitcoin #BTCUSDT #CryptoTrading #BinanceSquare #CryptoAnalysis #Binance #OnChain #UnrealizedLoss #CryptoInvestor #Web3 #Blockchain #CryptoAlert #DYOR #CryptoMarket #TradingStrategy #CryptoSignals #Capitulation #Accumulation #BTCPriceForecast #USIranDealConfirmed
1
80

$BTC is currently moving in a consolidation phase, showing signs of stability after recent market volatility. Buyers are actively defending the $58K–$60K support area, while resistance remains near the $68K–$70K zone. A strong breakout above resistance could trigger renewed bullish momentum.
Market sentiment is still influenced by macroeconomic conditions, ETF inflows, and investor confidence. Despite short-term fluctuations, Bitcoin continues to maintain strong long-term fundamentals due to institutional adoption, limited supply, and its position as the leading cryptocurrency.
Overall, BTC remains bullish in the long term, but traders should watch key support and resistance levels closely before the next major move.
#BTCPriceForecast #btcprices #BTC #btccoinwithpair
$BTC
{spot}(BTCUSDT)
$BTC is currently moving in a consolidation phase, showing signs of stability after recent market volatility. Buyers are actively defending the $58K–$60K support area, while resistance remains near the $68K–$70K zone. A strong breakout above resistance could trigger renewed bullish momentum.
Market sentiment is still influenced by macroeconomic conditions, ETF inflows, and investor confidence. Despite short-term fluctuations, Bitcoin continues to maintain strong long-term fundamentals due to institutional adoption, limited supply, and its position as the leading cryptocurrency.
Overall, BTC remains bullish in the long term, but traders should watch key support and resistance levels closely before the next major move.
#BTCPriceForecast #btcprices #BTC #btccoinwithpair
$BTC
Market sentiment is still influenced by macroeconomic conditions, ETF inflows, and investor confidence. Despite short-term fluctuations, Bitcoin continues to maintain strong long-term fundamentals due to institutional adoption, limited supply, and its position as the leading cryptocurrency.
Overall, BTC remains bullish in the long term, but traders should watch key support and resistance levels closely before the next major move.
#BTCPriceForecast #btcprices #BTC #btccoinwithpair
$BTC
105
·
--
$BTC la liquidity and positioning
Short-term liquidity began to build above the recent peak around 64.8k.
That said, I still see the majority of the “fuel” below us: first in the 60–65k zone, then much lower around 57k.
Long liquidity levels: 315 | Short liquidity levels: 212
Δ: +103 (~$4B imbalance)
Buyers (“longs”) are still slightly more exposed, but the setup is much less asymmetric than before.
Right now, I’m paying more attention to the large isolated liquidity levels than to the overall imbalance.
64.7k: biggest cluster (~$330M)
62k: second biggest (~$240M)
Both are magnets, but 62k is the one most relevant to me at the moment.
however, the main expectation: lower
$ETH $SPCX
#liquidity #btc70k #BTCPriceForecast
$BTC la liquidity and positioning
Short-term liquidity began to build above the recent peak around 64.8k.
That said, I still see the majority of the “fuel” below us: first in the 60–65k zone, then much lower around 57k.
Long liquidity levels: 315 | Short liquidity levels: 212
Δ: +103 (~$4B imbalance)
Buyers (“longs”) are still slightly more exposed, but the setup is much less asymmetric than before.
Right now, I’m paying more attention to the large isolated liquidity levels than to the overall imbalance.
64.7k: biggest cluster (~$330M)
62k: second biggest (~$240M)
Both are magnets, but 62k is the one most relevant to me at the moment.
however, the main expectation: lower
$ETH $SPCX
#liquidity #btc70k #BTCPriceForecast
Short-term liquidity began to build above the recent peak around 64.8k.
That said, I still see the majority of the “fuel” below us: first in the 60–65k zone, then much lower around 57k.
Long liquidity levels: 315 | Short liquidity levels: 212
Δ: +103 (~$4B imbalance)
Buyers (“longs”) are still slightly more exposed, but the setup is much less asymmetric than before.
Right now, I’m paying more attention to the large isolated liquidity levels than to the overall imbalance.
64.7k: biggest cluster (~$330M)
62k: second biggest (~$240M)
Both are magnets, but 62k is the one most relevant to me at the moment.
however, the main expectation: lower
$ETH $SPCX
#liquidity #btc70k #BTCPriceForecast
162

Btc Btc.
what you think btc cross 74000
what you think btc Drop 48000
there only mindset game .Do analysis of market sintment and technical analysis ,think it provide upto 60 say to 70 Percentage price guess.
what you think comment below
#BTC #BTCPriceForecast #BTCPriceAnalysis
Btc Btc.
what you think btc cross 74000
what you think btc Drop 48000
there only mindset game .Do analysis of market sintment and technical analysis ,think it provide upto 60 say to 70 Percentage price guess.
what you think comment below
#BTC #BTCPriceForecast #BTCPriceAnalysis
what you think btc cross 74000
what you think btc Drop 48000
there only mindset game .Do analysis of market sintment and technical analysis ,think it provide upto 60 say to 70 Percentage price guess.
what you think comment below
#BTC #BTCPriceForecast #BTCPriceAnalysis
1
167

·
--
$BTC crossed 64000 $USDT
So i hope other coins like Bnb,Eth ,etc value also will increase until tonight #BTCPriceForecast check here for more details
$BTC crossed 64000 $USDT
So i hope other coins like Bnb,Eth ,etc value also will increase until tonight #BTCPriceForecast check here for more details
So i hope other coins like Bnb,Eth ,etc value also will increase until tonight #BTCPriceForecast check here for more details
1
149

·
--
BTC October 2026 Prediction 📉
Where do you think Bitcoin will be by October?
Drop your vote below..
Trade Now $BTC $SOL $ETH
#BTCPricePredictions #BTCPriceForecast #altcoins #trade
{spot}(BTCUSDT)
{spot}(SOLUSDT)
{spot}(ETHUSDT)
BTC October 2026 Prediction 📉
Where do you think Bitcoin will be by October?
Drop your vote below..
Trade Now $BTC $SOL $ETH
#BTCPricePredictions #BTCPriceForecast #altcoins #trade
Where do you think Bitcoin will be by October?
Drop your vote below..
Trade Now $BTC $SOL $ETH
#BTCPricePredictions #BTCPriceForecast #altcoins #trade
20K – $40K
17%
40K – $60K
24%
60K – $80K
59%
41 votes • Voting closed
1
330

·
--
Bearish
The U.S. government transferred 12,267 BTC, worth $BTC : a custody adjustment, not a sell-off signal
According to Arkham on-chain data, on October 8, 2026, a wallet labeled “U.S. Government: 2016 Bitfinex Hack Funds Seized” transferred 12,267 BTC, worth approximately $1.01 billion, to a new unlabeled address. So far, there has been no official statement confirming that this transfer involved a sale.
Previously, Bitcoin from similar U.S. government wallets had been transferred multiple times to Coinbase Prime. It is important to note that Coinbase Prime is not only an exchange, but also a compliance asset custodian selected by institutions such as the U.S. Marshals Service. Therefore, inflows of Bitcoin to related addresses do not necessarily mean it has entered the public market for selling.
On the policy side, the executive order signed in March 2025 established a “Strategic Bitcoin Reserve” and stipulates that Bitcoin deposited into this reserve may not be sold. This framework significantly limits the government’s discretion in disposing of seized Bitcoin. Combined with the fact that the receiving address is unlabeled and did not directly flow into an exchange deposit address, the market generally leans toward interpreting this as a custody address adjustment or consolidation into strategic reserves, rather than a sell-off.
In terms of holdings, the U.S. government still controls more than 300,000 BTC, valued at about $25 billion at the time. This transfer did not change its overall holdings pattern, nor has an official sale been confirmed.
Overall, there is no direct evidence to interpret this on-chain movement as a “government dump.” A more important variable to watch is the potential Bitcoin distribution involved in the follow-up compensation process for the Bitfinex hack case, which is the key area of possible future market supply.
#BTCPriceForecast $ETH $BNB
The U.S. government transferred 12,267 BTC, worth $BTC : a custody adjustment, not a sell-off signal
According to Arkham on-chain data, on October 8, 2026, a wallet labeled “U.S. Government: 2016 Bitfinex Hack Funds Seized” transferred 12,267 BTC, worth approximately $1.01 billion, to a new unlabeled address. So far, there has been no official statement confirming that this transfer involved a sale.
Previously, Bitcoin from similar U.S. government wallets had been transferred multiple times to Coinbase Prime. It is important to note that Coinbase Prime is not only an exchange, but also a compliance asset custodian selected by institutions such as the U.S. Marshals Service. Therefore, inflows of Bitcoin to related addresses do not necessarily mean it has entered the public market for selling.
On the policy side, the executive order signed in March 2025 established a “Strategic Bitcoin Reserve” and stipulates that Bitcoin deposited into this reserve may not be sold. This framework significantly limits the government’s discretion in disposing of seized Bitcoin. Combined with the fact that the receiving address is unlabeled and did not directly flow into an exchange deposit address, the market generally leans toward interpreting this as a custody address adjustment or consolidation into strategic reserves, rather than a sell-off.
In terms of holdings, the U.S. government still controls more than 300,000 BTC, valued at about $25 billion at the time. This transfer did not change its overall holdings pattern, nor has an official sale been confirmed.
Overall, there is no direct evidence to interpret this on-chain movement as a “government dump.” A more important variable to watch is the potential Bitcoin distribution involved in the follow-up compensation process for the Bitfinex hack case, which is the key area of possible future market supply.
#BTCPriceForecast $ETH $BNB
According to Arkham on-chain data, on October 8, 2026, a wallet labeled “U.S. Government: 2016 Bitfinex Hack Funds Seized” transferred 12,267 BTC, worth approximately $1.01 billion, to a new unlabeled address. So far, there has been no official statement confirming that this transfer involved a sale.
Previously, Bitcoin from similar U.S. government wallets had been transferred multiple times to Coinbase Prime. It is important to note that Coinbase Prime is not only an exchange, but also a compliance asset custodian selected by institutions such as the U.S. Marshals Service. Therefore, inflows of Bitcoin to related addresses do not necessarily mean it has entered the public market for selling.
On the policy side, the executive order signed in March 2025 established a “Strategic Bitcoin Reserve” and stipulates that Bitcoin deposited into this reserve may not be sold. This framework significantly limits the government’s discretion in disposing of seized Bitcoin. Combined with the fact that the receiving address is unlabeled and did not directly flow into an exchange deposit address, the market generally leans toward interpreting this as a custody address adjustment or consolidation into strategic reserves, rather than a sell-off.
In terms of holdings, the U.S. government still controls more than 300,000 BTC, valued at about $25 billion at the time. This transfer did not change its overall holdings pattern, nor has an official sale been confirmed.
Overall, there is no direct evidence to interpret this on-chain movement as a “government dump.” A more important variable to watch is the potential Bitcoin distribution involved in the follow-up compensation process for the Bitfinex hack case, which is the key area of possible future market supply.
#BTCPriceForecast $ETH $BNB
2
319

💙 Crypto Breaking News
• The UNDP is expanding its partnership with Stellar after pilot programs significantly reduced aid payment costs.
• Donald Trump's proposed Bitcoin reserve plan is facing legal scrutiny over Treasury authority.
• Trump says he became "a big crypto guy" in part for political reasons.
• Bitcoin has shrugged off recent Strategy-related FUD, climbing to a two-week high as signs of market stabilization emerge.
• Solana is outperforming today, while Bitcoin, $XRP , and $DOGE coin are trading slightly lower.
• Injective's CEO says Layer 1 blockchains are entering a new battle over decentralization.
• Trump's $BTC Bitcoin reserve proposal continues to face legal and regulatory hurdles.
#btcprices #BTCPriceForecast #BinanceTurns9
💙 Crypto Breaking News
• The UNDP is expanding its partnership with Stellar after pilot programs significantly reduced aid payment costs.
• Donald Trump's proposed Bitcoin reserve plan is facing legal scrutiny over Treasury authority.
• Trump says he became "a big crypto guy" in part for political reasons.
• Bitcoin has shrugged off recent Strategy-related FUD, climbing to a two-week high as signs of market stabilization emerge.
• Solana is outperforming today, while Bitcoin, $XRP , and $DOGE coin are trading slightly lower.
• Injective's CEO says Layer 1 blockchains are entering a new battle over decentralization.
• Trump's $BTC Bitcoin reserve proposal continues to face legal and regulatory hurdles.
#btcprices #BTCPriceForecast #BinanceTurns9
• The UNDP is expanding its partnership with Stellar after pilot programs significantly reduced aid payment costs.
• Donald Trump's proposed Bitcoin reserve plan is facing legal scrutiny over Treasury authority.
• Trump says he became "a big crypto guy" in part for political reasons.
• Bitcoin has shrugged off recent Strategy-related FUD, climbing to a two-week high as signs of market stabilization emerge.
• Solana is outperforming today, while Bitcoin, $XRP , and $DOGE coin are trading slightly lower.
• Injective's CEO says Layer 1 blockchains are entering a new battle over decentralization.
• Trump's $BTC Bitcoin reserve proposal continues to face legal and regulatory hurdles.
#btcprices #BTCPriceForecast #BinanceTurns9
1
136

·
--
Article
The MACD 27-Bar Exhaustion Rule Applied to BTC: Past and Future AnalysisThe MACD 27-bar count begins the moment the momentum indicator crosses over and flips to the opposite side. This helps estimate when a price exhaustion point or trend reversal will occur.
As shown in the chart below, BTC's uptrend count initiated as soon as the MACD turned positive. In this case, the turning point materialized exactly on the 27th bar, after which Bitcoin ($BTC ) turned bearish and entered a prolonged downtrend.
On the chart, the starting point is marked by a green vertical line, and the reversal point is indicated by a red vertical line at exactly the 27th bar.
{spot}(BTCUSDT)
According to the #MACD27BarExhaustionRule , BTC's current downtrend remains ongoing and is projected to conclude by December 2027. This target presents a potential macro bottom and a strategic entry point to begin dollar-cost averaging (#DCA ) or #SFIS strategy.
While this projection relies strictly on the MACD 27-Bar Exhaustion Rule, comprehensive market analysis requires considering broader macro factors as BTC operates as the benchmark digital asset, leading a unique and dominant force in the market. Notably, this December 2027 exhaustion timeline aligns closely with Bitcoin's historical four-year halving cycle.
The fundamental logic of the MACD 27-Bar Exhaustion Rule dictates that a trend must last exactly 27 bars from the initial positive or negative crossover. If the MACD crosses back before reaching the 27-bar threshold, the signal is invalidated. Traders must wait for a full, uninterrupted 27-bar sequence to confirm the rule.
However, execution variables apply across different charts. While the standard rule assumes a 27-bar count on a daily chart, the signal can extend up to 38 bars on lower timeframes (such as the 4-hour chart) due to noise and continuous trading hours, or conversely, for a higher timeframes such as the 1-week chart.
For a more granular breakdown of this methodology and historical backtesting examples, please feel free to message me and also refer to my previous article.
And, as the author of the MACD 27-Bar Exhaustion Rule, I am continuously refining its application. If you have questions, insight from your own trading data, or want to collaborate on quantitative investment strategies, please reach out in the comments below.
#BTCPriceForecast #Bitcoin2027
Always "DYOR"
The article was created with the assistance of artificial intelligence.
The MACD 27-Bar Exhaustion Rule Applied to BTC: Past and Future Analysis
The MACD 27-bar count begins the moment the momentum indicator crosses over and flips to the opposite side. This helps estimate when a price exhaustion point or trend reversal will occur.
As shown in the chart below, BTC's uptrend count initiated as soon as the MACD turned positive. In this case, the turning point materialized exactly on the 27th bar, after which Bitcoin ($BTC ) turned bearish and entered a prolonged downtrend.
On the chart, the starting point is marked by a green vertical line, and the reversal point is indicated by a red vertical line at exactly the 27th bar.
According to the #MACD27BarExhaustionRule , BTC's current downtrend remains ongoing and is projected to conclude by December 2027. This target presents a potential macro bottom and a strategic entry point to begin dollar-cost averaging (#DCA ) or #SFIS strategy.
While this projection relies strictly on the MACD 27-Bar Exhaustion Rule, comprehensive market analysis requires considering broader macro factors as BTC operates as the benchmark digital asset, leading a unique and dominant force in the market. Notably, this December 2027 exhaustion timeline aligns closely with Bitcoin's historical four-year halving cycle.
The fundamental logic of the MACD 27-Bar Exhaustion Rule dictates that a trend must last exactly 27 bars from the initial positive or negative crossover. If the MACD crosses back before reaching the 27-bar threshold, the signal is invalidated. Traders must wait for a full, uninterrupted 27-bar sequence to confirm the rule.
However, execution variables apply across different charts. While the standard rule assumes a 27-bar count on a daily chart, the signal can extend up to 38 bars on lower timeframes (such as the 4-hour chart) due to noise and continuous trading hours, or conversely, for a higher timeframes such as the 1-week chart.
For a more granular breakdown of this methodology and historical backtesting examples, please feel free to message me and also refer to my previous article.
And, as the author of the MACD 27-Bar Exhaustion Rule, I am continuously refining its application. If you have questions, insight from your own trading data, or want to collaborate on quantitative investment strategies, please reach out in the comments below.
#BTCPriceForecast #Bitcoin2027
Always "DYOR"
The article was created with the assistance of artificial intelligence.
As shown in the chart below, BTC's uptrend count initiated as soon as the MACD turned positive. In this case, the turning point materialized exactly on the 27th bar, after which Bitcoin ($BTC ) turned bearish and entered a prolonged downtrend.
On the chart, the starting point is marked by a green vertical line, and the reversal point is indicated by a red vertical line at exactly the 27th bar.
According to the #MACD27BarExhaustionRule , BTC's current downtrend remains ongoing and is projected to conclude by December 2027. This target presents a potential macro bottom and a strategic entry point to begin dollar-cost averaging (#DCA ) or #SFIS strategy.
While this projection relies strictly on the MACD 27-Bar Exhaustion Rule, comprehensive market analysis requires considering broader macro factors as BTC operates as the benchmark digital asset, leading a unique and dominant force in the market. Notably, this December 2027 exhaustion timeline aligns closely with Bitcoin's historical four-year halving cycle.
The fundamental logic of the MACD 27-Bar Exhaustion Rule dictates that a trend must last exactly 27 bars from the initial positive or negative crossover. If the MACD crosses back before reaching the 27-bar threshold, the signal is invalidated. Traders must wait for a full, uninterrupted 27-bar sequence to confirm the rule.
However, execution variables apply across different charts. While the standard rule assumes a 27-bar count on a daily chart, the signal can extend up to 38 bars on lower timeframes (such as the 4-hour chart) due to noise and continuous trading hours, or conversely, for a higher timeframes such as the 1-week chart.
For a more granular breakdown of this methodology and historical backtesting examples, please feel free to message me and also refer to my previous article.
And, as the author of the MACD 27-Bar Exhaustion Rule, I am continuously refining its application. If you have questions, insight from your own trading data, or want to collaborate on quantitative investment strategies, please reach out in the comments below.
#BTCPriceForecast #Bitcoin2027
Always "DYOR"
The article was created with the assistance of artificial intelligence.
107
Log in to explore more content
Join global crypto users on Binance Square
⚡️ Get latest and useful information about crypto.
💬 Trusted by the world’s largest crypto exchange.
👍 Discover real insights from verified creators.
Email / Phone number
Trending Topics
1
#LedgerConfirmsUnauthorizedHardwareImplantInUserDevice
357 views
15 Discussing
2
#EtherETFsExtendOutflowsToNineDays
16,166 views
271 Discussing
3
#EthereumSurpasses2500USDT
231,733 views
1,513 Discussing
4
#XRPLedgerPatchesXRPCreationBug
269,053 views
2,195 Discussing
5
#STRKRisesAbout20%In24Hours
255,747 views
2,126 Discussing
6
#TetherFreezesUSDTLinkedToLedgerTheft
95,863 views
1,364 Discussing
7
#CFTCMovesToFoldEventContractsIntoSwapsRules
40,731 views
897 Discussing
8
#LedgerPausesCryptoBilisSales
73,664 views
781 Discussing
9
#EvernorthCompletesSPACMergerWithArmadaII
47,583 views
472 Discussing
10
#NEARAccountsSupportPostQuantumMLDSA
44,942 views
407 Discussing