

#93
93
4,106 views
52 Discussing
Hot
Latest

·
--
** How to Do Technical Analysis: A Step-by-Step Guide for Crypto Investors 🚀LayerZero (ZROUSDT) is trending right now!
Rank: #93
** It is important to improve your technical analysis skills to be successful in the crypto market. Technical analysis helps you predict future price movements by using past market data. 📊 **Step 1: Choose the Chart Type** The most commonly used chart types in technical analysis are: - **Line Chart**: Shows how the price changes over time. - **Candlestick Chart**: Displays the opening, closing, highest, and lowest values of the price. For example, the price is currently at the $84853.29 level. 📈 **Step 2: Identify Support and Resistance Points** Support points are levels where the price falls but does not drop further. Resistance points are levels where the price rises but does not rise further. Think of it like this: Support points are where buyers say "stop" for the price, while resistance points are where sellers say "stop." 🚫 For example, when the price is at the $2681.30 level, the $2700 level could be a resistance point. 📊 **Step 3: Recognize Trends** Trends are periods when the price moves in a certain direction. Identifying trends helps you predict future price movements. For example, if the price shows a % -0.47 change over the last 24 hours, it could be a downtrend. 📉 **Step 4: Use Technical Indicators** Technical indicators process price data to show trends and potential turning points. - **RSI (Relative Strength Index)**:
** How to Do Technical Analysis: A Step-by-Step Guide for Crypto Investors 🚀
LayerZero (ZROUSDT) is trending right now!
Rank: #93
** It is important to improve your technical analysis skills to be successful in the crypto market. Technical analysis helps you predict future price movements by using past market data. 📊 **Step 1: Choose the Chart Type** The most commonly used chart types in technical analysis are: - **Line Chart**: Shows how the price changes over time. - **Candlestick Chart**: Displays the opening, closing, highest, and lowest values of the price. For example, the price is currently at the $84853.29 level. 📈 **Step 2: Identify Support and Resistance Points** Support points are levels where the price falls but does not drop further. Resistance points are levels where the price rises but does not rise further. Think of it like this: Support points are where buyers say "stop" for the price, while resistance points are where sellers say "stop." 🚫 For example, when the price is at the $2681.30 level, the $2700 level could be a resistance point. 📊 **Step 3: Recognize Trends** Trends are periods when the price moves in a certain direction. Identifying trends helps you predict future price movements. For example, if the price shows a % -0.47 change over the last 24 hours, it could be a downtrend. 📉 **Step 4: Use Technical Indicators** Technical indicators process price data to show trends and potential turning points. - **RSI (Relative Strength Index)**:
Rank: #93
** It is important to improve your technical analysis skills to be successful in the crypto market. Technical analysis helps you predict future price movements by using past market data. 📊 **Step 1: Choose the Chart Type** The most commonly used chart types in technical analysis are: - **Line Chart**: Shows how the price changes over time. - **Candlestick Chart**: Displays the opening, closing, highest, and lowest values of the price. For example, the price is currently at the $84853.29 level. 📈 **Step 2: Identify Support and Resistance Points** Support points are levels where the price falls but does not drop further. Resistance points are levels where the price rises but does not rise further. Think of it like this: Support points are where buyers say "stop" for the price, while resistance points are where sellers say "stop." 🚫 For example, when the price is at the $2681.30 level, the $2700 level could be a resistance point. 📊 **Step 3: Recognize Trends** Trends are periods when the price moves in a certain direction. Identifying trends helps you predict future price movements. For example, if the price shows a % -0.47 change over the last 24 hours, it could be a downtrend. 📉 **Step 4: Use Technical Indicators** Technical indicators process price data to show trends and potential turning points. - **RSI (Relative Strength Index)**:
66

Article
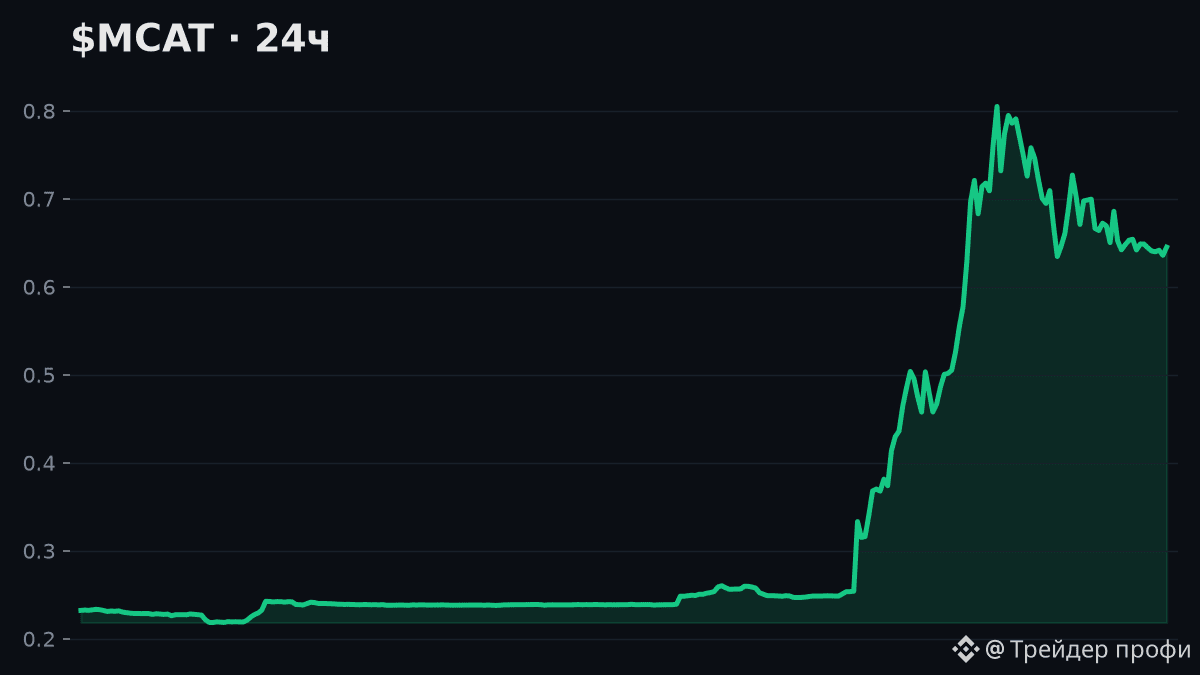
$MCAT +177.4% in 24h — shot up brighter than anyone else in the top 100!⚡ $MCAT +177.4% in 24h — shot up brighter than anyone else in the top 100!
This doesn’t happen every day.
🧭 Summary: volume is low — the movement may be unstable.
🌍 Market context: out of 68 major coins with noticeable movement over the last 24h — 🔼 64 rose, 🔽 4 fell
📈 Market favorite: $MCAT +177.4% in 24h
💰 Price: $0.6451 (range $0.2170–$0.8191)
$MCAT +177.4% in 24h — shot up brighter than anyone else in the top 100!
⚡ $MCAT +177.4% in 24h — shot up brighter than anyone else in the top 100!
This doesn’t happen every day.
🧭 Summary: volume is low — the movement may be unstable.
🌍 Market context: out of 68 major coins with noticeable movement over the last 24h — 🔼 64 rose, 🔽 4 fell
📈 Market favorite: $MCAT +177.4% in 24h
💰 Price: $0.6451 (range $0.2170–$0.8191)
This doesn’t happen every day.
🧭 Summary: volume is low — the movement may be unstable.
🌍 Market context: out of 68 major coins with noticeable movement over the last 24h — 🔼 64 rose, 🔽 4 fell
📈 Market favorite: $MCAT +177.4% in 24h
💰 Price: $0.6451 (range $0.2170–$0.8191)
109

·
--
🤖 Automated Trading Status
━━━━━━━━━━━━━━━
Switch: ✅ Enabled
API key: Configured
Single order margin: 50.0 USDT
Leverage: 3x
TP1 Close-out ratio: 65%
Open position limit: 10 orders
Currently holding: 2 orders
• XRPUSDT Short Open 1.3964 Stop loss 1.3958 TP1 1.3555 TP2 1.3266 (break-even secured)
• NEARUSDT Long Open 2.3560 Stop loss 2.2490 TP1 2.5120 TP2 2.6180
━━━━━━━━━━━━━━━
Command: Automated trading On/Off | Amount <U> | Leverage <x> | Ratio <%> | Limit <n> | Close-out &#91;asset&#93;
🤖 Automated Trading Status
━━━━━━━━━━━━━━━
Switch: ✅ Enabled
API key: Configured
Single order margin: 50.0 USDT
Leverage: 3x
TP1 Close-out ratio: 65%
Open position limit: 10 orders
Currently holding: 2 orders
• XRPUSDT Short Open 1.3964 Stop loss 1.3958 TP1 1.3555 TP2 1.3266 (break-even secured)
• NEARUSDT Long Open 2.3560 Stop loss 2.2490 TP1 2.5120 TP2 2.6180
━━━━━━━━━━━━━━━
Command: Automated trading On/Off | Amount <U> | Leverage <x> | Ratio <%> | Limit <n> | Close-out &#91;asset&#93;
━━━━━━━━━━━━━━━
Switch: ✅ Enabled
API key: Configured
Single order margin: 50.0 USDT
Leverage: 3x
TP1 Close-out ratio: 65%
Open position limit: 10 orders
Currently holding: 2 orders
• XRPUSDT Short Open 1.3964 Stop loss 1.3958 TP1 1.3555 TP2 1.3266 (break-even secured)
• NEARUSDT Long Open 2.3560 Stop loss 2.2490 TP1 2.5120 TP2 2.6180
━━━━━━━━━━━━━━━
Command: Automated trading On/Off | Amount <U> | Leverage <x> | Ratio <%> | Limit <n> | Close-out &#91;asset&#93;
1
134
·
--
** How to Do Daily Momentum Trading? – A Practical Step-by-Step Guide on Binance Square 📊Pons (PONSUSDT) is trending right now!
Rank: #93
** --- ### 1️⃣ Identify Today’s “Hot” Coins **Why is it important?** The highest volatility brings short-term profit opportunities. **Step:** - Check the **“Top Movers”** tab on the Binance Square homepage. - Select coins that have moved **5%+** within 24 hours. (Today: , , , , ) **Example application:** - is currently up **12.7%** and priced at **7.046 USDT**. - is up **7.4%** at **0.987 USDT**. **Visual tip:** These coins’ price charts are usually inside an **ascending channel** — you may see a slight squeeze near the upper boundary. --- ### 2️⃣ Open the 5-Minute and 15-Minute Candlestick Chart **Why is it important?** Catching micro-trends helps clarify entry and exit timing. **Step:** - Open the chart for in the **5 min** timeframe. - Has a **Bullish Engulfing** pattern formed in the last 3–4 candles? **Example application:** - On the 5 min chart, an **engulfing** was seen between **12:30–12:35** in the 6.80–7.05 range. **Visual tip:** - **🟢** Green candle > red candle → bullish signal - **📈** Line support: 6.80 USDT (previous low) --- ### 3️⃣ Determine Entry and Stop-Loss Levels **Why is it important?** Maintaining a risk-reward ratio helps prevent large losses. **Step:** - Entry: **Market Buy** (or limit **7.045 USDT**). - Stop-Loss: 0.5% below the latest low → **6.75 USDT**. **Example application:** - For buy at 0.987 USDT, stop-loss at 0.965 USDT (≈2.2%). **Visual tip:** - **🔻
** How to Do Daily Momentum Trading? – A Practical Step-by-Step Guide on Binance Square 📊
Pons (PONSUSDT) is trending right now!
Rank: #93
** --- ### 1️⃣ Identify Today’s “Hot” Coins **Why is it important?** The highest volatility brings short-term profit opportunities. **Step:** - Check the **“Top Movers”** tab on the Binance Square homepage. - Select coins that have moved **5%+** within 24 hours. (Today: , , , , ) **Example application:** - is currently up **12.7%** and priced at **7.046 USDT**. - is up **7.4%** at **0.987 USDT**. **Visual tip:** These coins’ price charts are usually inside an **ascending channel** — you may see a slight squeeze near the upper boundary. --- ### 2️⃣ Open the 5-Minute and 15-Minute Candlestick Chart **Why is it important?** Catching micro-trends helps clarify entry and exit timing. **Step:** - Open the chart for in the **5 min** timeframe. - Has a **Bullish Engulfing** pattern formed in the last 3–4 candles? **Example application:** - On the 5 min chart, an **engulfing** was seen between **12:30–12:35** in the 6.80–7.05 range. **Visual tip:** - **🟢** Green candle > red candle → bullish signal - **📈** Line support: 6.80 USDT (previous low) --- ### 3️⃣ Determine Entry and Stop-Loss Levels **Why is it important?** Maintaining a risk-reward ratio helps prevent large losses. **Step:** - Entry: **Market Buy** (or limit **7.045 USDT**). - Stop-Loss: 0.5% below the latest low → **6.75 USDT**. **Example application:** - For buy at 0.987 USDT, stop-loss at 0.965 USDT (≈2.2%). **Visual tip:** - **🔻
Rank: #93
** --- ### 1️⃣ Identify Today’s “Hot” Coins **Why is it important?** The highest volatility brings short-term profit opportunities. **Step:** - Check the **“Top Movers”** tab on the Binance Square homepage. - Select coins that have moved **5%+** within 24 hours. (Today: , , , , ) **Example application:** - is currently up **12.7%** and priced at **7.046 USDT**. - is up **7.4%** at **0.987 USDT**. **Visual tip:** These coins’ price charts are usually inside an **ascending channel** — you may see a slight squeeze near the upper boundary. --- ### 2️⃣ Open the 5-Minute and 15-Minute Candlestick Chart **Why is it important?** Catching micro-trends helps clarify entry and exit timing. **Step:** - Open the chart for in the **5 min** timeframe. - Has a **Bullish Engulfing** pattern formed in the last 3–4 candles? **Example application:** - On the 5 min chart, an **engulfing** was seen between **12:30–12:35** in the 6.80–7.05 range. **Visual tip:** - **🟢** Green candle > red candle → bullish signal - **📈** Line support: 6.80 USDT (previous low) --- ### 3️⃣ Determine Entry and Stop-Loss Levels **Why is it important?** Maintaining a risk-reward ratio helps prevent large losses. **Step:** - Entry: **Market Buy** (or limit **7.045 USDT**). - Stop-Loss: 0.5% below the latest low → **6.75 USDT**. **Example application:** - For buy at 0.987 USDT, stop-loss at 0.965 USDT (≈2.2%). **Visual tip:** - **🔻
222
·
--
BTC Holds Steady Above 9KPons (PONSUSDT) is trending right now!
Rank: #93
"The calm before the storm? 🚀 BTC is up **,500** from its recent dip and now trading at **9,818**. Volume is still low at **7.7B**, but I'm watching for a breakout. ETH is steady at **,460**, up **0.30%** in 24hrs. My take? The market is waiting for a catalyst. Will it be a ** ETF** or something else? 🤔 "
#bitcoin #ethereum #crypto
BTC Holds Steady Above 9K
Pons (PONSUSDT) is trending right now!
Rank: #93
"The calm before the storm? 🚀 BTC is up **,500** from its recent dip and now trading at **9,818**. Volume is still low at **7.7B**, but I'm watching for a breakout. ETH is steady at **,460**, up **0.30%** in 24hrs. My take? The market is waiting for a catalyst. Will it be a ** ETF** or something else? 🤔 "
#bitcoin #ethereum #crypto
Rank: #93
"The calm before the storm? 🚀 BTC is up **,500** from its recent dip and now trading at **9,818**. Volume is still low at **7.7B**, but I'm watching for a breakout. ETH is steady at **,460**, up **0.30%** in 24hrs. My take? The market is waiting for a catalyst. Will it be a ** ETF** or something else? 🤔 "
#bitcoin #ethereum #crypto
15

·
--
🏆 FLIPPENING
💰 Ethereum just flipped Citigroup!
$ETH $221.23B · now #93 of all assets
Passed Citigroup ($220.93B)
🍳 Crypto vs the whole world. Not financial advice.
#CookingBNB #Crypto #Bitcoin #BTC
🏆 FLIPPENING
💰 Ethereum just flipped Citigroup!
$ETH $221.23B · now #93 of all assets
Passed Citigroup ($220.93B)
🍳 Crypto vs the whole world. Not financial advice.
#CookingBNB #Crypto #Bitcoin #BTC
💰 Ethereum just flipped Citigroup!
$ETH $221.23B · now #93 of all assets
Passed Citigroup ($220.93B)
🍳 Crypto vs the whole world. Not financial advice.
#CookingBNB #Crypto #Bitcoin #BTC

21

·
--
Everyone likes to post memes on-chain, but “the casino’s” own token is often forgotten.
Take a look at $PUMP. It’s still down 81% from ATH, but it has quietly climbed 18% over the past 30 days. Its market cap is back to $660 million (ranked #93). From the chart, compared with the panic low it broke below $0.0012 in late June, recent trading activity has expanded alongside daily volumes of around $60 million, and it has formed a slowly rising bottom structure.
As an asset listed on major exchange contracts, $PUMP essentially serves as a liquidity reservoir carrying on-chain PVP sentiment. The spike in trading volume that pushed past $100 million toward the end of June is a notable signal—it suggests capital is attempting to test the lows. When on-chain activity rebounds, narratives like this are often the most direct beta option.
But don’t get carried away—the risks are just as bare. A historical drawdown of -81% means there’s an extremely heavy overhead bagholding position; every upward breakout will face crushing “get-out” selling pressure. If the next phase’s daily trading volume can’t steadily keep up, and the price can’t fully hold the $0.0016 range, then this is very likely only a technical rebound within a supply/demand contest, not a true trend reversal.
In the cycle, selling shovels is always a good business—provided there are still enough people in the market who believe in the gold rush ⛏️. Do you think this bout of moderate volume in $PUMP is smart money front-running at the lows, or is it a lure for trapped holders to get back at a rescue rally?
Everyone likes to post memes on-chain, but “the casino’s” own token is often forgotten.
Take a look at $PUMP . It’s still down 81% from ATH, but it has quietly climbed 18% over the past 30 days. Its market cap is back to $660 million (ranked #93). From the chart, compared with the panic low it broke below $0.0012 in late June, recent trading activity has expanded alongside daily volumes of around $60 million, and it has formed a slowly rising bottom structure.
As an asset listed on major exchange contracts, $PUMP essentially serves as a liquidity reservoir carrying on-chain PVP sentiment. The spike in trading volume that pushed past $100 million toward the end of June is a notable signal—it suggests capital is attempting to test the lows. When on-chain activity rebounds, narratives like this are often the most direct beta option.
But don’t get carried away—the risks are just as bare. A historical drawdown of -81% means there’s an extremely heavy overhead bagholding position; every upward breakout will face crushing “get-out” selling pressure. If the next phase’s daily trading volume can’t steadily keep up, and the price can’t fully hold the $0.0016 range, then this is very likely only a technical rebound within a supply/demand contest, not a true trend reversal.
In the cycle, selling shovels is always a good business—provided there are still enough people in the market who believe in the gold rush ⛏️. Do you think this bout of moderate volume in $PUMP is smart money front-running at the lows, or is it a lure for trapped holders to get back at a rescue rally?
Take a look at $PUMP . It’s still down 81% from ATH, but it has quietly climbed 18% over the past 30 days. Its market cap is back to $660 million (ranked #93). From the chart, compared with the panic low it broke below $0.0012 in late June, recent trading activity has expanded alongside daily volumes of around $60 million, and it has formed a slowly rising bottom structure.
As an asset listed on major exchange contracts, $PUMP essentially serves as a liquidity reservoir carrying on-chain PVP sentiment. The spike in trading volume that pushed past $100 million toward the end of June is a notable signal—it suggests capital is attempting to test the lows. When on-chain activity rebounds, narratives like this are often the most direct beta option.
But don’t get carried away—the risks are just as bare. A historical drawdown of -81% means there’s an extremely heavy overhead bagholding position; every upward breakout will face crushing “get-out” selling pressure. If the next phase’s daily trading volume can’t steadily keep up, and the price can’t fully hold the $0.0016 range, then this is very likely only a technical rebound within a supply/demand contest, not a true trend reversal.
In the cycle, selling shovels is always a good business—provided there are still enough people in the market who believe in the gold rush ⛏️. Do you think this bout of moderate volume in $PUMP is smart money front-running at the lows, or is it a lure for trapped holders to get back at a rescue rally?
81
·
--
The former kings who have fallen 96% often end up with only two outcomes: dying in silence, or completing a handoff of chips in obscurity.
Take a look at the data for $ARB . It has already dropped an astonishing 95.98% from its ATH—only 2.39 away. Over the past year, it has nearly gone straight south (-76%). But recently, the chart has sent out abnormal signals: it has quietly risen 23% over the last 7 days. More importantly, the daily average volume has suddenly surged for several consecutive days from the previous range of 30–40 million USD to above 130 million USD.
Money doesn’t lie. After the market cap slid to the edge of 600 million USD (ranked #93), this kind of magnitude of amplification suggests that smart money is testing liquidity in this frozen price zone. Long, grinding downtrends have shaken out a large amount of desperate holdings. When the selling pressure finally exhausts, the capital stepping in is enough to reverse the short-term narrative and form a beautiful bottom lift.
But don’t rush to FOMO just yet. Remember that above $ARB there is a mountain of trapped supply accumulated over the past year—at -95%. That means every little uptick upward above the current level is met with countless hands trying to break even. This current rebound looks more like a technical repair after an oversold drop. If it can’t stay firmly in place with volume above the key range of $0.09, then once the buy-side momentum falls through, there’s a high likelihood this turns into another dead-cat bounce that lures people in.
The real cycle bottom has never been a single sharp corner—it’s a muddy swamp. So, do you think this surge in volume for $ARB is the master plan of the main players, or just cover before the next leg of downward drift?
The former kings who have fallen 96% often end up with only two outcomes: dying in silence, or completing a handoff of chips in obscurity.
Take a look at the data for $ARB . It has already dropped an astonishing 95.98% from its ATH—only 2.39 away. Over the past year, it has nearly gone straight south (-76%). But recently, the chart has sent out abnormal signals: it has quietly risen 23% over the last 7 days. More importantly, the daily average volume has suddenly surged for several consecutive days from the previous range of 30–40 million USD to above 130 million USD.
Money doesn’t lie. After the market cap slid to the edge of 600 million USD (ranked #93), this kind of magnitude of amplification suggests that smart money is testing liquidity in this frozen price zone. Long, grinding downtrends have shaken out a large amount of desperate holdings. When the selling pressure finally exhausts, the capital stepping in is enough to reverse the short-term narrative and form a beautiful bottom lift.
But don’t rush to FOMO just yet. Remember that above $ARB there is a mountain of trapped supply accumulated over the past year—at -95%. That means every little uptick upward above the current level is met with countless hands trying to break even. This current rebound looks more like a technical repair after an oversold drop. If it can’t stay firmly in place with volume above the key range of $0.09, then once the buy-side momentum falls through, there’s a high likelihood this turns into another dead-cat bounce that lures people in.
The real cycle bottom has never been a single sharp corner—it’s a muddy swamp. So, do you think this surge in volume for $ARB is the master plan of the main players, or just cover before the next leg of downward drift?
Take a look at the data for $ARB . It has already dropped an astonishing 95.98% from its ATH—only 2.39 away. Over the past year, it has nearly gone straight south (-76%). But recently, the chart has sent out abnormal signals: it has quietly risen 23% over the last 7 days. More importantly, the daily average volume has suddenly surged for several consecutive days from the previous range of 30–40 million USD to above 130 million USD.
Money doesn’t lie. After the market cap slid to the edge of 600 million USD (ranked #93), this kind of magnitude of amplification suggests that smart money is testing liquidity in this frozen price zone. Long, grinding downtrends have shaken out a large amount of desperate holdings. When the selling pressure finally exhausts, the capital stepping in is enough to reverse the short-term narrative and form a beautiful bottom lift.
But don’t rush to FOMO just yet. Remember that above $ARB there is a mountain of trapped supply accumulated over the past year—at -95%. That means every little uptick upward above the current level is met with countless hands trying to break even. This current rebound looks more like a technical repair after an oversold drop. If it can’t stay firmly in place with volume above the key range of $0.09, then once the buy-side momentum falls through, there’s a high likelihood this turns into another dead-cat bounce that lures people in.
The real cycle bottom has never been a single sharp corner—it’s a muddy swamp. So, do you think this surge in volume for $ARB is the master plan of the main players, or just cover before the next leg of downward drift?
121


·
--
I’m watching the top movers. 1. Pump.fun (PUMP) +15% – breaking into top‑50. 2. Bitcoin (BTC) +2% – still #1. 3. Pons (PONS) +9% – climbing fast. 🔥
My radar spots mid‑caps gaining steam. 4. Pudgy Penguins (PENGU) +7% – holding #93. 5. Collector Crypt (CARDS) +5% – steady rise. 6. Helium (HNT) +4% – edging up. 📈
The dark horse I’m eyeing: 7. Chump Coin (CHUMP) +12% – surprising jump to #827. 🚀
$PROM, $ZKP, $4
I’m watching the top movers. 1. Pump.fun (PUMP) +15% – breaking into top‑50. 2. Bitcoin (BTC) +2% – still #1. 3. Pons (PONS) +9% – climbing fast. 🔥
My radar spots mid‑caps gaining steam. 4. Pudgy Penguins (PENGU) +7% – holding #93. 5. Collector Crypt (CARDS) +5% – steady rise. 6. Helium (HNT) +4% – edging up. 📈
The dark horse I’m eyeing: 7. Chump Coin (CHUMP) +12% – surprising jump to #827. 🚀
$PROM , $ZKP , $4
My radar spots mid‑caps gaining steam. 4. Pudgy Penguins (PENGU) +7% – holding #93. 5. Collector Crypt (CARDS) +5% – steady rise. 6. Helium (HNT) +4% – edging up. 📈
The dark horse I’m eyeing: 7. Chump Coin (CHUMP) +12% – surprising jump to #827. 🚀
$PROM , $ZKP , $4
566

6.2% - that’s the 24-hour drop for $AAVE, and it’s a big one.
AAVE is down 6.2% in 24 hours - a sharp move for a coin that’s otherwise been holding up.
The price action today is a head-scratcher.
AAVE is down sharply, yet the 30-day trajectory shows a slight gain.
At the same time, the funding rate has flipped negative - a sign that perpetual traders are paying to hold short positions.
That doesn’t usually happen when the market is bullish.
It’s a tension between short-term pain and longer-term resilience.
Looking deeper, the 7-day price change is ↓2.2%, and the 30-day is still ↑2.5%.
That’s a mixed signal. The price is falling now, but it’s not breaking the longer-term trend.
The funding rate, though, is a red flag. It’s now ↓0.0035%, which means shorters are paying to hold - and that’s not typically a sign of confidence.
Checkpoint: AAVE’s 30-day price is still up ↑2.5% - if it holds above that level tomorrow, the bearish move today might be a short-term correction.
If it breaks below, that could signal a deeper shift in sentiment.
—
Not financial advice. DYOR.
📌 Gainers Radar · #93 · #Gainers #CryptoSighted $AAVE
6.2% - that’s the 24-hour drop for $AAVE , and it’s a big one.
AAVE is down 6.2% in 24 hours - a sharp move for a coin that’s otherwise been holding up.
The price action today is a head-scratcher.
AAVE is down sharply, yet the 30-day trajectory shows a slight gain.
At the same time, the funding rate has flipped negative - a sign that perpetual traders are paying to hold short positions.
That doesn’t usually happen when the market is bullish.
It’s a tension between short-term pain and longer-term resilience.
Looking deeper, the 7-day price change is ↓2.2%, and the 30-day is still ↑2.5%.
That’s a mixed signal. The price is falling now, but it’s not breaking the longer-term trend.
The funding rate, though, is a red flag. It’s now ↓0.0035%, which means shorters are paying to hold - and that’s not typically a sign of confidence.
Checkpoint: AAVE’s 30-day price is still up ↑2.5% - if it holds above that level tomorrow, the bearish move today might be a short-term correction.
If it breaks below, that could signal a deeper shift in sentiment.
—
Not financial advice. DYOR.
📌 Gainers Radar · #93 · #Gainers #CryptoSighted $AAVE
AAVE is down 6.2% in 24 hours - a sharp move for a coin that’s otherwise been holding up.
The price action today is a head-scratcher.
AAVE is down sharply, yet the 30-day trajectory shows a slight gain.
At the same time, the funding rate has flipped negative - a sign that perpetual traders are paying to hold short positions.
That doesn’t usually happen when the market is bullish.
It’s a tension between short-term pain and longer-term resilience.
Looking deeper, the 7-day price change is ↓2.2%, and the 30-day is still ↑2.5%.
That’s a mixed signal. The price is falling now, but it’s not breaking the longer-term trend.
The funding rate, though, is a red flag. It’s now ↓0.0035%, which means shorters are paying to hold - and that’s not typically a sign of confidence.
Checkpoint: AAVE’s 30-day price is still up ↑2.5% - if it holds above that level tomorrow, the bearish move today might be a short-term correction.
If it breaks below, that could signal a deeper shift in sentiment.
—
Not financial advice. DYOR.
📌 Gainers Radar · #93 · #Gainers #CryptoSighted $AAVE
425
·
--
People who sell shovels are definitely going to make money, but buying and selling stocks of shovel companies isn’t necessarily profitable. The typical example of this logic in crypto is $PUMP.
As one of the most lucrative printing machines of this cycle, $PUMP currently has a market cap of $600 million, getting stuck around the top-100 threshold (#93). But its price is already down nearly 83% from its ATH. Over the past 30 days, it has basically kept repeatedly bumping around $0.0014, and the overall trend is still suppressed. However, some interesting details can be seen in the data: after the late-June dump to a $0.0012 low, a daily trading volume exceeding $100 million appeared immediately after. This kind of classic bottoming with a surge in volume indicates that in the depths of despair, the smart money’s rotation has been more than sufficient. Plus, with it already listed on major exchanges, its liquidity base is absolutely solid.
But the risk is equally glaring—the core issue is a disconnect in value capture. How much of the fees earned by the platform actually gets fed back into $PUMP tokens? That’s an old, well-known hard flaw. From a technical perspective, it’s still a sort of left-side consolidation and repair. If the rebound volume cannot support it to hold above the upper boundary of the $0.0016 box, then this small uptick right now could turn at any moment into a bullish trap that serves as a continuation of the downside.
In a bull market, the most common illusion that makes people lose money is equating a good product with a good token. 👀 What do you think: has $PUMP dropped into alpha, or is it a value trap missing new narrative?
People who sell shovels are definitely going to make money, but buying and selling stocks of shovel companies isn’t necessarily profitable. The typical example of this logic in crypto is $PUMP .
As one of the most lucrative printing machines of this cycle, $PUMP currently has a market cap of $600 million, getting stuck around the top-100 threshold (#93). But its price is already down nearly 83% from its ATH. Over the past 30 days, it has basically kept repeatedly bumping around $0.0014, and the overall trend is still suppressed. However, some interesting details can be seen in the data: after the late-June dump to a $0.0012 low, a daily trading volume exceeding $100 million appeared immediately after. This kind of classic bottoming with a surge in volume indicates that in the depths of despair, the smart money’s rotation has been more than sufficient. Plus, with it already listed on major exchanges, its liquidity base is absolutely solid.
But the risk is equally glaring—the core issue is a disconnect in value capture. How much of the fees earned by the platform actually gets fed back into $PUMP tokens? That’s an old, well-known hard flaw. From a technical perspective, it’s still a sort of left-side consolidation and repair. If the rebound volume cannot support it to hold above the upper boundary of the $0.0016 box, then this small uptick right now could turn at any moment into a bullish trap that serves as a continuation of the downside.
In a bull market, the most common illusion that makes people lose money is equating a good product with a good token. 👀 What do you think: has $PUMP dropped into alpha, or is it a value trap missing new narrative?
As one of the most lucrative printing machines of this cycle, $PUMP currently has a market cap of $600 million, getting stuck around the top-100 threshold (#93). But its price is already down nearly 83% from its ATH. Over the past 30 days, it has basically kept repeatedly bumping around $0.0014, and the overall trend is still suppressed. However, some interesting details can be seen in the data: after the late-June dump to a $0.0012 low, a daily trading volume exceeding $100 million appeared immediately after. This kind of classic bottoming with a surge in volume indicates that in the depths of despair, the smart money’s rotation has been more than sufficient. Plus, with it already listed on major exchanges, its liquidity base is absolutely solid.
But the risk is equally glaring—the core issue is a disconnect in value capture. How much of the fees earned by the platform actually gets fed back into $PUMP tokens? That’s an old, well-known hard flaw. From a technical perspective, it’s still a sort of left-side consolidation and repair. If the rebound volume cannot support it to hold above the upper boundary of the $0.0016 box, then this small uptick right now could turn at any moment into a bullish trap that serves as a continuation of the downside.
In a bull market, the most common illusion that makes people lose money is equating a good product with a good token. 👀 What do you think: has $PUMP dropped into alpha, or is it a value trap missing new narrative?
200
·
--
Many people see that $LIT is up nearly 5% today and their first reaction is: “Oversold rebound—no volume, no chance.” But what’s really easy to misread is this: in the past 30 days it’s up 29%, and the 7-day move was only a 2% pullback. Today’s bullish candle happens to close at $2.26, breaking above the upper edge of the roughly one-week consolidation range. If you look only at the percentage decline, it’s easy to mistake the pullback for the end of the trend; if you focus only on today’s gain, it’s easy to ignore that trading volume is still shrinking—$34M in volume today, compared with $150M at the beginning of July.
What I care about more is that the price has rebounded from $2.03 (the July 25 low) to $2.26. During the rebound there was no surge in volume, but it also did not break below the prior low again. This suggests selling pressure is weakening, yet the buyers haven’t rushed in. The key confirmation needed is: if over the next few days the trading volume can return to above $40M and hold above $2.30, then this pullback is likely just a normal correction within the 30-day uptrend; but if volume continues to contract and the stock keeps churning sideways—or even falls below $2.11 (today’s low)—then the rebound is only a pause for the shorts.
For the bulls, you should watch whether volume can keep expanding, proving that smart money is stepping in to continue the momentum. For the bears, you should also watch volume—but you’re waiting for a signal that comes after the rebound shrinks in volume and then turns into another surge of selling. The same data can be interpreted two different ways, but the judging criteria are public.
$LIT still has 71% to go to ATH, and its market cap ranks at #93. This isn’t a chase-buy zone, but it’s also not a reason to panic. If the next three days can’t get volume up, would you be more inclined to go bearish—or keep waiting?
Many people see that $LIT is up nearly 5% today and their first reaction is: “Oversold rebound—no volume, no chance.” But what’s really easy to misread is this: in the past 30 days it’s up 29%, and the 7-day move was only a 2% pullback. Today’s bullish candle happens to close at $2.26, breaking above the upper edge of the roughly one-week consolidation range. If you look only at the percentage decline, it’s easy to mistake the pullback for the end of the trend; if you focus only on today’s gain, it’s easy to ignore that trading volume is still shrinking—$34M in volume today, compared with $150M at the beginning of July.
What I care about more is that the price has rebounded from $2.03 (the July 25 low) to $2.26. During the rebound there was no surge in volume, but it also did not break below the prior low again. This suggests selling pressure is weakening, yet the buyers haven’t rushed in. The key confirmation needed is: if over the next few days the trading volume can return to above $40M and hold above $2.30, then this pullback is likely just a normal correction within the 30-day uptrend; but if volume continues to contract and the stock keeps churning sideways—or even falls below $2.11 (today’s low)—then the rebound is only a pause for the shorts.
For the bulls, you should watch whether volume can keep expanding, proving that smart money is stepping in to continue the momentum. For the bears, you should also watch volume—but you’re waiting for a signal that comes after the rebound shrinks in volume and then turns into another surge of selling. The same data can be interpreted two different ways, but the judging criteria are public.
$LIT still has 71% to go to ATH, and its market cap ranks at #93. This isn’t a chase-buy zone, but it’s also not a reason to panic. If the next three days can’t get volume up, would you be more inclined to go bearish—or keep waiting?
What I care about more is that the price has rebounded from $2.03 (the July 25 low) to $2.26. During the rebound there was no surge in volume, but it also did not break below the prior low again. This suggests selling pressure is weakening, yet the buyers haven’t rushed in. The key confirmation needed is: if over the next few days the trading volume can return to above $40M and hold above $2.30, then this pullback is likely just a normal correction within the 30-day uptrend; but if volume continues to contract and the stock keeps churning sideways—or even falls below $2.11 (today’s low)—then the rebound is only a pause for the shorts.
For the bulls, you should watch whether volume can keep expanding, proving that smart money is stepping in to continue the momentum. For the bears, you should also watch volume—but you’re waiting for a signal that comes after the rebound shrinks in volume and then turns into another surge of selling. The same data can be interpreted two different ways, but the judging criteria are public.
$LIT still has 71% to go to ATH, and its market cap ranks at #93. This isn’t a chase-buy zone, but it’s also not a reason to panic. If the next three days can’t get volume up, would you be more inclined to go bearish—or keep waiting?
8
·
--
Only look at the last 24 hours of $LIT (-5.08%). You’ll feel it’s in a pullback. Zoom out to 7 days (-5.21%), and the conclusion doesn’t change. But switch to 30 days, and it’s up +28.69%—it turns out the price was pushed from 1.86 all the way to 2.68, and now it has fallen back to 2.21, just sitting around the middle of that rally.
The key to understanding this coin is the mismatch in timeframes. That surge in early July (July 2, where volume hit 150M) shows clear signs of accumulation with rising volume. After that, over the next two weeks, price bounced repeatedly between 2.15 and 2.58, while trading volume stepped down each time. In the past few days, it’s even tightened to just 20–30M. This doesn’t look like panic selling; it looks more like a low-volume consolidation after a push higher. What I care about most is whether this consolidation range gets broken.
If the 30-day gain is only the first half of the trend, then $2.15–$2.19 is the bulls’ line of defense. If it breaks, the price may retest the prior low at 2.03. But if, after a low-volume consolidation, volume expands and price pushes again toward 2.30–2.45, then the swing-trade logic is still intact. However, don’t ignore one risk: $LIT is down 72% from its ATH, with a market cap of 550M and ranking #93. This isn’t exactly a pure “undervalued” zone. After a 30% jump, those who chase at this point are likely standing near a temporary high.
Are you watching the 24-hour chart and worrying it might keep dropping, or are you looking at the 30-day view and seeing the pullback as a chance to accumulate? That will determine whether you monitor the effectiveness of $2.15 support, or wait for a volume-backed breakout above $2.30 before acting.
Only look at the last 24 hours of $LIT (-5.08%). You’ll feel it’s in a pullback. Zoom out to 7 days (-5.21%), and the conclusion doesn’t change. But switch to 30 days, and it’s up +28.69%—it turns out the price was pushed from 1.86 all the way to 2.68, and now it has fallen back to 2.21, just sitting around the middle of that rally.
The key to understanding this coin is the mismatch in timeframes. That surge in early July (July 2, where volume hit 150M) shows clear signs of accumulation with rising volume. After that, over the next two weeks, price bounced repeatedly between 2.15 and 2.58, while trading volume stepped down each time. In the past few days, it’s even tightened to just 20–30M. This doesn’t look like panic selling; it looks more like a low-volume consolidation after a push higher. What I care about most is whether this consolidation range gets broken.
If the 30-day gain is only the first half of the trend, then $2.15–$2.19 is the bulls’ line of defense. If it breaks, the price may retest the prior low at 2.03. But if, after a low-volume consolidation, volume expands and price pushes again toward 2.30–2.45, then the swing-trade logic is still intact. However, don’t ignore one risk: $LIT is down 72% from its ATH, with a market cap of 550M and ranking #93. This isn’t exactly a pure “undervalued” zone. After a 30% jump, those who chase at this point are likely standing near a temporary high.
Are you watching the 24-hour chart and worrying it might keep dropping, or are you looking at the 30-day view and seeing the pullback as a chance to accumulate? That will determine whether you monitor the effectiveness of $2.15 support, or wait for a volume-backed breakout above $2.30 before acting.
The key to understanding this coin is the mismatch in timeframes. That surge in early July (July 2, where volume hit 150M) shows clear signs of accumulation with rising volume. After that, over the next two weeks, price bounced repeatedly between 2.15 and 2.58, while trading volume stepped down each time. In the past few days, it’s even tightened to just 20–30M. This doesn’t look like panic selling; it looks more like a low-volume consolidation after a push higher. What I care about most is whether this consolidation range gets broken.
If the 30-day gain is only the first half of the trend, then $2.15–$2.19 is the bulls’ line of defense. If it breaks, the price may retest the prior low at 2.03. But if, after a low-volume consolidation, volume expands and price pushes again toward 2.30–2.45, then the swing-trade logic is still intact. However, don’t ignore one risk: $LIT is down 72% from its ATH, with a market cap of 550M and ranking #93. This isn’t exactly a pure “undervalued” zone. After a 30% jump, those who chase at this point are likely standing near a temporary high.
Are you watching the 24-hour chart and worrying it might keep dropping, or are you looking at the 30-day view and seeing the pullback as a chance to accumulate? That will determine whether you monitor the effectiveness of $2.15 support, or wait for a volume-backed breakout above $2.30 before acting.
5
·
--
🏆 FLIPPENING
💰 Ethereum just flipped American Express!
$ETH $230.99B · now #93 of all assets
Passed American Express ($230.22B)
🍳 Crypto vs the whole world. Not financial advice.
#CookingBNB #Crypto #Bitcoin #BTC
🏆 FLIPPENING
💰 Ethereum just flipped American Express!
$ETH $230.99B · now #93 of all assets
Passed American Express ($230.22B)
🍳 Crypto vs the whole world. Not financial advice.
#CookingBNB #Crypto #Bitcoin #BTC
💰 Ethereum just flipped American Express!
$ETH $230.99B · now #93 of all assets
Passed American Express ($230.22B)
🍳 Crypto vs the whole world. Not financial advice.
#CookingBNB #Crypto #Bitcoin #BTC

56
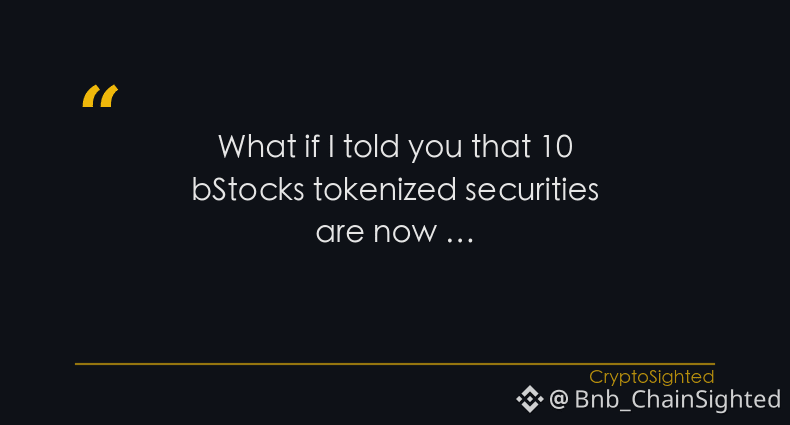
What if I told you that 10 bStocks tokenized securities are now being used as collateral assets on Binance - and this could be a sign of something bigger?
Tokenization is the process of converting real-world assets - like company shares, real estate, or even art - into digital tokens that can be bought, sold, and stored on a blockchain. It’s not just about making things digital; it’s about making ownership more flexible, transparent, and accessible. And with bStocks, Binance is trying to do just that.
Market Access: Who Gets In?
The Bigger Picture: What’s Next?
So, what’s your take? Is this the next big shift - or just a passing experiment?
—
For educational purposes only. Not financial advice.
📌 Crypto 101 · #93 · #CryptoEducation #CryptoSighted
What if I told you that 10 bStocks tokenized securities are now being used as collateral assets on Binance - and this could be a sign of something bigger?
Tokenization is the process of converting real-world assets - like company shares, real estate, or even art - into digital tokens that can be bought, sold, and stored on a blockchain. It’s not just about making things digital; it’s about making ownership more flexible, transparent, and accessible. And with bStocks, Binance is trying to do just that.
Market Access: Who Gets In?
The Bigger Picture: What’s Next?
So, what’s your take? Is this the next big shift - or just a passing experiment?
—
For educational purposes only. Not financial advice.
📌 Crypto 101 · #93 · #CryptoEducation #CryptoSighted
Tokenization is the process of converting real-world assets - like company shares, real estate, or even art - into digital tokens that can be bought, sold, and stored on a blockchain. It’s not just about making things digital; it’s about making ownership more flexible, transparent, and accessible. And with bStocks, Binance is trying to do just that.
Market Access: Who Gets In?
The Bigger Picture: What’s Next?
So, what’s your take? Is this the next big shift - or just a passing experiment?
—
For educational purposes only. Not financial advice.
📌 Crypto 101 · #93 · #CryptoEducation #CryptoSighted
474

·
--
I've been tracking the latest trends on CoinGecko, and I'm excited to share my findings with you. The crypto market is constantly evolving, with new tokens emerging and gaining traction. I'm seeing a lot of interest in tokens like Lighter (LIT) and Venice Token (VVV), which are currently ranked #93 and #99 in terms of market capitalization, respectively.
I've noticed that some of these tokens have been experiencing significant price movements, with The Black Bull (ANSEM) and Synapse (SYN) being notable examples. Other tokens, such as Pudgy Penguins (PENGU) and Bittensor (TAO), are also worth keeping an eye on, with market cap ranks of #114 and #41. Hyperliquid (HYPE) is another token that's been making waves, currently sitting at #10 in terms of market capitalization 🚀.
I'm keen to see how these tokens will perform in the coming days and weeks. With the crypto market being as volatile as it is, it's essential to stay up-to-date with the latest trends and developments 💰. I'll be keeping a close eye on these tokens and sharing my insights with you 📊. Overall, it's an exciting time for crypto 🚀.
$TLM, $SYN, $TLM
I've been tracking the latest trends on CoinGecko, and I'm excited to share my findings with you. The crypto market is constantly evolving, with new tokens emerging and gaining traction. I'm seeing a lot of interest in tokens like Lighter (LIT) and Venice Token (VVV), which are currently ranked #93 and #99 in terms of market capitalization, respectively.
I've noticed that some of these tokens have been experiencing significant price movements, with The Black Bull (ANSEM) and Synapse (SYN) being notable examples. Other tokens, such as Pudgy Penguins (PENGU) and Bittensor (TAO), are also worth keeping an eye on, with market cap ranks of #114 and #41. Hyperliquid (HYPE) is another token that's been making waves, currently sitting at #10 in terms of market capitalization 🚀.
I'm keen to see how these tokens will perform in the coming days and weeks. With the crypto market being as volatile as it is, it's essential to stay up-to-date with the latest trends and developments 💰. I'll be keeping a close eye on these tokens and sharing my insights with you 📊. Overall, it's an exciting time for crypto 🚀.
$TLM , $SYN , $TLM
I've noticed that some of these tokens have been experiencing significant price movements, with The Black Bull (ANSEM) and Synapse (SYN) being notable examples. Other tokens, such as Pudgy Penguins (PENGU) and Bittensor (TAO), are also worth keeping an eye on, with market cap ranks of #114 and #41. Hyperliquid (HYPE) is another token that's been making waves, currently sitting at #10 in terms of market capitalization 🚀.
I'm keen to see how these tokens will perform in the coming days and weeks. With the crypto market being as volatile as it is, it's essential to stay up-to-date with the latest trends and developments 💰. I'll be keeping a close eye on these tokens and sharing my insights with you 📊. Overall, it's an exciting time for crypto 🚀.
$TLM , $SYN , $TLM
82
·
--
$LIT Today it’s up 8.8%, and it looks like another round of upside. But I’m more inclined to believe this is just a rebound after the sharp drop earlier, not a fresh start to the trend.
Why? Look at two details. First, over the 30-day range, it moved from $1.72 to $2.68 (+56%), then fell back to $2.03, and now it has bounced to $2.24. However, the volume for today’s bullish candle is only $36.6M, while the two surges on July 2nd and July 7th were both over $150M. Volume is clearly contracting, which suggests the willingness to chase higher prices is declining. Second, it’s still 71% away from its ATH, with a market cap rank of #93—squarely in the middle of the pack, without an alpha-level narrative that points particularly to it.
What I care about more is that within this 30-day +26% move, the price structure is “fast pump – slow bleed – rebound,” rather than a platform consolidation following a breakout on heavy volume. Capital is rotating, but the durability is questionable. If there isn’t some new catalyst—news or on-chain data—then a sentiment-based repair alone will be hard to hold above $2.4.
For people holding positions now, the question is: if it again touches the $2.28–$2.30 range on reduced volume but fails to break higher, should you cut exposure? For observers who are waiting, what they should be watching is whether volume can expand again to $50M+ or whether the price can effectively break above the prior high of $2.68.
What’s the most likely variable to overturn this view? For example, whales increasing their holdings, a protocol update, or the broader market suddenly breaking out on higher volume—which factor do you think, if it appears, would make the conclusion “a repair, not a restart” no longer hold?
$LIT Today it’s up 8.8%, and it looks like another round of upside. But I’m more inclined to believe this is just a rebound after the sharp drop earlier, not a fresh start to the trend.
Why? Look at two details. First, over the 30-day range, it moved from $1.72 to $2.68 (+56%), then fell back to $2.03, and now it has bounced to $2.24. However, the volume for today’s bullish candle is only $36.6M, while the two surges on July 2nd and July 7th were both over $150M. Volume is clearly contracting, which suggests the willingness to chase higher prices is declining. Second, it’s still 71% away from its ATH, with a market cap rank of #93—squarely in the middle of the pack, without an alpha-level narrative that points particularly to it.
What I care about more is that within this 30-day +26% move, the price structure is “fast pump – slow bleed – rebound,” rather than a platform consolidation following a breakout on heavy volume. Capital is rotating, but the durability is questionable. If there isn’t some new catalyst—news or on-chain data—then a sentiment-based repair alone will be hard to hold above $2.4.
For people holding positions now, the question is: if it again touches the $2.28–$2.30 range on reduced volume but fails to break higher, should you cut exposure? For observers who are waiting, what they should be watching is whether volume can expand again to $50M+ or whether the price can effectively break above the prior high of $2.68.
What’s the most likely variable to overturn this view? For example, whales increasing their holdings, a protocol update, or the broader market suddenly breaking out on higher volume—which factor do you think, if it appears, would make the conclusion “a repair, not a restart” no longer hold?
Why? Look at two details. First, over the 30-day range, it moved from $1.72 to $2.68 (+56%), then fell back to $2.03, and now it has bounced to $2.24. However, the volume for today’s bullish candle is only $36.6M, while the two surges on July 2nd and July 7th were both over $150M. Volume is clearly contracting, which suggests the willingness to chase higher prices is declining. Second, it’s still 71% away from its ATH, with a market cap rank of #93—squarely in the middle of the pack, without an alpha-level narrative that points particularly to it.
What I care about more is that within this 30-day +26% move, the price structure is “fast pump – slow bleed – rebound,” rather than a platform consolidation following a breakout on heavy volume. Capital is rotating, but the durability is questionable. If there isn’t some new catalyst—news or on-chain data—then a sentiment-based repair alone will be hard to hold above $2.4.
For people holding positions now, the question is: if it again touches the $2.28–$2.30 range on reduced volume but fails to break higher, should you cut exposure? For observers who are waiting, what they should be watching is whether volume can expand again to $50M+ or whether the price can effectively break above the prior high of $2.68.
What’s the most likely variable to overturn this view? For example, whales increasing their holdings, a protocol update, or the broader market suddenly breaking out on higher volume—which factor do you think, if it appears, would make the conclusion “a repair, not a restart” no longer hold?
60
·
--
🏆 FLIPPENING
💰 Ethereum just flipped Arista Networks!
$ETH $225.28B · now #93 of all assets
Passed Arista Networks ($224.07B)
🍳 Crypto vs the whole world. Not financial advice.
#CookingBNB #Crypto #Bitcoin #BTC
🏆 FLIPPENING
💰 Ethereum just flipped Arista Networks!
$ETH $225.28B · now #93 of all assets
Passed Arista Networks ($224.07B)
🍳 Crypto vs the whole world. Not financial advice.
#CookingBNB #Crypto #Bitcoin #BTC
💰 Ethereum just flipped Arista Networks!
$ETH $225.28B · now #93 of all assets
Passed Arista Networks ($224.07B)
🍳 Crypto vs the whole world. Not financial advice.
#CookingBNB #Crypto #Bitcoin #BTC

19

·
--
We're tracking the latest trends on CoinGecko, where The Black Bull (ANSEM) and Solstice (SLX) are gaining attention 🚀. Our community is interested in these emerging tokens, along with Velvet (VELVET) and Pudgy Penguins (PENGU), which are currently ranked #88 and #118 respectively.
We're also seeing established tokens like Bitcoin (BTC) maintaining their market cap rank #1, while Bittensor (TAO) and Pump.fun (PUMP) are ranked #41 and #93. Our data shows a diverse range of tokens trending, with varying market cap ranks.
We're excited to see how these tokens will perform in the future, and we're keeping a close eye on their progress 💡. With the crypto market constantly evolving, we're always looking for new opportunities, and our community is ready to adapt to any changes that come our way 📊.
$S, $POWR, $VELVET
We're tracking the latest trends on CoinGecko, where The Black Bull (ANSEM) and Solstice (SLX) are gaining attention 🚀. Our community is interested in these emerging tokens, along with Velvet (VELVET) and Pudgy Penguins (PENGU), which are currently ranked #88 and #118 respectively.
We're also seeing established tokens like Bitcoin (BTC) maintaining their market cap rank #1, while Bittensor (TAO) and Pump.fun (PUMP) are ranked #41 and #93. Our data shows a diverse range of tokens trending, with varying market cap ranks.
We're excited to see how these tokens will perform in the future, and we're keeping a close eye on their progress 💡. With the crypto market constantly evolving, we're always looking for new opportunities, and our community is ready to adapt to any changes that come our way 📊.
$S , $POWR , $VELVET
We're also seeing established tokens like Bitcoin (BTC) maintaining their market cap rank #1, while Bittensor (TAO) and Pump.fun (PUMP) are ranked #41 and #93. Our data shows a diverse range of tokens trending, with varying market cap ranks.
We're excited to see how these tokens will perform in the future, and we're keeping a close eye on their progress 💡. With the crypto market constantly evolving, we're always looking for new opportunities, and our community is ready to adapt to any changes that come our way 📊.
$S , $POWR , $VELVET
1
436
·
--
🏆 FLIPPENING
💰 Ethereum just flipped Invesco QQQ ETF!
$ETH $232.05B · now #93 of all assets
Passed Invesco QQQ ETF ($231.73B)
🍳 Crypto vs the whole world. Not financial advice.
#CookingBNB #Crypto #Bitcoin #BTC
🏆 FLIPPENING
💰 Ethereum just flipped Invesco QQQ ETF!
$ETH $232.05B · now #93 of all assets
Passed Invesco QQQ ETF ($231.73B)
🍳 Crypto vs the whole world. Not financial advice.
#CookingBNB #Crypto #Bitcoin #BTC
💰 Ethereum just flipped Invesco QQQ ETF!
$ETH $232.05B · now #93 of all assets
Passed Invesco QQQ ETF ($231.73B)
🍳 Crypto vs the whole world. Not financial advice.
#CookingBNB #Crypto #Bitcoin #BTC

24
Log in to explore more content
Join global crypto users on Binance Square
⚡️ Get latest and useful information about crypto.
💬 Trusted by the world’s largest crypto exchange.
👍 Discover real insights from verified creators.
Email / Phone number
Trending Topics
1
#ZcashETFPostsFirstWeeklyOutflow$93.6M
36,326 views
105 Discussing
2
#GreekPoliceBustCryptoScamRingArrest17
81,691 views
708 Discussing
3
#BitcoinRejectedAt$87K
124,938 views
164 Discussing
4
#FedOctoberRateHikeOddsFallTo17%
106,482 views
994 Discussing
5
#NvidiaHitsRecordHighUp2.4%
73,991 views
717 Discussing
6
#CanaryFilesAmendedS1ForPEPEETF
20,542 views
508 Discussing
7
#USRussiaUkraineTalksReportedlyIncludeLukoilOilDeal
31,373 views
498 Discussing
8
#BitcoinParesGainsAfterRallyTo$86.5K
48,066 views
167 Discussing
9
#CerebrasSinksNearly20%OnReportNvidiaToPowerOpenAI
118,058 views
1,120 Discussing
10
#SECProposesCryptoCustodyRules
160,036 views
1,396 Discussing