
#wdc
wdc
78,570 views
893 Discussing
Hot
Latest

·
--
📊 WDC Technical Analysis & Setup
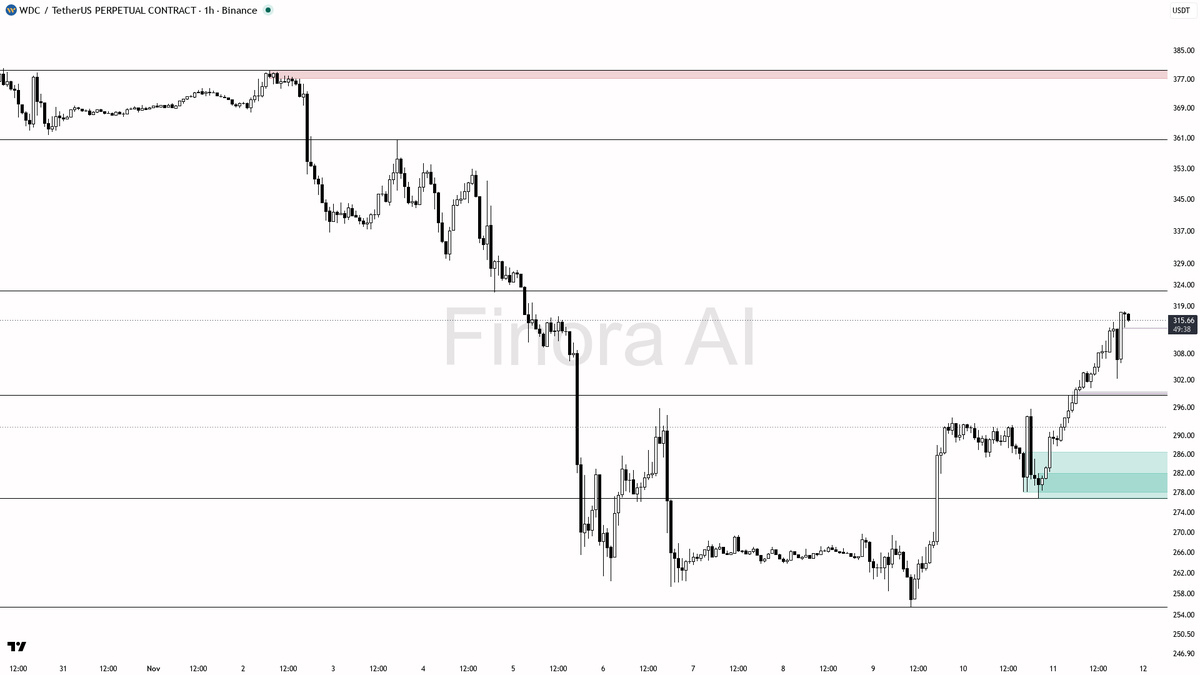
WDC is up 12.3%, holding above 1h demand in a short-term uptrend, but running against higher-timeframe bearish structure with a 4h bearish divergence vs BTC signalling late-stage exhaustion.
• Key Support / Demand: 293.8 to 297.4 FVG cluster, structural lows at 283.5 and 276.8
• Resistance / Supply Targets: 315.6, 323.2, and 329.8
• Trigger / Confirmation: SFP and bullish engulfing at the 293.8 demand zone for longs, or an impulsive break below 293.8 for shorts
• Risk / Invalidation: A 1h close below 276.8 completely invalidates the bullish setup and flips structure bearish
• Market Execution: Monitor volume and standard order book depth carefully during liquidity sweeps
DYOR — Educational setup, not financial advice.
#BinanceSquare #Crypto #WDC #Trading
$BTC
📊 WDC Technical Analysis & Setup
WDC is up 12.3%, holding above 1h demand in a short-term uptrend, but running against higher-timeframe bearish structure with a 4h bearish divergence vs BTC signalling late-stage exhaustion.
• Key Support / Demand: 293.8 to 297.4 FVG cluster, structural lows at 283.5 and 276.8
• Resistance / Supply Targets: 315.6, 323.2, and 329.8
• Trigger / Confirmation: SFP and bullish engulfing at the 293.8 demand zone for longs, or an impulsive break below 293.8 for shorts
• Risk / Invalidation: A 1h close below 276.8 completely invalidates the bullish setup and flips structure bearish
• Market Execution: Monitor volume and standard order book depth carefully during liquidity sweeps
DYOR — Educational setup, not financial advice.
#BinanceSquare #Crypto #WDC #Trading
$BTC
WDC is up 12.3%, holding above 1h demand in a short-term uptrend, but running against higher-timeframe bearish structure with a 4h bearish divergence vs BTC signalling late-stage exhaustion.
• Key Support / Demand: 293.8 to 297.4 FVG cluster, structural lows at 283.5 and 276.8
• Resistance / Supply Targets: 315.6, 323.2, and 329.8
• Trigger / Confirmation: SFP and bullish engulfing at the 293.8 demand zone for longs, or an impulsive break below 293.8 for shorts
• Risk / Invalidation: A 1h close below 276.8 completely invalidates the bullish setup and flips structure bearish
• Market Execution: Monitor volume and standard order book depth carefully during liquidity sweeps
DYOR — Educational setup, not financial advice.
#BinanceSquare #Crypto #WDC #Trading
$BTC
3

·
--
$WDC #WDC
Movement Alert: Long Signal | WDC
15m: 1h bullish movement watch
1h: Rising volume / strengthening structure
4h: Early signs of strengthening
pump_score: 10/12
Current price: 313.25
Breakout level: 313.25
Support level: 295.99
Upside levels to watch: 344.58 / 375.90
Funding rate: +0.0000% (longs and shorts balanced)
For technical observation only; not investment advice.
$WDC #WDC
Movement Alert: Long Signal | WDC
15m: 1h bullish movement watch
1h: Rising volume / strengthening structure
4h: Early signs of strengthening
pump_score: 10/12
Current price: 313.25
Breakout level: 313.25
Support level: 295.99
Upside levels to watch: 344.58 / 375.90
Funding rate: +0.0000% (longs and shorts balanced)
For technical observation only; not investment advice.
Movement Alert: Long Signal | WDC
15m: 1h bullish movement watch
1h: Rising volume / strengthening structure
4h: Early signs of strengthening
pump_score: 10/12
Current price: 313.25
Breakout level: 313.25
Support level: 295.99
Upside levels to watch: 344.58 / 375.90
Funding rate: +0.0000% (longs and shorts balanced)
For technical observation only; not investment advice.
153

·
--
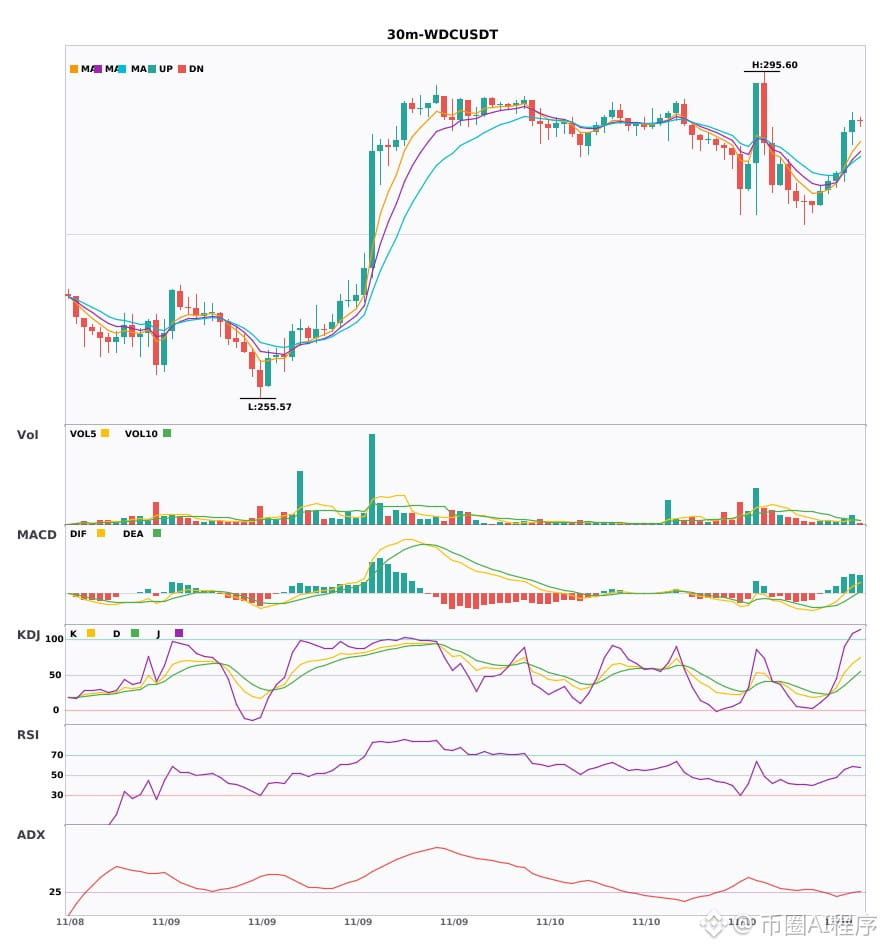
$WDC 30-minute multi-timeframe confluence, 4-hour bullish trend confirmed 🔥
════════════════════
🔴 $WDC 30-minute bullish signal
⚠️ Technical analysis: 4-hour bullish confluence confirmed | 30-minute entry: MACD bullish, trend strong, momentum strengthening | EMA5 > EMA8 > EMA13 bullish alignment | Increased trading volume (1.7x)
════════════════════
🔔 Follow for first-hand market updates 🔔
#多周期共振 #WDC
📌 When trading, pay attention to whether the candlestick patterns meet the criteria
$WDC 30-minute multi-timeframe confluence, 4-hour bullish trend confirmed 🔥
════════════════════
🔴 $WDC 30-minute bullish signal
⚠️ Technical analysis: 4-hour bullish confluence confirmed | 30-minute entry: MACD bullish, trend strong, momentum strengthening | EMA5 > EMA8 > EMA13 bullish alignment | Increased trading volume (1.7x)
════════════════════
🔔 Follow for first-hand market updates 🔔
#多周期共振 #WDC
📌 When trading, pay attention to whether the candlestick patterns meet the criteria
════════════════════
🔴 $WDC 30-minute bullish signal
⚠️ Technical analysis: 4-hour bullish confluence confirmed | 30-minute entry: MACD bullish, trend strong, momentum strengthening | EMA5 > EMA8 > EMA13 bullish alignment | Increased trading volume (1.7x)
════════════════════
🔔 Follow for first-hand market updates 🔔
#多周期共振 #WDC
📌 When trading, pay attention to whether the candlestick patterns meet the criteria
7

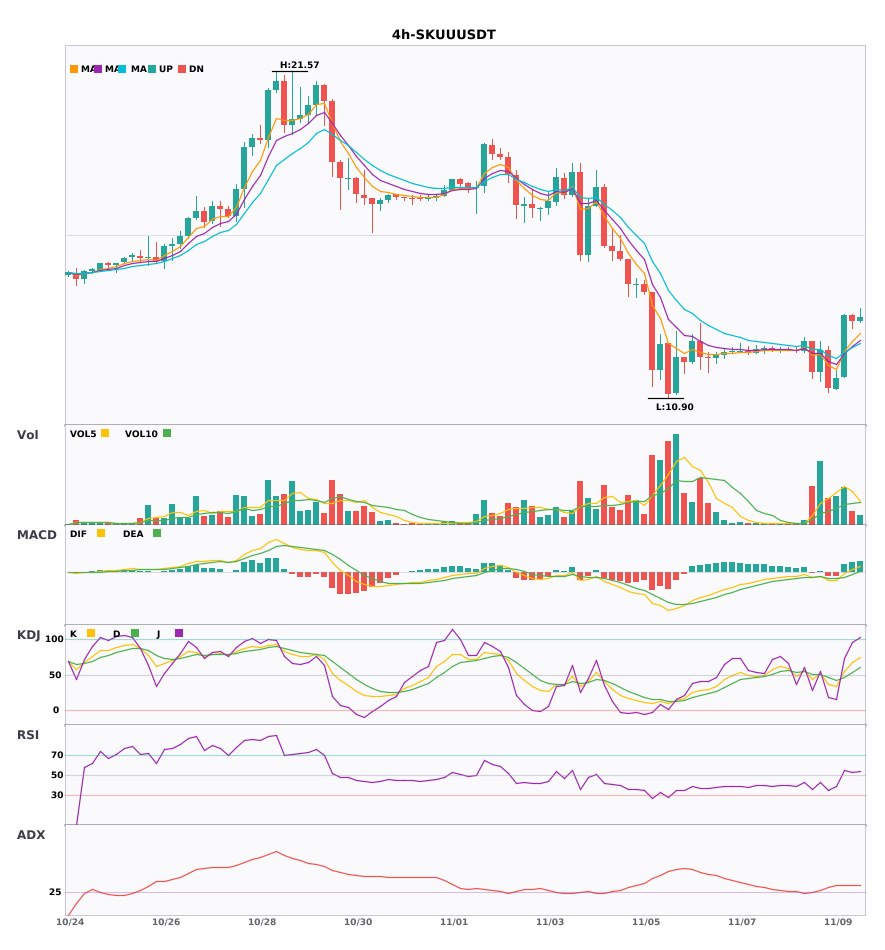
3 simultaneous 4-hour bullish signals: $WDC / $KORU / $SKUU
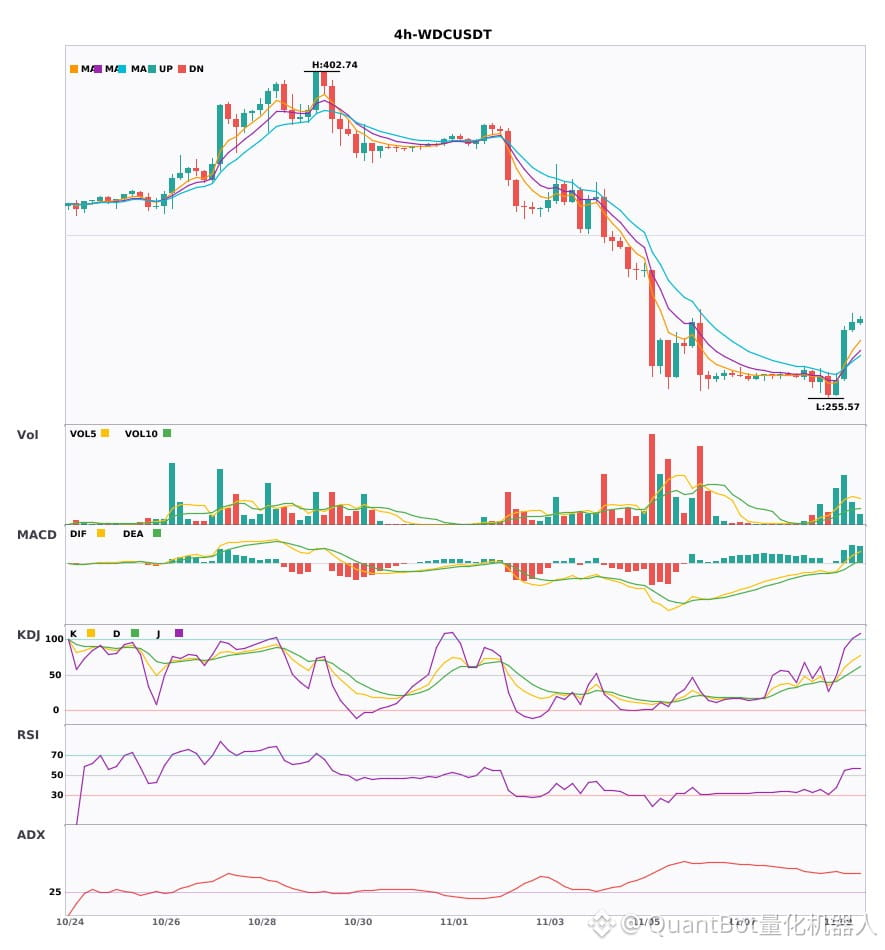
📈 $WDC | 4-hour bullish signal
━━━━━━━━━━━━━━━━━━
Technical analysis: ADX(46) Very strong trend (beware of overbought pullbacks) | MACD is bullish, with a strong trend and increasing momentum | EMA5 > EMA8 > EMA13, bullish alignment | KDJ is strong, with bulls in control (K: 70.2, D: 55.0) | Volume surge (3.6x)
Price change: 1.1600%
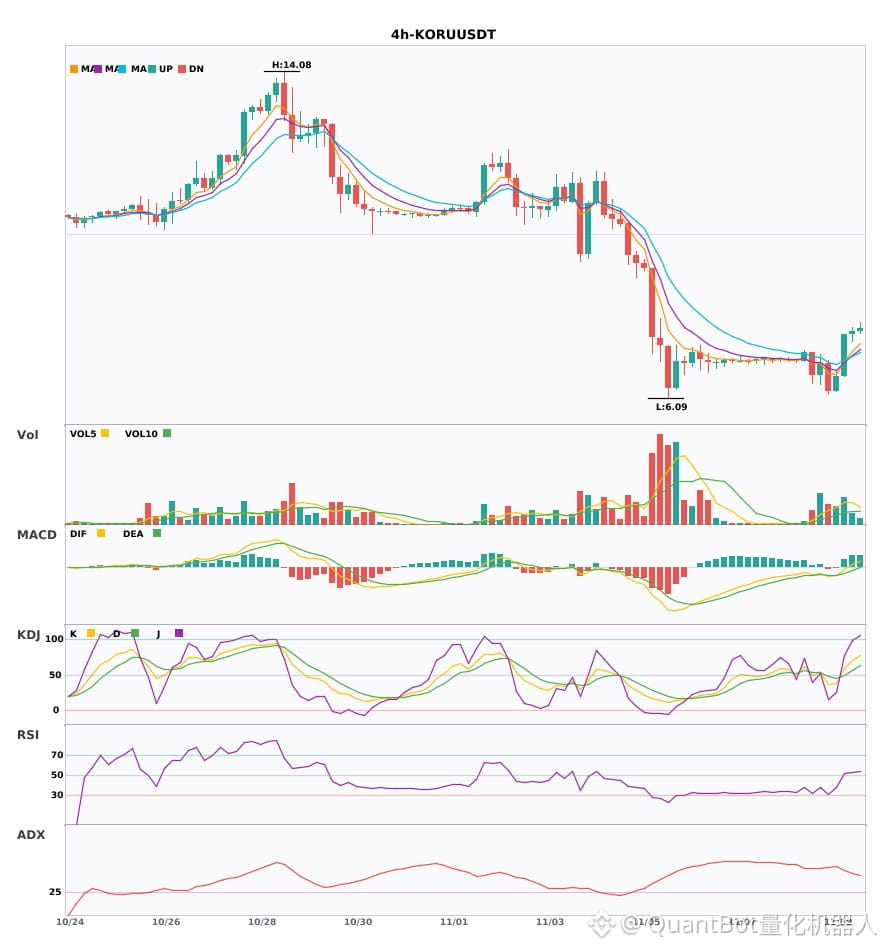
📈 $KORU | 4-hour bullish signal
━━━━━━━━━━━━━━━━━━
Technical analysis: ADX(46) Very strong trend (beware of overbought pullbacks) | MACD DIF breaks above the zero line, signaling a bullish trend reversal | EMA5 > EMA8 > EMA13, bullish alignment | KDJ is strong, with bulls in control (K: 70.5, D: 56.4) | Increased volume (2.3x)
Price change: 0.9200%
📈 $SKUU | 4-hour bullish signal
━━━━━━━━━━━━━━━━━━
Technical analysis: ADX(34) Clear trending market | MACD DIF breaks above the zero line, signaling a bullish trend reversal | EMA5 > EMA8 > EMA13, bullish alignment | KDJ is strong, with bulls in control (K: 67.4, D: 53.5) | Increased volume (1.8x)
Price change: -1.3200%
━━━━━━━━━━━━━━━━━━
#技术分析 #WDC #KORU #SKUU
📌 The above content is for reference only and does not constitute investment advice
3 simultaneous 4-hour bullish signals: $WDC / $KORU / $SKUU
📈 $WDC | 4-hour bullish signal
━━━━━━━━━━━━━━━━━━
Technical analysis: ADX(46) Very strong trend (beware of overbought pullbacks) | MACD is bullish, with a strong trend and increasing momentum | EMA5 > EMA8 > EMA13, bullish alignment | KDJ is strong, with bulls in control (K: 70.2, D: 55.0) | Volume surge (3.6x)
Price change: 1.1600%
📈 $KORU | 4-hour bullish signal
━━━━━━━━━━━━━━━━━━
Technical analysis: ADX(46) Very strong trend (beware of overbought pullbacks) | MACD DIF breaks above the zero line, signaling a bullish trend reversal | EMA5 > EMA8 > EMA13, bullish alignment | KDJ is strong, with bulls in control (K: 70.5, D: 56.4) | Increased volume (2.3x)
Price change: 0.9200%
📈 $SKUU | 4-hour bullish signal
━━━━━━━━━━━━━━━━━━
Technical analysis: ADX(34) Clear trending market | MACD DIF breaks above the zero line, signaling a bullish trend reversal | EMA5 > EMA8 > EMA13, bullish alignment | KDJ is strong, with bulls in control (K: 67.4, D: 53.5) | Increased volume (1.8x)
Price change: -1.3200%
━━━━━━━━━━━━━━━━━━
#技术分析 #WDC #KORU #SKUU
📌 The above content is for reference only and does not constitute investment advice
📈 $WDC | 4-hour bullish signal
━━━━━━━━━━━━━━━━━━
Technical analysis: ADX(46) Very strong trend (beware of overbought pullbacks) | MACD is bullish, with a strong trend and increasing momentum | EMA5 > EMA8 > EMA13, bullish alignment | KDJ is strong, with bulls in control (K: 70.2, D: 55.0) | Volume surge (3.6x)
Price change: 1.1600%
📈 $KORU | 4-hour bullish signal
━━━━━━━━━━━━━━━━━━
Technical analysis: ADX(46) Very strong trend (beware of overbought pullbacks) | MACD DIF breaks above the zero line, signaling a bullish trend reversal | EMA5 > EMA8 > EMA13, bullish alignment | KDJ is strong, with bulls in control (K: 70.5, D: 56.4) | Increased volume (2.3x)
Price change: 0.9200%
📈 $SKUU | 4-hour bullish signal
━━━━━━━━━━━━━━━━━━
Technical analysis: ADX(34) Clear trending market | MACD DIF breaks above the zero line, signaling a bullish trend reversal | EMA5 > EMA8 > EMA13, bullish alignment | KDJ is strong, with bulls in control (K: 67.4, D: 53.5) | Increased volume (1.8x)
Price change: -1.3200%
━━━━━━━━━━━━━━━━━━
#技术分析 #WDC #KORU #SKUU
📌 The above content is for reference only and does not constitute investment advice
26

·
--
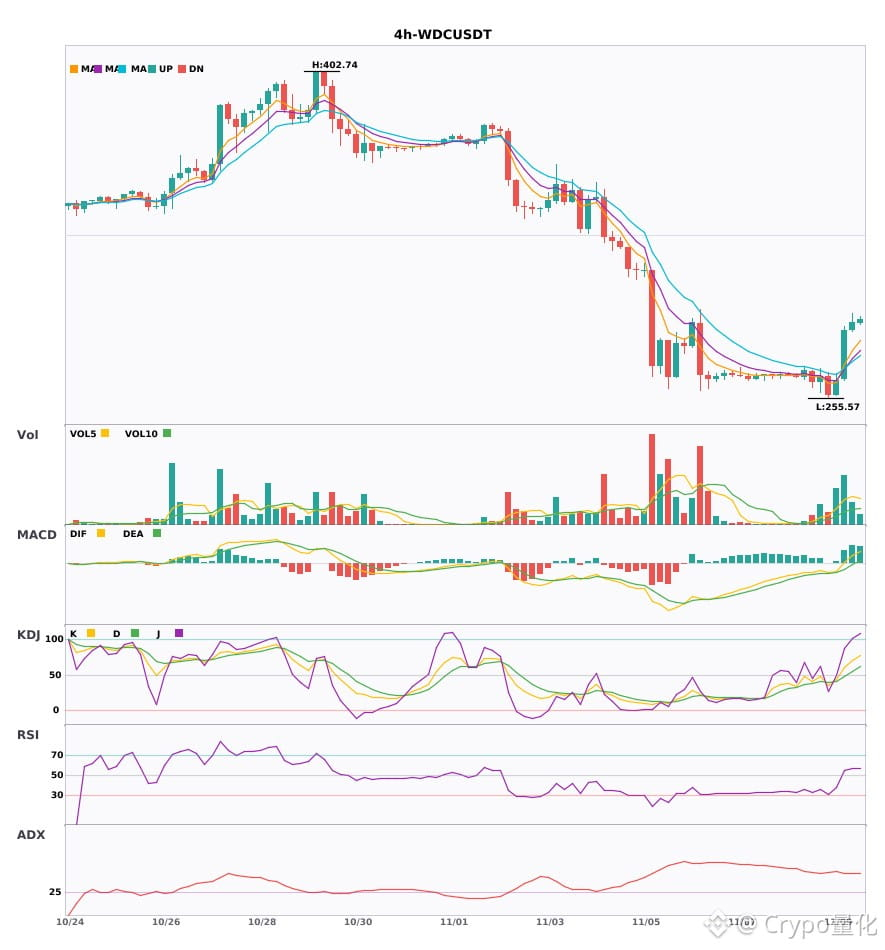
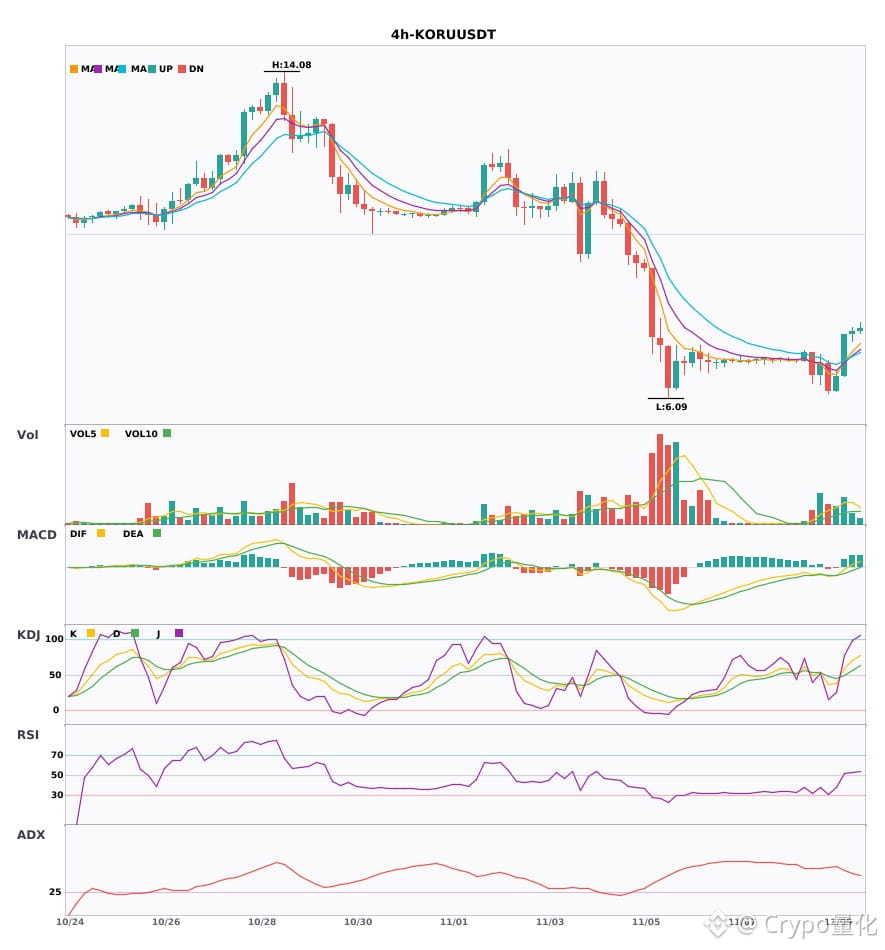
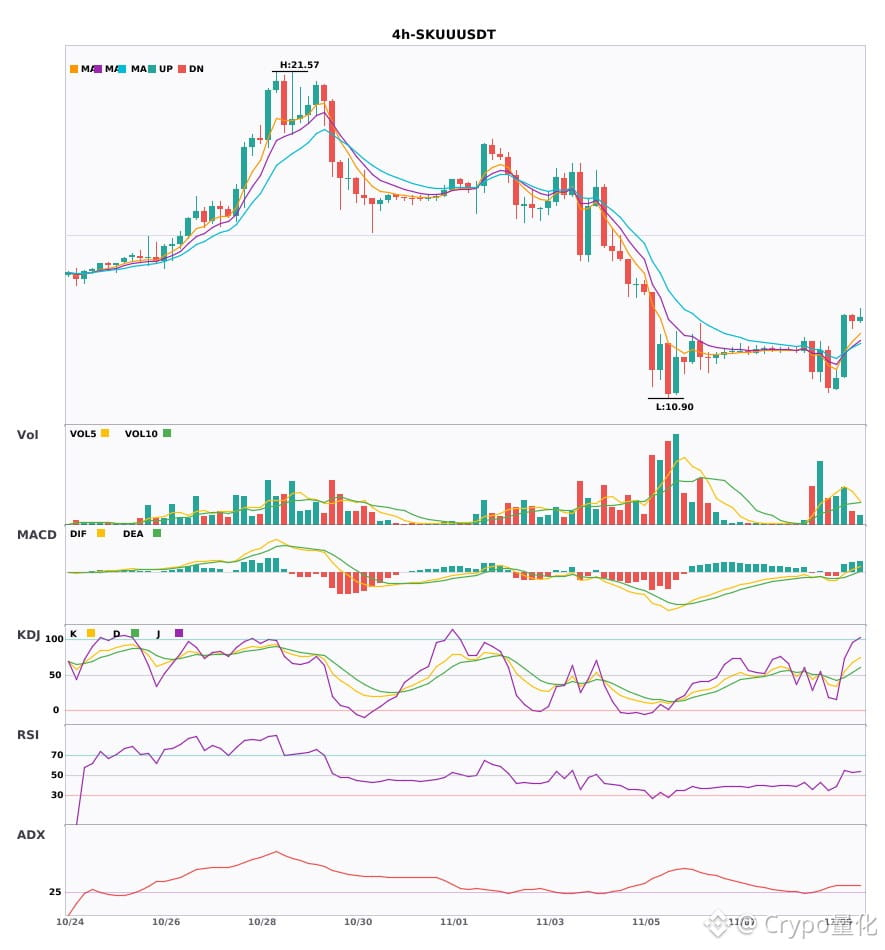
$WDC / $KORU / $SKUU 4-hour technical indicators are strengthening simultaneously—which has the greatest breakout potential?🔥
════════════════════
🔴 $WDC 4-hour bullish signal
⚠️Technical indicators: ADX(46) indicates a very strong trend (beware of an overheated pullback) | MACD is bullish, with a strong trend and increasing momentum | EMA5 > EMA8 > EMA13, bullish alignment | KDJ is strong, with bulls in control (K: 70.2, D: 55.0) | Volume surge (3.6x)
════════════════════
🔴 $KORU 4-hour bullish signal
⚠️Technical indicators: ADX(46) indicates a very strong trend (beware of an overheated pullback) | MACD DIF has crossed above the zero line, signaling a bullish trend reversal | EMA5 > EMA8 > EMA13, bullish alignment | KDJ is strong, with bulls in control (K: 70.5, D: 56.4) | Volume increase (2.3x)
════════════════════
🔴 $SKUU 4-hour bullish signal
⚠️Technical indicators: ADX(34) indicates a clear trending market | MACD DIF has crossed above the zero line, signaling a bullish trend reversal | EMA5 > EMA8 > EMA13, bullish alignment | KDJ is strong, with bulls in control (K: 67.4, D: 53.5) | Volume increase (1.8x)
════════════════════
🔔 Follow for real-time market movements 🔔
#技术分析 #WDC #KORU #SKUU
📌 When trading, check whether the candlestick pattern confirms the signal
$WDC / $KORU / $SKUU 4-hour technical indicators are strengthening simultaneously—which has the greatest breakout potential?🔥
════════════════════
🔴 $WDC 4-hour bullish signal
⚠️Technical indicators: ADX(46) indicates a very strong trend (beware of an overheated pullback) | MACD is bullish, with a strong trend and increasing momentum | EMA5 > EMA8 > EMA13, bullish alignment | KDJ is strong, with bulls in control (K: 70.2, D: 55.0) | Volume surge (3.6x)
════════════════════
🔴 $KORU 4-hour bullish signal
⚠️Technical indicators: ADX(46) indicates a very strong trend (beware of an overheated pullback) | MACD DIF has crossed above the zero line, signaling a bullish trend reversal | EMA5 > EMA8 > EMA13, bullish alignment | KDJ is strong, with bulls in control (K: 70.5, D: 56.4) | Volume increase (2.3x)
════════════════════
🔴 $SKUU 4-hour bullish signal
⚠️Technical indicators: ADX(34) indicates a clear trending market | MACD DIF has crossed above the zero line, signaling a bullish trend reversal | EMA5 > EMA8 > EMA13, bullish alignment | KDJ is strong, with bulls in control (K: 67.4, D: 53.5) | Volume increase (1.8x)
════════════════════
🔔 Follow for real-time market movements 🔔
#技术分析 #WDC #KORU #SKUU
📌 When trading, check whether the candlestick pattern confirms the signal
════════════════════
🔴 $WDC 4-hour bullish signal
⚠️Technical indicators: ADX(46) indicates a very strong trend (beware of an overheated pullback) | MACD is bullish, with a strong trend and increasing momentum | EMA5 > EMA8 > EMA13, bullish alignment | KDJ is strong, with bulls in control (K: 70.2, D: 55.0) | Volume surge (3.6x)
════════════════════
🔴 $KORU 4-hour bullish signal
⚠️Technical indicators: ADX(46) indicates a very strong trend (beware of an overheated pullback) | MACD DIF has crossed above the zero line, signaling a bullish trend reversal | EMA5 > EMA8 > EMA13, bullish alignment | KDJ is strong, with bulls in control (K: 70.5, D: 56.4) | Volume increase (2.3x)
════════════════════
🔴 $SKUU 4-hour bullish signal
⚠️Technical indicators: ADX(34) indicates a clear trending market | MACD DIF has crossed above the zero line, signaling a bullish trend reversal | EMA5 > EMA8 > EMA13, bullish alignment | KDJ is strong, with bulls in control (K: 67.4, D: 53.5) | Volume increase (1.8x)
════════════════════
🔔 Follow for real-time market movements 🔔
#技术分析 #WDC #KORU #SKUU
📌 When trading, check whether the candlestick pattern confirms the signal
21
·
--
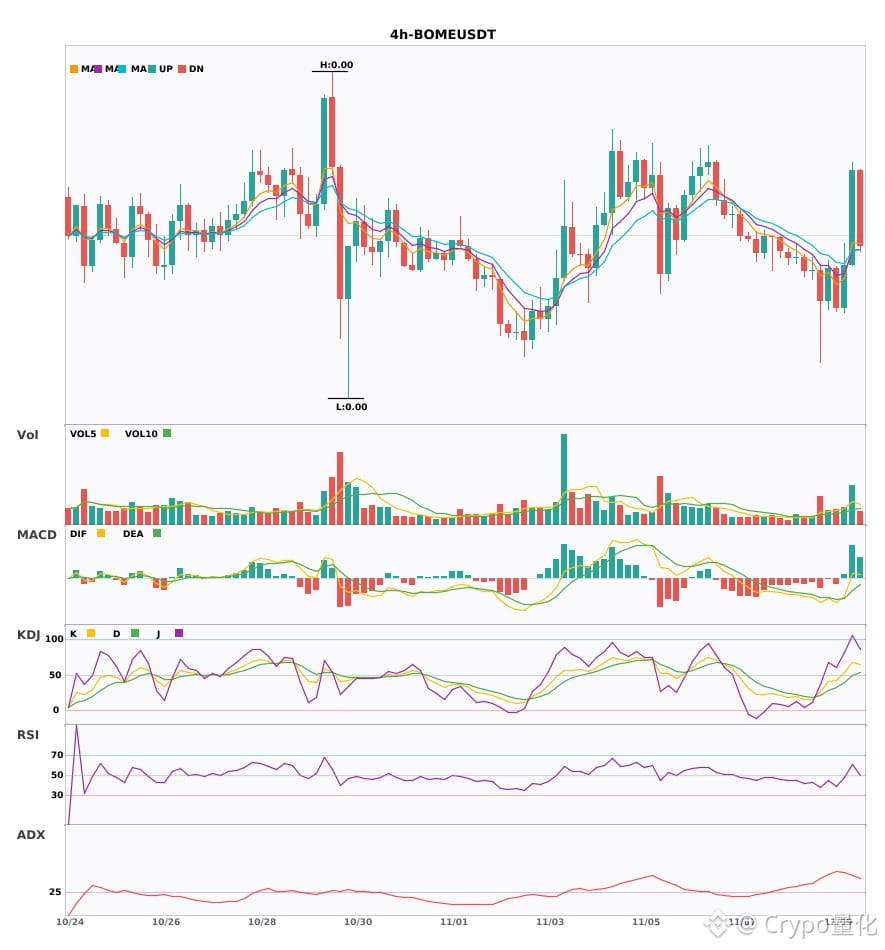
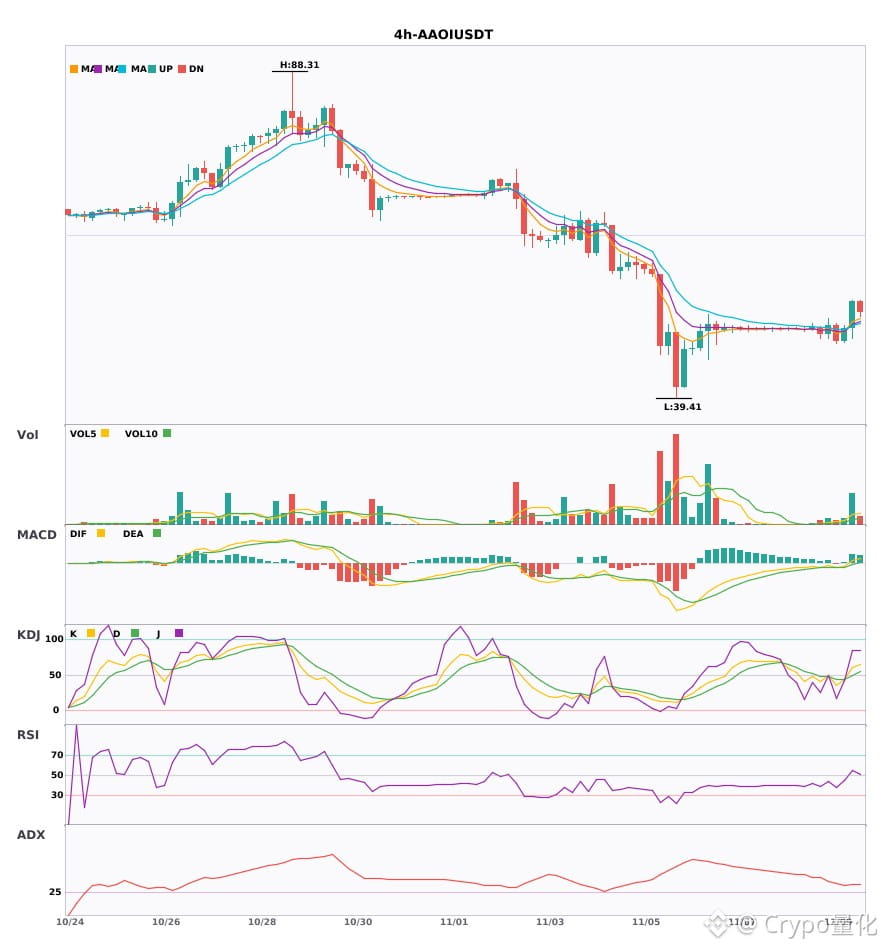
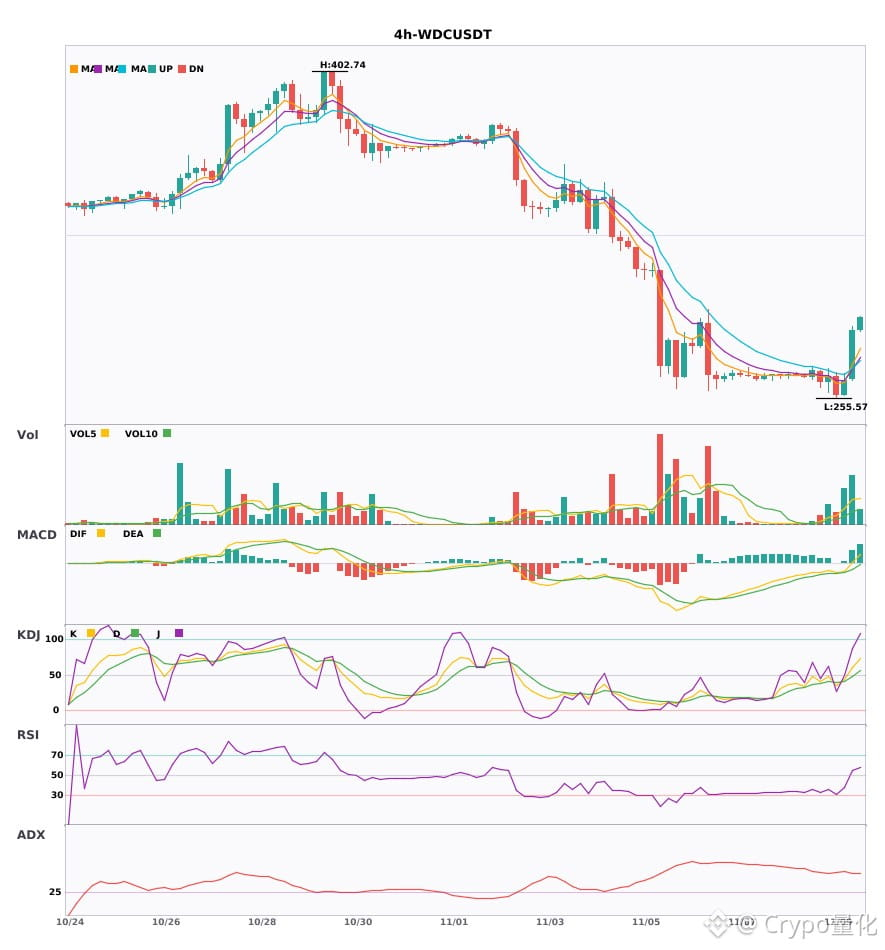
$BOME / $AAOI / $WDC 4: Bullish on the hourly timeframe, with short-term confluence opportunities 🔥
════════════════════
🔴 $BOME 4-hour bullish signal
⚠️ Technicals: ADX(49) indicates a very strong trend (beware of an overheated pullback) | MACD DIF breaks above zero, signaling a bullish trend | EMA5 crosses above EMA8, signaling short-term bullishness | Volume surge (2.6x)
════════════════════
🔴 $AAOI 4-hour bullish signal
⚠️ Technicals: ADX(30) indicates a trend is forming; an opportunity to participate | MACD DIF breaks above zero, signaling a bullish trend | EMA5 crosses above EMA8, signaling short-term bullishness | KDJ golden cross, short-term bullish (K: 61.1, D: 49.5) | Volume surge (5.6x)
════════════════════
🔴 $WDC 4 4-hour bullish signal
⚠️ Technicals: ADX(45) indicates a clear trending market | MACD DIF breaks above zero, signaling a bullish trend | EMA5 crosses above EMA8, signaling short-term bullishness | Volume surge (4.1x)
════════════════════
🔔 Follow for real-time market alerts 🔔
#技术分析 #BOME #AAOI #WDC
📌 When trading, pay attention to whether the candlestick patterns confirm the signal.
$BOME / $AAOI / $WDC 4: Bullish on the hourly timeframe, with short-term confluence opportunities 🔥
════════════════════
🔴 $BOME 4-hour bullish signal
⚠️ Technicals: ADX(49) indicates a very strong trend (beware of an overheated pullback) | MACD DIF breaks above zero, signaling a bullish trend | EMA5 crosses above EMA8, signaling short-term bullishness | Volume surge (2.6x)
════════════════════
🔴 $AAOI 4-hour bullish signal
⚠️ Technicals: ADX(30) indicates a trend is forming; an opportunity to participate | MACD DIF breaks above zero, signaling a bullish trend | EMA5 crosses above EMA8, signaling short-term bullishness | KDJ golden cross, short-term bullish (K: 61.1, D: 49.5) | Volume surge (5.6x)
════════════════════
🔴 $WDC 4 4-hour bullish signal
⚠️ Technicals: ADX(45) indicates a clear trending market | MACD DIF breaks above zero, signaling a bullish trend | EMA5 crosses above EMA8, signaling short-term bullishness | Volume surge (4.1x)
════════════════════
🔔 Follow for real-time market alerts 🔔
#技术分析 #BOME #AAOI #WDC
📌 When trading, pay attention to whether the candlestick patterns confirm the signal.
════════════════════
🔴 $BOME 4-hour bullish signal
⚠️ Technicals: ADX(49) indicates a very strong trend (beware of an overheated pullback) | MACD DIF breaks above zero, signaling a bullish trend | EMA5 crosses above EMA8, signaling short-term bullishness | Volume surge (2.6x)
════════════════════
🔴 $AAOI 4-hour bullish signal
⚠️ Technicals: ADX(30) indicates a trend is forming; an opportunity to participate | MACD DIF breaks above zero, signaling a bullish trend | EMA5 crosses above EMA8, signaling short-term bullishness | KDJ golden cross, short-term bullish (K: 61.1, D: 49.5) | Volume surge (5.6x)
════════════════════
🔴 $WDC 4 4-hour bullish signal
⚠️ Technicals: ADX(45) indicates a clear trending market | MACD DIF breaks above zero, signaling a bullish trend | EMA5 crosses above EMA8, signaling short-term bullishness | Volume surge (4.1x)
════════════════════
🔔 Follow for real-time market alerts 🔔
#技术分析 #BOME #AAOI #WDC
📌 When trading, pay attention to whether the candlestick patterns confirm the signal.
16

🚨 $WDC IS SILENTLY SETTING UP A HIGH-PROBABILITY BEARISH EXPANSION! 🔻
Entry: 460.50 - 460.92 ⚡
Target: 453.77 🎯
Stop Loss: 469.95 ⚠️
📌 The 4-hour timeframe is painting a textbook short sequence while lower timeframe indicators show bears still have plenty of runway before hitting exhaustion. 📊 With 1-hour volatility actively expanding, sellers are defending the 460.90 supply level with solid conviction.
💡 With a tight invalidation above 469.95, this setup offers an attractive risk-to-reward ratio toward the primary liquidity pool near 453.77. 🔍 As long as the entry zone holds, momentum favors the downside vector. 💬 Is $WDC preparing for a legitimate breakdown here or are sellers stepping into a daily range trap? 👇
⚠️ Not financial advice. Always manage your risk. 🛡️
🏷️ #WDC #ShortSetup #Trading #Crypto #OrderFlow
🎯 📉
🚨 $WDC IS SILENTLY SETTING UP A HIGH-PROBABILITY BEARISH EXPANSION! 🔻
Entry: 460.50 - 460.92 ⚡
Target: 453.77 🎯
Stop Loss: 469.95 ⚠️
📌 The 4-hour timeframe is painting a textbook short sequence while lower timeframe indicators show bears still have plenty of runway before hitting exhaustion. 📊 With 1-hour volatility actively expanding, sellers are defending the 460.90 supply level with solid conviction.
💡 With a tight invalidation above 469.95, this setup offers an attractive risk-to-reward ratio toward the primary liquidity pool near 453.77. 🔍 As long as the entry zone holds, momentum favors the downside vector. 💬 Is $WDC preparing for a legitimate breakdown here or are sellers stepping into a daily range trap? 👇
⚠️ Not financial advice. Always manage your risk. 🛡️
🏷️ #WDC #ShortSetup #Trading #Crypto #OrderFlow
🎯 📉
Entry: 460.50 - 460.92 ⚡
Target: 453.77 🎯
Stop Loss: 469.95 ⚠️
📌 The 4-hour timeframe is painting a textbook short sequence while lower timeframe indicators show bears still have plenty of runway before hitting exhaustion. 📊 With 1-hour volatility actively expanding, sellers are defending the 460.90 supply level with solid conviction.
💡 With a tight invalidation above 469.95, this setup offers an attractive risk-to-reward ratio toward the primary liquidity pool near 453.77. 🔍 As long as the entry zone holds, momentum favors the downside vector. 💬 Is $WDC preparing for a legitimate breakdown here or are sellers stepping into a daily range trap? 👇
⚠️ Not financial advice. Always manage your risk. 🛡️
🏷️ #WDC #ShortSetup #Trading #Crypto #OrderFlow
🎯 📉
7

·
--
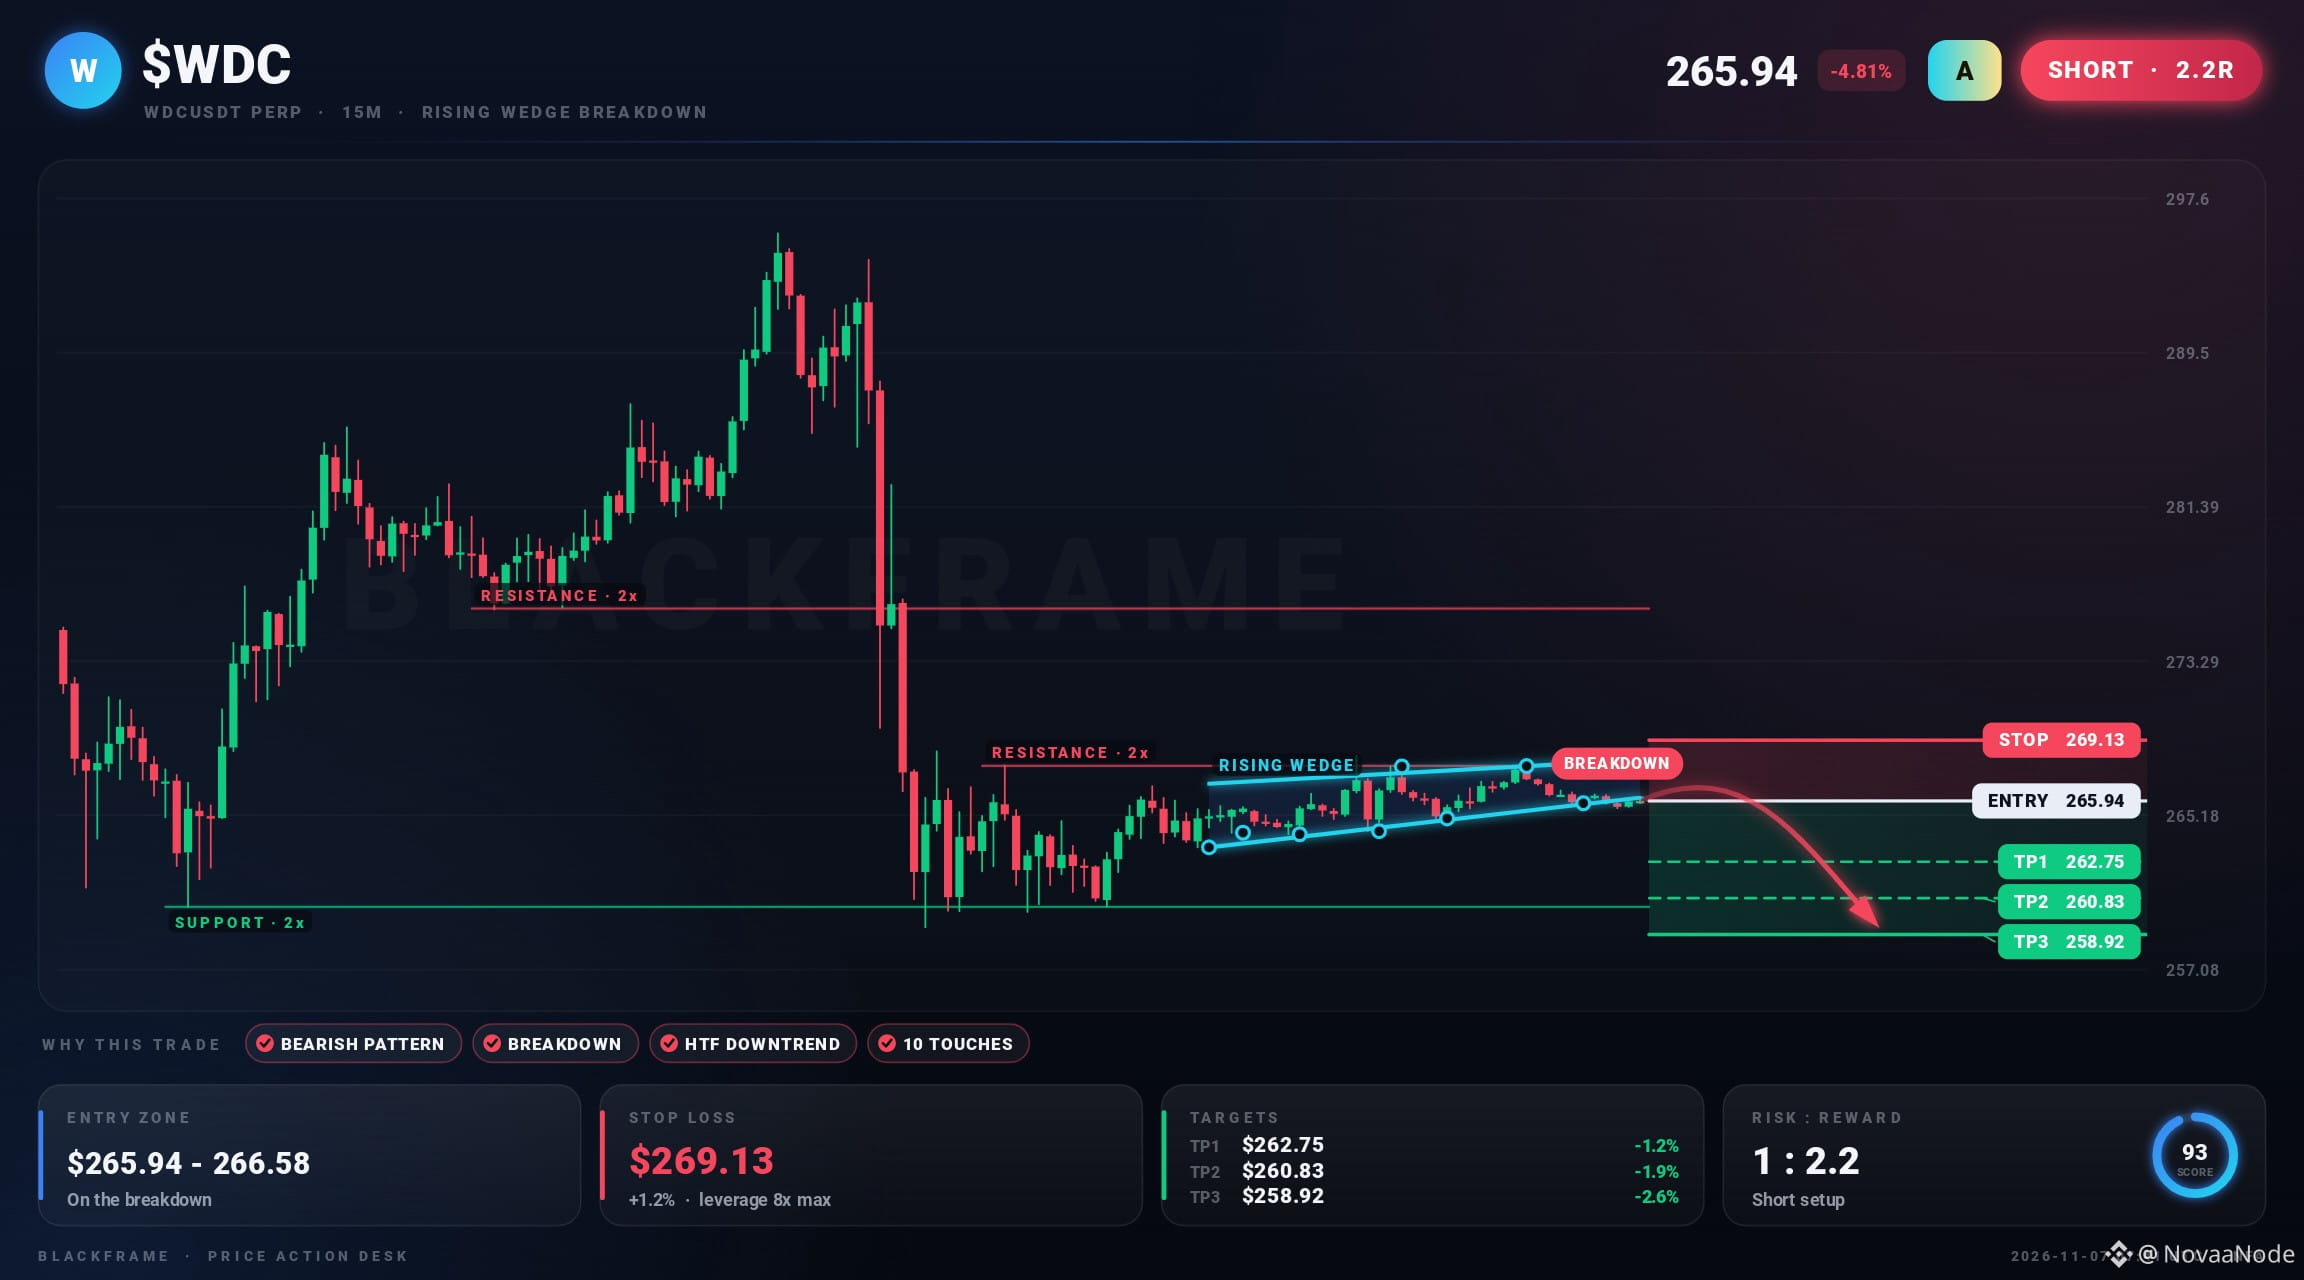
🧊 $WDC support just gave way
SHORT · 15M
Entry: $265.94 - $266.74
TP1: $262.75
TP2: $260.83
TP3: $258.92
SL: $269.13
A rising wedge has formed on the 15M, tested 10 times on its lines. Price broke down below the pattern and is holding. The higher timeframe trend agrees, and the target is the measured move of the pattern.
#WDC #Crypto #Binance · NFA
🧊 $WDC support just gave way
SHORT · 15M
Entry: $265.94 - $266.74
TP1: $262.75
TP2: $260.83
TP3: $258.92
SL: $269.13
A rising wedge has formed on the 15M, tested 10 times on its lines. Price broke down below the pattern and is holding. The higher timeframe trend agrees, and the target is the measured move of the pattern.
#WDC #Crypto #Binance · NFA
SHORT · 15M
Entry: $265.94 - $266.74
TP1: $262.75
TP2: $260.83
TP3: $258.92
SL: $269.13
A rising wedge has formed on the 15M, tested 10 times on its lines. Price broke down below the pattern and is holding. The higher timeframe trend agrees, and the target is the measured move of the pattern.
#WDC #Crypto #Binance · NFA
1

·
--
🚨 $WDC HOLDING THE DEMAND ZONE AS BUYERS PREPARE TO RECLAIM THE 470 TRIGGER! ⚡
Entry: 460 - 463 ⚡
Target: 470 / 480 / 490 🚀
Stop Loss: 452 ⚠️
📌 Smart money is quietly absorbing sell pressure right at the 455–460 demand floor following a heavy 4-hour pullback. 🔍 Green candles are creeping back into the structure, but the true momentum wave starts once bulls flip 470 back into support.
💡 If buyers clear that key resistance pivot, expect a swift expansion toward 480 and 490 as shorts get squeezed out. 🌊 Keep an eye on high-beta pairs like $TUT and $TRUMP as broad momentum starts shifting. 💬 Are you front-running this reclaim at the floor or waiting for 470 confirmation? 👇
⚠️ Not financial advice. Always manage your risk. 🛡️
🏷️ #WDC #Crypto #Breakout #TradeSetup #Altcoins
🎯 ⚡
🚨 $WDC HOLDING THE DEMAND ZONE AS BUYERS PREPARE TO RECLAIM THE 470 TRIGGER! ⚡
Entry: 460 - 463 ⚡
Target: 470 / 480 / 490 🚀
Stop Loss: 452 ⚠️
📌 Smart money is quietly absorbing sell pressure right at the 455–460 demand floor following a heavy 4-hour pullback. 🔍 Green candles are creeping back into the structure, but the true momentum wave starts once bulls flip 470 back into support.
💡 If buyers clear that key resistance pivot, expect a swift expansion toward 480 and 490 as shorts get squeezed out. 🌊 Keep an eye on high-beta pairs like $TUT and $TRUMP as broad momentum starts shifting. 💬 Are you front-running this reclaim at the floor or waiting for 470 confirmation? 👇
⚠️ Not financial advice. Always manage your risk. 🛡️
🏷️ #WDC #Crypto #Breakout #TradeSetup #Altcoins
🎯 ⚡
Entry: 460 - 463 ⚡
Target: 470 / 480 / 490 🚀
Stop Loss: 452 ⚠️
📌 Smart money is quietly absorbing sell pressure right at the 455–460 demand floor following a heavy 4-hour pullback. 🔍 Green candles are creeping back into the structure, but the true momentum wave starts once bulls flip 470 back into support.
💡 If buyers clear that key resistance pivot, expect a swift expansion toward 480 and 490 as shorts get squeezed out. 🌊 Keep an eye on high-beta pairs like $TUT and $TRUMP as broad momentum starts shifting. 💬 Are you front-running this reclaim at the floor or waiting for 470 confirmation? 👇
⚠️ Not financial advice. Always manage your risk. 🛡️
🏷️ #WDC #Crypto #Breakout #TradeSetup #Altcoins
🎯 ⚡
12
·
--
🚨 $WDC EXHAUSTS BOUNCE MOMENTUM WHILE BEARS ABSORB EVERY ATTEMPT TO RECLAIM HIGHER! 📉
Entry: 456.34 - 457.52 ⚡
Target: 449.75 - 437.80 🎯
Stop Loss: 466.50 ⚠️
While the daily structure remains locked in a range, higher timeframe momentum on the 4H chart is pressing down relentlessly. 📊 The short-term RSI cooling down to 33 confirms buyers lack the firepower to sustain any meaningful bounce attempt.
📌 The path of least resistance points straight toward lower liquidity zones while sellers maintain complete control at the 456.93 pivot. 🔍 With immediate downside momentum building, this high-conviction setup favors riding the prevailing trend rather than fighting seller control. 🤔 When price taps that first target at 449.75, do you secure profits or let the position run toward lower support levels? 👇
⚠️ Not financial advice. Always manage your risk. 🛡️
🏷️ #WDC #ShortSetup #CryptoTrading #Bearish #Breakdown
📉 🐻
🚨 $WDC EXHAUSTS BOUNCE MOMENTUM WHILE BEARS ABSORB EVERY ATTEMPT TO RECLAIM HIGHER! 📉
Entry: 456.34 - 457.52 ⚡
Target: 449.75 - 437.80 🎯
Stop Loss: 466.50 ⚠️
While the daily structure remains locked in a range, higher timeframe momentum on the 4H chart is pressing down relentlessly. 📊 The short-term RSI cooling down to 33 confirms buyers lack the firepower to sustain any meaningful bounce attempt.
📌 The path of least resistance points straight toward lower liquidity zones while sellers maintain complete control at the 456.93 pivot. 🔍 With immediate downside momentum building, this high-conviction setup favors riding the prevailing trend rather than fighting seller control. 🤔 When price taps that first target at 449.75, do you secure profits or let the position run toward lower support levels? 👇
⚠️ Not financial advice. Always manage your risk. 🛡️
🏷️ #WDC #ShortSetup #CryptoTrading #Bearish #Breakdown
📉 🐻
Entry: 456.34 - 457.52 ⚡
Target: 449.75 - 437.80 🎯
Stop Loss: 466.50 ⚠️
While the daily structure remains locked in a range, higher timeframe momentum on the 4H chart is pressing down relentlessly. 📊 The short-term RSI cooling down to 33 confirms buyers lack the firepower to sustain any meaningful bounce attempt.
📌 The path of least resistance points straight toward lower liquidity zones while sellers maintain complete control at the 456.93 pivot. 🔍 With immediate downside momentum building, this high-conviction setup favors riding the prevailing trend rather than fighting seller control. 🤔 When price taps that first target at 449.75, do you secure profits or let the position run toward lower support levels? 👇
⚠️ Not financial advice. Always manage your risk. 🛡️
🏷️ #WDC #ShortSetup #CryptoTrading #Bearish #Breakdown
📉 🐻
27

·
--
🔻 $WDC SHORT 🔻
Entry: 259.36 – 260.92
SL: 271.22
TP1: 250.64
TP2: 244.31
TP3: 236.39
📈 Technical Outlook:
$WDC is showing bearish pressure after losing strength near a key technical zone. The setup is supported by EMA trend is bearish, price is breaking below recent support, RSI supports bearish momentum. As long as price stays below the entry area, sellers may continue pushing toward the listed downside targets.
#WDC #Crypto #BinanceSquare #Trading
🔻 $WDC SHORT 🔻
Entry: 259.36 – 260.92
SL: 271.22
TP1: 250.64
TP2: 244.31
TP3: 236.39
📈 Technical Outlook:
$WDC is showing bearish pressure after losing strength near a key technical zone. The setup is supported by EMA trend is bearish, price is breaking below recent support, RSI supports bearish momentum. As long as price stays below the entry area, sellers may continue pushing toward the listed downside targets.
#WDC #Crypto #BinanceSquare #Trading
Entry: 259.36 – 260.92
SL: 271.22
TP1: 250.64
TP2: 244.31
TP3: 236.39
📈 Technical Outlook:
$WDC is showing bearish pressure after losing strength near a key technical zone. The setup is supported by EMA trend is bearish, price is breaking below recent support, RSI supports bearish momentum. As long as price stays below the entry area, sellers may continue pushing toward the listed downside targets.
#WDC #Crypto #BinanceSquare #Trading

6

$WDC RSI TRAP IS BAITING RETAIL WHILE THE 4H TREND SCRAPES SUPPORT 📉 💣
Entry: 449.27 - 450.51 🔻
Target: 427.60 🎯
Stop Loss: 461.04 ⚠️
Amateurs are staring at the 15-minute RSI calling for a bounce, but higher timeframe order flow tells a brutal story. 📊 $WDC is grinding right against support around 449.89 while volatility compresses for an explosive continuation downward.
When intraday momentum aligns with a macro downtrend regime, oversold readings are merely fuel for the next leg lower. ⚡ Smart money isn't buying this fake stability—they are positioning for a swift liquidity sweep toward lower targets. 💬 Are you shorting this structural breakdown or caught buying the oversold reflex bounce? 👇
⚠️ Not financial advice. Always manage your risk. 🛡️
🏷️ #WDC #ShortSetup #Bearish #Trading #Crypto
📉 🩸
$WDC RSI TRAP IS BAITING RETAIL WHILE THE 4H TREND SCRAPES SUPPORT 📉 💣
Entry: 449.27 - 450.51 🔻
Target: 427.60 🎯
Stop Loss: 461.04 ⚠️
Amateurs are staring at the 15-minute RSI calling for a bounce, but higher timeframe order flow tells a brutal story. 📊 $WDC is grinding right against support around 449.89 while volatility compresses for an explosive continuation downward.
When intraday momentum aligns with a macro downtrend regime, oversold readings are merely fuel for the next leg lower. ⚡ Smart money isn't buying this fake stability—they are positioning for a swift liquidity sweep toward lower targets. 💬 Are you shorting this structural breakdown or caught buying the oversold reflex bounce? 👇
⚠️ Not financial advice. Always manage your risk. 🛡️
🏷️ #WDC #ShortSetup #Bearish #Trading #Crypto
📉 🩸
Entry: 449.27 - 450.51 🔻
Target: 427.60 🎯
Stop Loss: 461.04 ⚠️
Amateurs are staring at the 15-minute RSI calling for a bounce, but higher timeframe order flow tells a brutal story. 📊 $WDC is grinding right against support around 449.89 while volatility compresses for an explosive continuation downward.
When intraday momentum aligns with a macro downtrend regime, oversold readings are merely fuel for the next leg lower. ⚡ Smart money isn't buying this fake stability—they are positioning for a swift liquidity sweep toward lower targets. 💬 Are you shorting this structural breakdown or caught buying the oversold reflex bounce? 👇
⚠️ Not financial advice. Always manage your risk. 🛡️
🏷️ #WDC #ShortSetup #Bearish #Trading #Crypto
📉 🩸
7
🚨 $WDC 4H TIMEFRAME FLIPS BEARISH AS SELLER MOMENTUM TAKES TOTAL CONTROL! 📉
Entry: 449.03 - 450.24 ⚡
Target: 441.21 🚀
Stop Loss: 460.86 ⚠️
While the daily chart hangs in a range, the 4H timeframe just established a decisive short trend with high-conviction order flow. 📊 Sellers are aggressively driving early momentum with 15m RSI sinking toward 36.2, leaving counter-trend buyers completely exhausted.
💡 Volatility room allows price to ride downward without immediate squeeze risk while bears defend the upper supply boundary. 📌 Risk remains tightly controlled against structural resistance as downside targets open up cleanly toward 435.60. 💬 Do you expect an instant breakdown into TP2 or a brief fakeout first? 👇
⚠️ Not financial advice. Always manage your risk. 🛡️
🏷️ #WDC #ShortSetup #CryptoTrading #Bearish
📉 🐻
🚨 $WDC 4H TIMEFRAME FLIPS BEARISH AS SELLER MOMENTUM TAKES TOTAL CONTROL! 📉
Entry: 449.03 - 450.24 ⚡
Target: 441.21 🚀
Stop Loss: 460.86 ⚠️
While the daily chart hangs in a range, the 4H timeframe just established a decisive short trend with high-conviction order flow. 📊 Sellers are aggressively driving early momentum with 15m RSI sinking toward 36.2, leaving counter-trend buyers completely exhausted.
💡 Volatility room allows price to ride downward without immediate squeeze risk while bears defend the upper supply boundary. 📌 Risk remains tightly controlled against structural resistance as downside targets open up cleanly toward 435.60. 💬 Do you expect an instant breakdown into TP2 or a brief fakeout first? 👇
⚠️ Not financial advice. Always manage your risk. 🛡️
🏷️ #WDC #ShortSetup #CryptoTrading #Bearish
📉 🐻
Entry: 449.03 - 450.24 ⚡
Target: 441.21 🚀
Stop Loss: 460.86 ⚠️
While the daily chart hangs in a range, the 4H timeframe just established a decisive short trend with high-conviction order flow. 📊 Sellers are aggressively driving early momentum with 15m RSI sinking toward 36.2, leaving counter-trend buyers completely exhausted.
💡 Volatility room allows price to ride downward without immediate squeeze risk while bears defend the upper supply boundary. 📌 Risk remains tightly controlled against structural resistance as downside targets open up cleanly toward 435.60. 💬 Do you expect an instant breakdown into TP2 or a brief fakeout first? 👇
⚠️ Not financial advice. Always manage your risk. 🛡️
🏷️ #WDC #ShortSetup #CryptoTrading #Bearish
📉 🐻
9

·
--
THE 4-HOUR TIMEFRAME JUST FLIPPED ON $WDC AND SINKING MOMENTUM IS TAKING OVER! 📉 🔻
Entry: 441.22 - 442.96 ⚡
Target: 427.45 🚀
Stop Loss: 461.60 ⚠️
While retail keeps fixating on the daily range, lower timeframe order flow on $WDC tells a completely different story. The 4-hour structure has formally broken down, with lower-timeframe indicators rolling over as sellers aggressively step in. 📊
Volatility is expanding rapidly, clearing a smooth runway down toward our primary liquidity zone at 427.45. Positioned strictly with the structural momentum, this setup targets the path of least resistance as bid depth thins out below reference levels. 🌊
Are we slicing straight through to sweep the 427.45 lows, or will range buyers attempt a defensive stand here? 👇
⚠️ Not financial advice. Always manage your risk. 🛡️
🏷️ #WDC #ShortSetup #Bearish #Crypto
🔻 🐻
THE 4-HOUR TIMEFRAME JUST FLIPPED ON $WDC AND SINKING MOMENTUM IS TAKING OVER! 📉 🔻
Entry: 441.22 - 442.96 ⚡
Target: 427.45 🚀
Stop Loss: 461.60 ⚠️
While retail keeps fixating on the daily range, lower timeframe order flow on $WDC tells a completely different story. The 4-hour structure has formally broken down, with lower-timeframe indicators rolling over as sellers aggressively step in. 📊
Volatility is expanding rapidly, clearing a smooth runway down toward our primary liquidity zone at 427.45. Positioned strictly with the structural momentum, this setup targets the path of least resistance as bid depth thins out below reference levels. 🌊
Are we slicing straight through to sweep the 427.45 lows, or will range buyers attempt a defensive stand here? 👇
⚠️ Not financial advice. Always manage your risk. 🛡️
🏷️ #WDC #ShortSetup #Bearish #Crypto
🔻 🐻
Entry: 441.22 - 442.96 ⚡
Target: 427.45 🚀
Stop Loss: 461.60 ⚠️
While retail keeps fixating on the daily range, lower timeframe order flow on $WDC tells a completely different story. The 4-hour structure has formally broken down, with lower-timeframe indicators rolling over as sellers aggressively step in. 📊
Volatility is expanding rapidly, clearing a smooth runway down toward our primary liquidity zone at 427.45. Positioned strictly with the structural momentum, this setup targets the path of least resistance as bid depth thins out below reference levels. 🌊
Are we slicing straight through to sweep the 427.45 lows, or will range buyers attempt a defensive stand here? 👇
⚠️ Not financial advice. Always manage your risk. 🛡️
🏷️ #WDC #ShortSetup #Bearish #Crypto
🔻 🐻
3
·
--
$WDC 4H STRUCTURE COLLAPSES AS SELLER PRESSURE ACCELERATES TOWARD LOWER DEMAND! 🚨 📉
Entry: 438.56 - 440.68 🔻
Target: 427.45 - 417.69 - 403.06 🎯
Stop Loss: 461.60 ⚠️
The 4-hour timeframe just suffered a decisive structural break, leaving buyers stranded as momentum indicators plunge into deep bearish territory. 📊 Sellers are aggressively absorbing remaining bids, opening a clean runway toward lower liquidity pockets.
Order flow signals heavy distribution, with bears comfortably maintaining control below local supply. 💡 As long as key resistance holds, the path of least resistance points sharply downward into secondary support levels. 💬 Are you riding this downward expansion or waiting for support to form? 👇
⚠️ Not financial advice. Always manage your risk. 🛡️
🏷️ #WDC #ShortSetup #Crypto #Trading #Bearish
📉 🐻
$WDC 4H STRUCTURE COLLAPSES AS SELLER PRESSURE ACCELERATES TOWARD LOWER DEMAND! 🚨 📉
Entry: 438.56 - 440.68 🔻
Target: 427.45 - 417.69 - 403.06 🎯
Stop Loss: 461.60 ⚠️
The 4-hour timeframe just suffered a decisive structural break, leaving buyers stranded as momentum indicators plunge into deep bearish territory. 📊 Sellers are aggressively absorbing remaining bids, opening a clean runway toward lower liquidity pockets.
Order flow signals heavy distribution, with bears comfortably maintaining control below local supply. 💡 As long as key resistance holds, the path of least resistance points sharply downward into secondary support levels. 💬 Are you riding this downward expansion or waiting for support to form? 👇
⚠️ Not financial advice. Always manage your risk. 🛡️
🏷️ #WDC #ShortSetup #Crypto #Trading #Bearish
📉 🐻
Entry: 438.56 - 440.68 🔻
Target: 427.45 - 417.69 - 403.06 🎯
Stop Loss: 461.60 ⚠️
The 4-hour timeframe just suffered a decisive structural break, leaving buyers stranded as momentum indicators plunge into deep bearish territory. 📊 Sellers are aggressively absorbing remaining bids, opening a clean runway toward lower liquidity pockets.
Order flow signals heavy distribution, with bears comfortably maintaining control below local supply. 💡 As long as key resistance holds, the path of least resistance points sharply downward into secondary support levels. 💬 Are you riding this downward expansion or waiting for support to form? 👇
⚠️ Not financial advice. Always manage your risk. 🛡️
🏷️ #WDC #ShortSetup #Crypto #Trading #Bearish
📉 🐻
18
·
--
⚠️ Breakdown on $WDC
SHORT · 1H
Entry: $309.73 - $311.37
TP1: $303.18
TP2: $299.25
TP3: $295.32
SL: $316.28
Price broke below a trendline near $308.57 and is holding it. The higher timeframe trend agrees.
#WDC #CryptoTrading #PriceAction · NFA
⚠️ Breakdown on $WDC
SHORT · 1H
Entry: $309.73 - $311.37
TP1: $303.18
TP2: $299.25
TP3: $295.32
SL: $316.28
Price broke below a trendline near $308.57 and is holding it. The higher timeframe trend agrees.
#WDC #CryptoTrading #PriceAction · NFA
SHORT · 1H
Entry: $309.73 - $311.37
TP1: $303.18
TP2: $299.25
TP3: $295.32
SL: $316.28
Price broke below a trendline near $308.57 and is holding it. The higher timeframe trend agrees.
#WDC #CryptoTrading #PriceAction · NFA
2
·
--
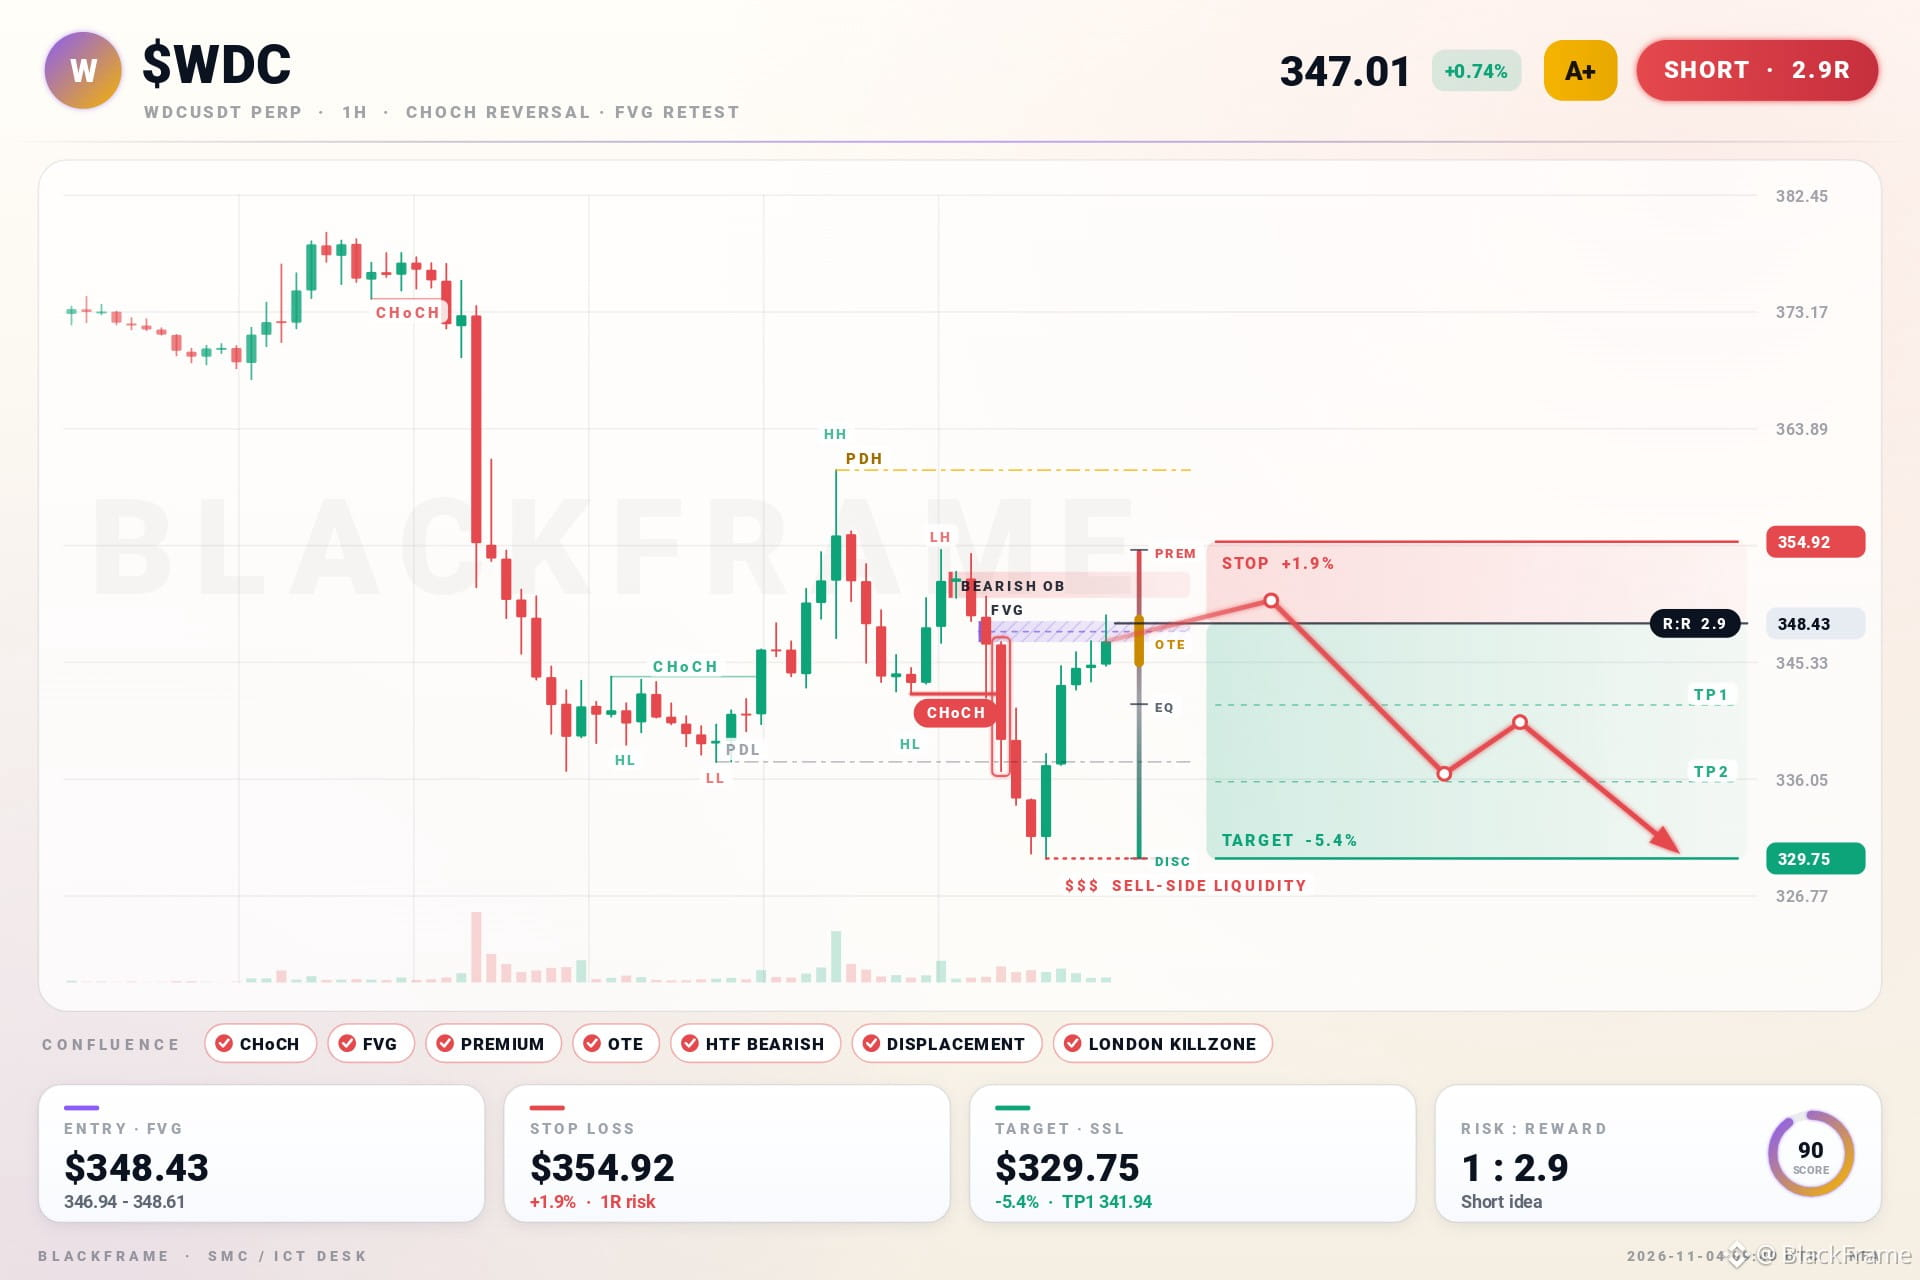
🔻 $WDC SHORT 🔻
Entry: 337.89 – 339.93
SL: 347.57
TP1: 331.49
TP2: 326.54
TP3: 320.36
📈 Technical Outlook:
$WDC is showing bearish pressure after losing strength near a key technical zone. The setup is supported by EMA trend is bearish, RSI supports bearish momentum, volume confirms stronger pressure. As long as price stays below the entry area, sellers may continue pushing toward the listed downside targets.
#WDC #Crypto #BinanceSquare #Trading
🔻 $WDC SHORT 🔻
Entry: 337.89 – 339.93
SL: 347.57
TP1: 331.49
TP2: 326.54
TP3: 320.36
📈 Technical Outlook:
$WDC is showing bearish pressure after losing strength near a key technical zone. The setup is supported by EMA trend is bearish, RSI supports bearish momentum, volume confirms stronger pressure. As long as price stays below the entry area, sellers may continue pushing toward the listed downside targets.
#WDC #Crypto #BinanceSquare #Trading
Entry: 337.89 – 339.93
SL: 347.57
TP1: 331.49
TP2: 326.54
TP3: 320.36
📈 Technical Outlook:
$WDC is showing bearish pressure after losing strength near a key technical zone. The setup is supported by EMA trend is bearish, RSI supports bearish momentum, volume confirms stronger pressure. As long as price stays below the entry area, sellers may continue pushing toward the listed downside targets.
#WDC #Crypto #BinanceSquare #Trading

7

·
--
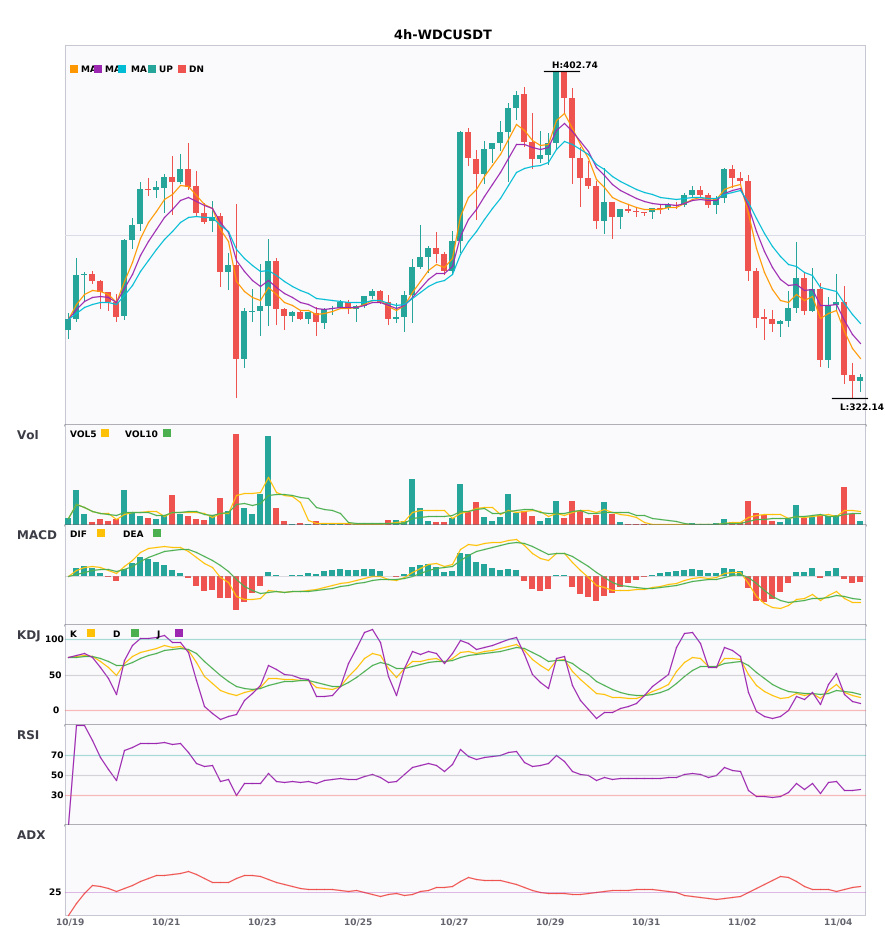
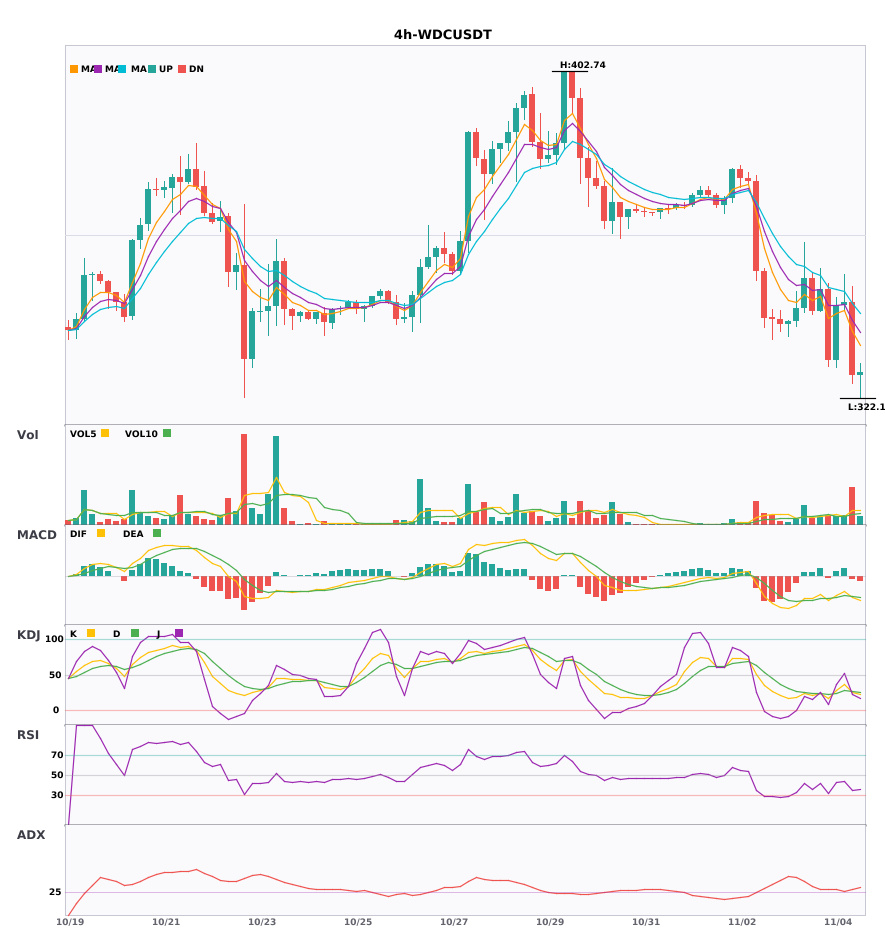
$WDC 4-hour confluence: daily bearish trend. Bearish warning—please be aware of the risks 🔥
════════════════════
🟢 $WDC 4-hour bearish signal
⚠️ Technical analysis: Daily bearish confluence confirmed | 4-hour entry: MACD death cross below zero, bearish momentum accelerating | EMA5 < EMA8 < EMA13, bearish alignment | KDJ death cross, short-term bearish (K: 26.1, D: 27.5) | Volume surge (3.4x)
════════════════════
🔔 Follow for first-hand market updates 🔔
#多周期共振 #WDC
📌 When trading, check whether the candlestick pattern aligns
$WDC 4-hour confluence: daily bearish trend. Bearish warning—please be aware of the risks 🔥
════════════════════
🟢 $WDC 4-hour bearish signal
⚠️ Technical analysis: Daily bearish confluence confirmed | 4-hour entry: MACD death cross below zero, bearish momentum accelerating | EMA5 < EMA8 < EMA13, bearish alignment | KDJ death cross, short-term bearish (K: 26.1, D: 27.5) | Volume surge (3.4x)
════════════════════
🔔 Follow for first-hand market updates 🔔
#多周期共振 #WDC
📌 When trading, check whether the candlestick pattern aligns
════════════════════
🟢 $WDC 4-hour bearish signal
⚠️ Technical analysis: Daily bearish confluence confirmed | 4-hour entry: MACD death cross below zero, bearish momentum accelerating | EMA5 < EMA8 < EMA13, bearish alignment | KDJ death cross, short-term bearish (K: 26.1, D: 27.5) | Volume surge (3.4x)
════════════════════
🔔 Follow for first-hand market updates 🔔
#多周期共振 #WDC
📌 When trading, check whether the candlestick pattern aligns
8
·
--
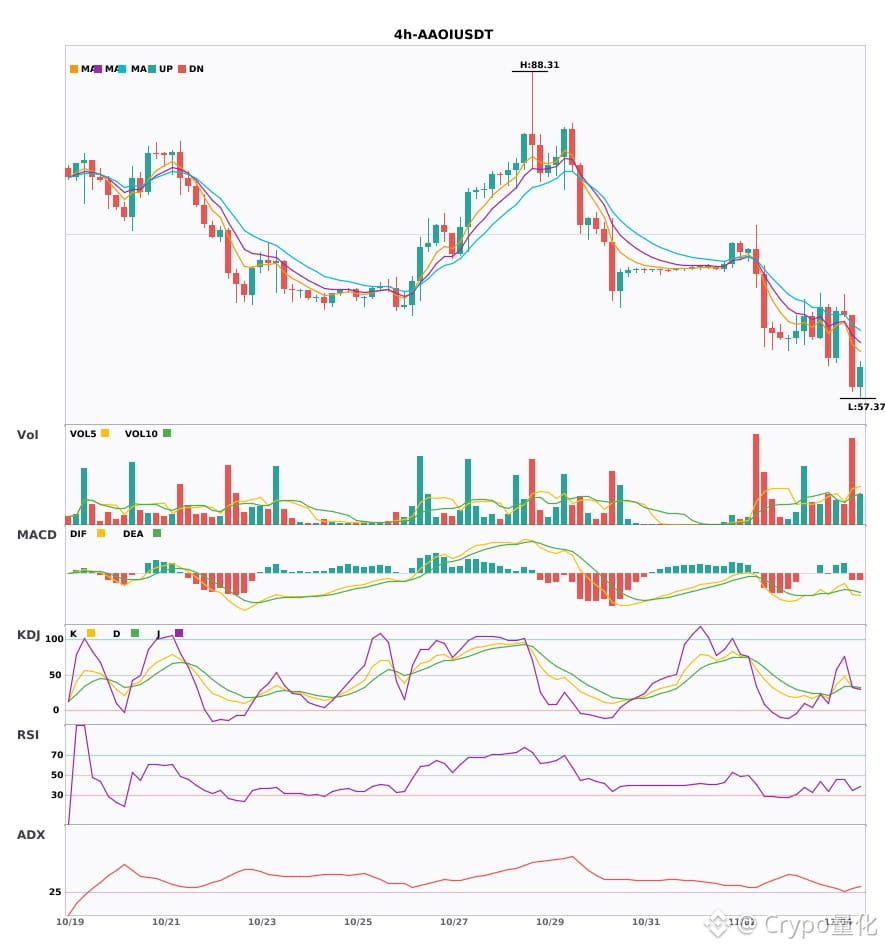
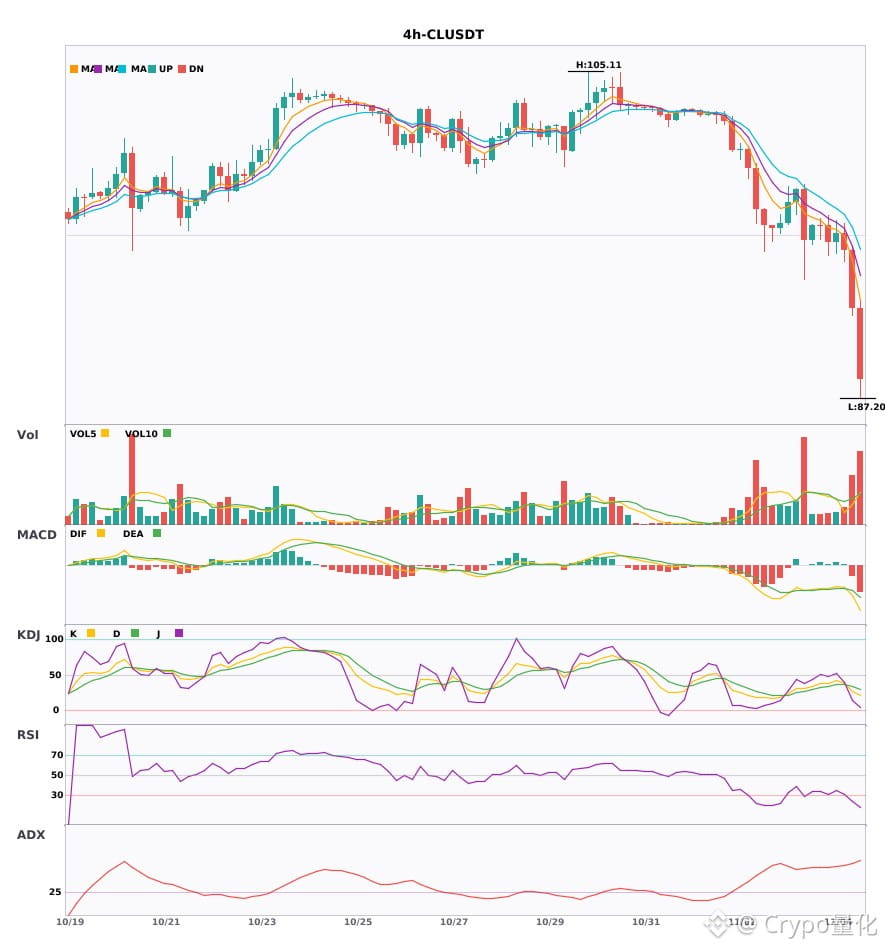
$AAOI / $CL / $WDC 4-hour chart bearish, under short-term pressure 🔥
════════════════════
🟢 $AAOI 4-hour bearish signal
⚠️Technical analysis: ADX(29) Trend is forming; tradeable | MACD bearish crossover below zero, bearish momentum accelerating | EMA5 < EMA8 < EMA13, bearish alignment | KDJ bearish crossover, bearish short-term outlook (K: 32.8, D: 33.3) | Volume surge (3.0x)
════════════════════
🟢 $CL 4-hour bearish signal
⚠️Technical analysis: ADX(59) Very strong trend (beware of an overheated pullback) | MACD bearish crossover below zero, bearish momentum accelerating | EMA5 < EMA8 < EMA13, bearish alignment | KDJ bearish crossover, bearish short-term outlook (K: 27.3, D: 34.0) | Increased volume (1.9x)
════════════════════
🟢 $WDC 4-hour bearish signal
⚠️Technical analysis: ADX(29) Trend is forming; tradeable | MACD bearish crossover below zero, bearish momentum accelerating | EMA5 < EMA8 < EMA13, bearish alignment | KDJ bearish crossover, bearish short-term outlook (K: 26.1, D: 27.5) | Volume surge (3.4x)
════════════════════
🔔 Follow for real-time market updates 🔔
#技术分析 #AAOI #CL #WDC
📌 When trading, watch for whether the candlestick patterns confirm the signal
$AAOI / $CL / $WDC 4-hour chart bearish, under short-term pressure 🔥
════════════════════
🟢 $AAOI 4-hour bearish signal
⚠️Technical analysis: ADX(29) Trend is forming; tradeable | MACD bearish crossover below zero, bearish momentum accelerating | EMA5 < EMA8 < EMA13, bearish alignment | KDJ bearish crossover, bearish short-term outlook (K: 32.8, D: 33.3) | Volume surge (3.0x)
════════════════════
🟢 $CL 4-hour bearish signal
⚠️Technical analysis: ADX(59) Very strong trend (beware of an overheated pullback) | MACD bearish crossover below zero, bearish momentum accelerating | EMA5 < EMA8 < EMA13, bearish alignment | KDJ bearish crossover, bearish short-term outlook (K: 27.3, D: 34.0) | Increased volume (1.9x)
════════════════════
🟢 $WDC 4-hour bearish signal
⚠️Technical analysis: ADX(29) Trend is forming; tradeable | MACD bearish crossover below zero, bearish momentum accelerating | EMA5 < EMA8 < EMA13, bearish alignment | KDJ bearish crossover, bearish short-term outlook (K: 26.1, D: 27.5) | Volume surge (3.4x)
════════════════════
🔔 Follow for real-time market updates 🔔
#技术分析 #AAOI #CL #WDC
📌 When trading, watch for whether the candlestick patterns confirm the signal
════════════════════
🟢 $AAOI 4-hour bearish signal
⚠️Technical analysis: ADX(29) Trend is forming; tradeable | MACD bearish crossover below zero, bearish momentum accelerating | EMA5 < EMA8 < EMA13, bearish alignment | KDJ bearish crossover, bearish short-term outlook (K: 32.8, D: 33.3) | Volume surge (3.0x)
════════════════════
🟢 $CL 4-hour bearish signal
⚠️Technical analysis: ADX(59) Very strong trend (beware of an overheated pullback) | MACD bearish crossover below zero, bearish momentum accelerating | EMA5 < EMA8 < EMA13, bearish alignment | KDJ bearish crossover, bearish short-term outlook (K: 27.3, D: 34.0) | Increased volume (1.9x)
════════════════════
🟢 $WDC 4-hour bearish signal
⚠️Technical analysis: ADX(29) Trend is forming; tradeable | MACD bearish crossover below zero, bearish momentum accelerating | EMA5 < EMA8 < EMA13, bearish alignment | KDJ bearish crossover, bearish short-term outlook (K: 26.1, D: 27.5) | Volume surge (3.4x)
════════════════════
🔔 Follow for real-time market updates 🔔
#技术分析 #AAOI #CL #WDC
📌 When trading, watch for whether the candlestick patterns confirm the signal
8
Log in to explore more content
Join global crypto users on Binance Square
⚡️ Get latest and useful information about crypto.
💬 Trusted by the world’s largest crypto exchange.
👍 Discover real insights from verified creators.
Email / Phone number
Trending Topics
1
#WhatWillDriveCryptoandStocks’NextRebound?
5,544 views
150 Discussing
2
#Anthropic’s6xIPODemandSignalsPotentialRecordRaise
1,729 views
70 Discussing
3
#HuangExitNvidiaStrategyInFocus
138,757 views
1,372 Discussing
4
#AnthropicRejectsIPODelayValuationinQuestion
753,816 views
5,547 Discussing
5
#HedgeFundsCMEBitcoinNetShortsFall89%
7,675 views
128 Discussing
6
#BitMineReports$6.3BNetLossForFiscal2026
19,033 views
157 Discussing
7
#TradFiForBeginners
548,228 views
3,829 Discussing
8
#SoFiExpandsSoFiUSDStablecoinToPolygon
5,598 views
92 Discussing
9
#TetherGoldXAUTCompletesKPMGAudit
7,888 views
102 Discussing
10
#ChipStocksExtendLossesAfterNvidiaCEOChange
52,121 views
531 Discussing