
#vib
vib
1.2M views
1,135 Discussing
Hot
Latest

Everyone sees a -63% day and thinks the bottom is in. The chart says the knife hasn’t landed yet.
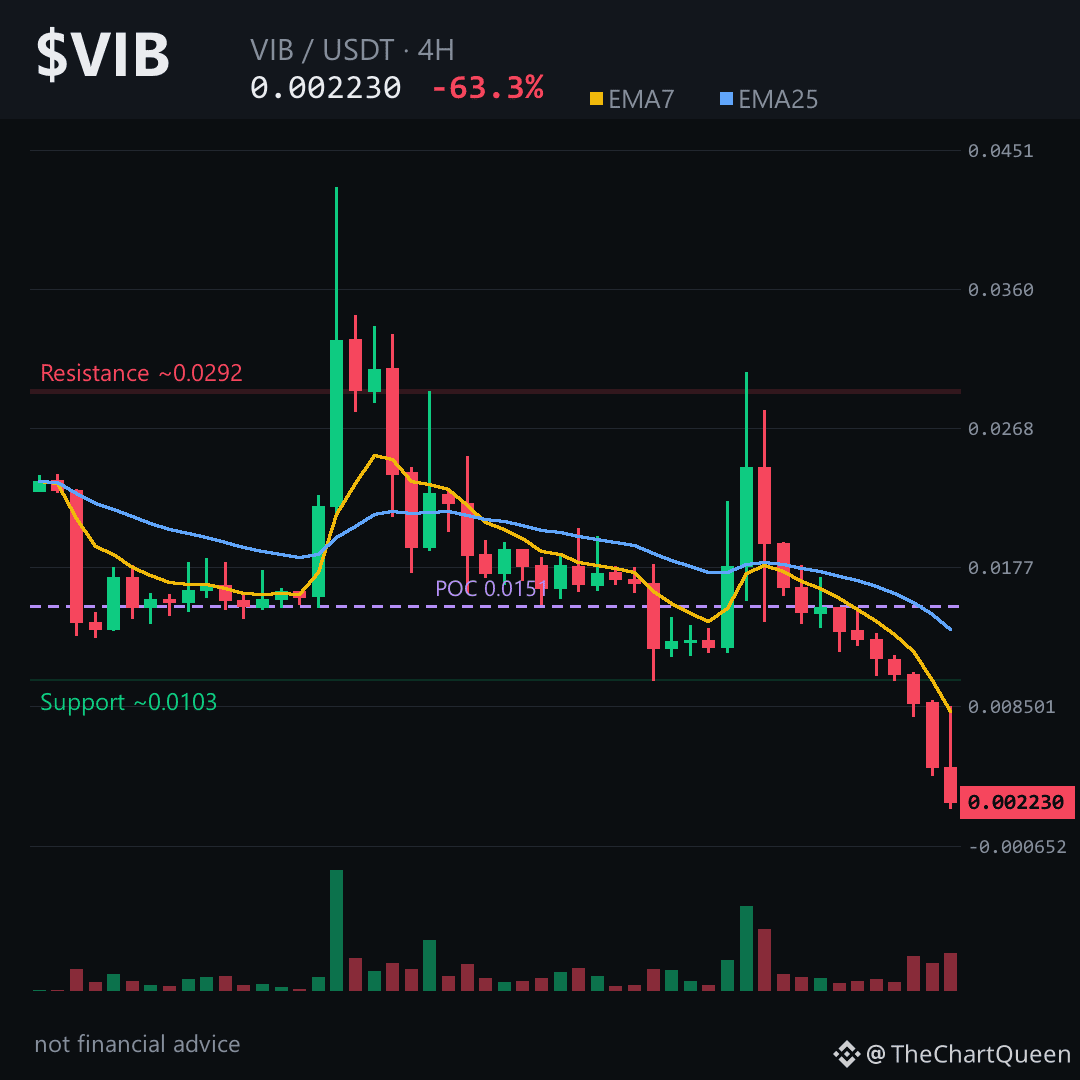
Look closer at the 4H: price just closed a monster bearish candle down 50% in one go, slicing straight through an unfilled gap around 0.0089–0.0102. That gap is now a ceiling, not a floor. RSI is buried near 28 — oversold, yes, but in a freefall like this, oversold can stay oversold for candles on end.
The levels that matter on $VIB are brutally simple. The invalidation sits around 0.00235 — until price reclaims that zone on a 4H close, every bounce is a lower high, not a reversal. The objective below is the 0.00204 area, but honestly, after a 288% daily range, the next real shelf may be closer to the macro objective near 0.0014. That’s where the weekly chart stops looking like a cliff.
My read: this is a falling knife with no volume conviction behind any bounce yet. The real risk isn’t missing the bottom — it’s catching a bounce that never comes.
I’ll update this read if $VIB starts printing higher lows instead of lower highs — follow so you see that shift before it becomes obvious.
Which level are you watching closer: the 0.00235 reclaim or the 0.0014 macro shelf? $VIB 👇
⚠️ Not financial advice. DYOR.
#VIB #Crypto #BinanceSquare
Everyone sees a -63% day and thinks the bottom is in. The chart says the knife hasn’t landed yet.
Look closer at the 4H: price just closed a monster bearish candle down 50% in one go, slicing straight through an unfilled gap around 0.0089–0.0102. That gap is now a ceiling, not a floor. RSI is buried near 28 — oversold, yes, but in a freefall like this, oversold can stay oversold for candles on end.
The levels that matter on $VIB are brutally simple. The invalidation sits around 0.00235 — until price reclaims that zone on a 4H close, every bounce is a lower high, not a reversal. The objective below is the 0.00204 area, but honestly, after a 288% daily range, the next real shelf may be closer to the macro objective near 0.0014. That’s where the weekly chart stops looking like a cliff.
My read: this is a falling knife with no volume conviction behind any bounce yet. The real risk isn’t missing the bottom — it’s catching a bounce that never comes.
I’ll update this read if $VIB starts printing higher lows instead of lower highs — follow so you see that shift before it becomes obvious.
Which level are you watching closer: the 0.00235 reclaim or the 0.0014 macro shelf? $VIB 👇
⚠️ Not financial advice. DYOR.
#VIB #Crypto #BinanceSquare
Look closer at the 4H: price just closed a monster bearish candle down 50% in one go, slicing straight through an unfilled gap around 0.0089–0.0102. That gap is now a ceiling, not a floor. RSI is buried near 28 — oversold, yes, but in a freefall like this, oversold can stay oversold for candles on end.
The levels that matter on $VIB are brutally simple. The invalidation sits around 0.00235 — until price reclaims that zone on a 4H close, every bounce is a lower high, not a reversal. The objective below is the 0.00204 area, but honestly, after a 288% daily range, the next real shelf may be closer to the macro objective near 0.0014. That’s where the weekly chart stops looking like a cliff.
My read: this is a falling knife with no volume conviction behind any bounce yet. The real risk isn’t missing the bottom — it’s catching a bounce that never comes.
I’ll update this read if $VIB starts printing higher lows instead of lower highs — follow so you see that shift before it becomes obvious.
Which level are you watching closer: the 0.00235 reclaim or the 0.0014 macro shelf? $VIB 👇
⚠️ Not financial advice. DYOR.
#VIB #Crypto #BinanceSquare
20
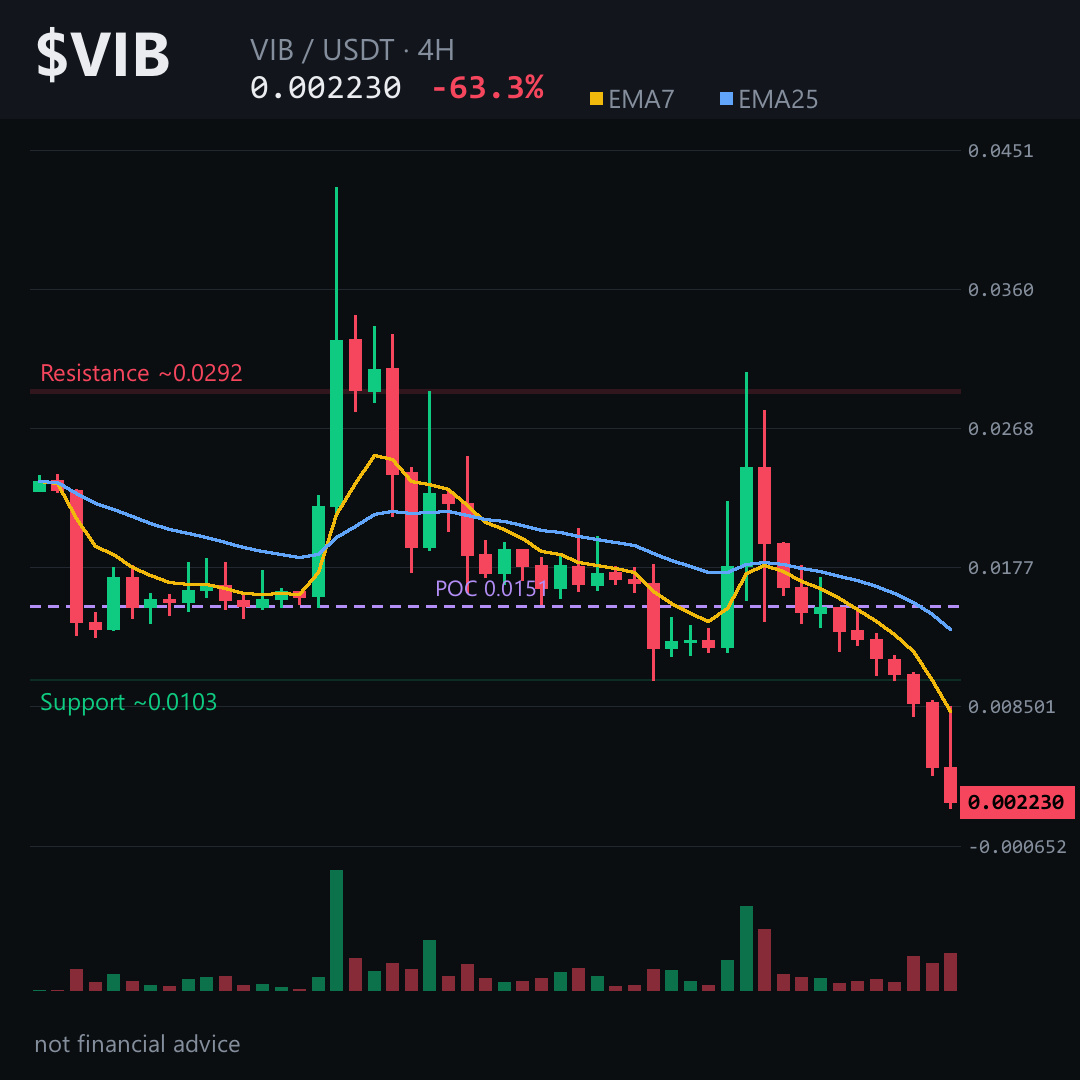
A 63% single-day collapse means the old chart is dead. The levels are ghosts now.
Price gapped through every structure that used to matter. Two straight 4H candles down 49% and 50%. That's not a pullback — it's a liquidation cascade with no real futures market left to cushion it.
Open interest is effectively zero. Funding is flat. So when $VIB bounces, it won't be a short squeeze — it'll be spot buyers catching a falling knife or a dead-cat flick before the next leg.
RSI is buried oversold — 28 on the 4H, 23 on the weekly. Oversold can stay oversold for weeks after a single-session loss of two-thirds. The old volume-weighted anchor is irrelevant now. What's left is a bearish imbalance between roughly 0.0102 and 0.0089 — an unfilled gap acting as a ceiling if price tries to repair.
The pivot near 0.00224 is the line. If $VIB can't reclaim it on a 4H close, the path points toward 0.00204 and lower. The only invalidation: a decisive push back above the 0.00235 area — and even then, the bounce has to survive that overhead gap.
My read: a falling knife with no cushion. The risk isn't missing the bottom — it's catching the wrong bounce before volume confirms anything real.
Tap $VIB to pull up the chart.
What level are you watching closest on VIB right now? 👇
Follow for the next read on this chart.
⚠️ Not financial advice. DYOR.
#VIB #Viberate #Crypto #BinanceSquare
A 63% single-day collapse means the old chart is dead. The levels are ghosts now.
Price gapped through every structure that used to matter. Two straight 4H candles down 49% and 50%. That's not a pullback — it's a liquidation cascade with no real futures market left to cushion it.
Open interest is effectively zero. Funding is flat. So when $VIB bounces, it won't be a short squeeze — it'll be spot buyers catching a falling knife or a dead-cat flick before the next leg.
RSI is buried oversold — 28 on the 4H, 23 on the weekly. Oversold can stay oversold for weeks after a single-session loss of two-thirds. The old volume-weighted anchor is irrelevant now. What's left is a bearish imbalance between roughly 0.0102 and 0.0089 — an unfilled gap acting as a ceiling if price tries to repair.
The pivot near 0.00224 is the line. If $VIB can't reclaim it on a 4H close, the path points toward 0.00204 and lower. The only invalidation: a decisive push back above the 0.00235 area — and even then, the bounce has to survive that overhead gap.
My read: a falling knife with no cushion. The risk isn't missing the bottom — it's catching the wrong bounce before volume confirms anything real.
Tap $VIB to pull up the chart.
What level are you watching closest on VIB right now? 👇
Follow for the next read on this chart.
⚠️ Not financial advice. DYOR.
#VIB #Viberate #Crypto #BinanceSquare
Price gapped through every structure that used to matter. Two straight 4H candles down 49% and 50%. That's not a pullback — it's a liquidation cascade with no real futures market left to cushion it.
Open interest is effectively zero. Funding is flat. So when $VIB bounces, it won't be a short squeeze — it'll be spot buyers catching a falling knife or a dead-cat flick before the next leg.
RSI is buried oversold — 28 on the 4H, 23 on the weekly. Oversold can stay oversold for weeks after a single-session loss of two-thirds. The old volume-weighted anchor is irrelevant now. What's left is a bearish imbalance between roughly 0.0102 and 0.0089 — an unfilled gap acting as a ceiling if price tries to repair.
The pivot near 0.00224 is the line. If $VIB can't reclaim it on a 4H close, the path points toward 0.00204 and lower. The only invalidation: a decisive push back above the 0.00235 area — and even then, the bounce has to survive that overhead gap.
My read: a falling knife with no cushion. The risk isn't missing the bottom — it's catching the wrong bounce before volume confirms anything real.
Tap $VIB to pull up the chart.
What level are you watching closest on VIB right now? 👇
Follow for the next read on this chart.
⚠️ Not financial advice. DYOR.
#VIB #Viberate #Crypto #BinanceSquare
5
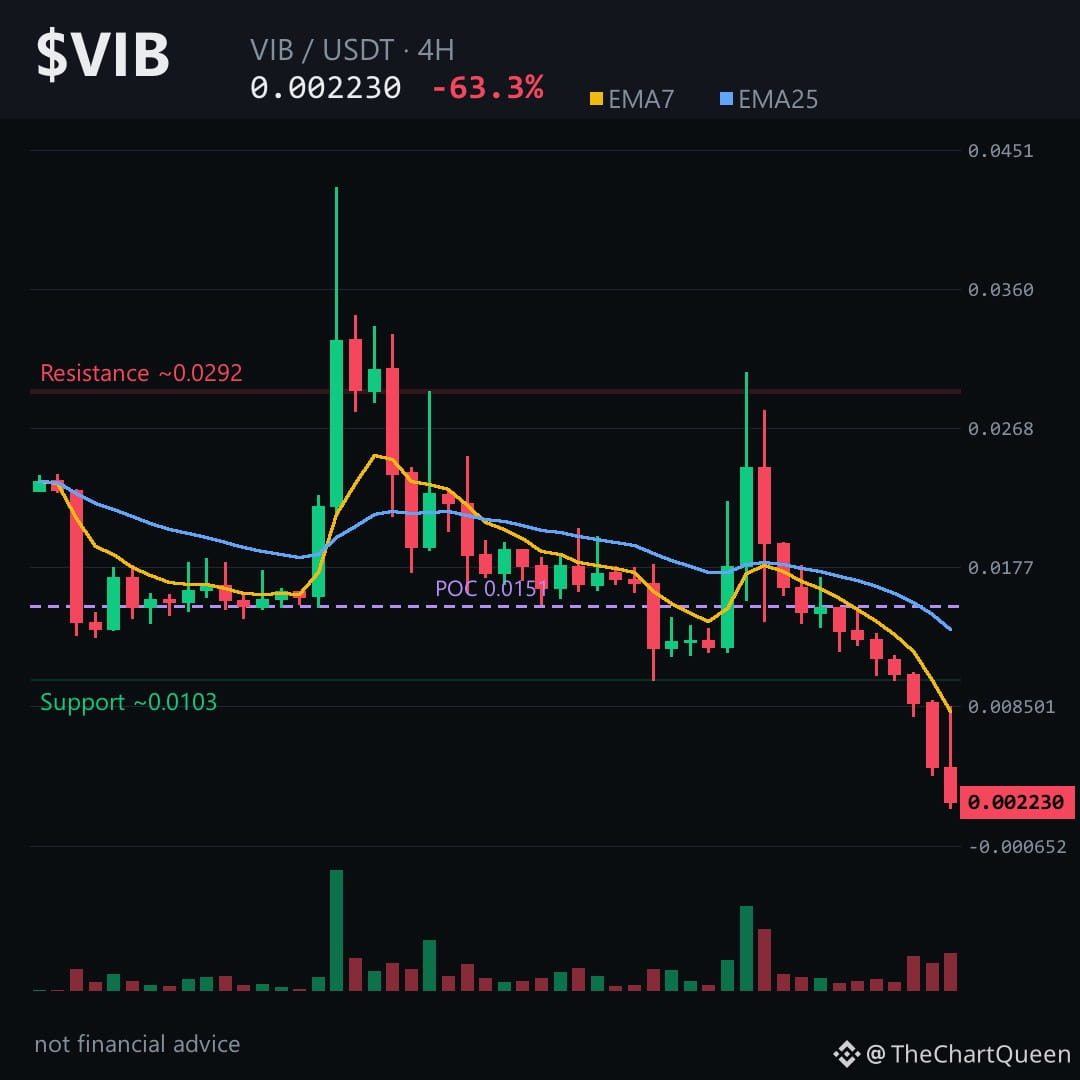
That 50% plunge from 0.007 to 0.0022 in 24 h left a bearish scar on the 4‑hour chart.
Here’s why the next move matters 👇
The 4H candles are screaming down: 10 reds vs 2 greens, EMA7 slipping under EMA25, and RSI stuck in the 20s. Yet a tiny unfilled bearish gap sits just above the current price, hinting the market could keep digging.
On the 4‑hour picture the price is hovering around the 0.00224 zone. If $VIB can’t hold above the 0.00235 ceiling, the bearish case stays alive and the next target slides toward the 0.00204 area. Lose the 0.00224 level on a 4H close and the read flips.
Tap $VIB to pull up the chart and verify the zones yourself.
My take: expect the bears to test the 0.00235 barrier; a break below the 0.00224 zone would reinforce the downtrend.
Follow me for the next update when the 0.00235 line either holds or gives way – I’ll break down what that means for the swing.
What level are you watching on $VIB’s chart right now? 👇
⚠️ Not financial advice. DYOR.
#VIB #Crypto #BinanceSquare
That 50% plunge from 0.007 to 0.0022 in 24 h left a bearish scar on the 4‑hour chart.
Here’s why the next move matters 👇
The 4H candles are screaming down: 10 reds vs 2 greens, EMA7 slipping under EMA25, and RSI stuck in the 20s. Yet a tiny unfilled bearish gap sits just above the current price, hinting the market could keep digging.
On the 4‑hour picture the price is hovering around the 0.00224 zone. If $VIB can’t hold above the 0.00235 ceiling, the bearish case stays alive and the next target slides toward the 0.00204 area. Lose the 0.00224 level on a 4H close and the read flips.
Tap $VIB to pull up the chart and verify the zones yourself.
My take: expect the bears to test the 0.00235 barrier; a break below the 0.00224 zone would reinforce the downtrend.
Follow me for the next update when the 0.00235 line either holds or gives way – I’ll break down what that means for the swing.
What level are you watching on $VIB’s chart right now? 👇
⚠️ Not financial advice. DYOR.
#VIB #Crypto #BinanceSquare
Here’s why the next move matters 👇
The 4H candles are screaming down: 10 reds vs 2 greens, EMA7 slipping under EMA25, and RSI stuck in the 20s. Yet a tiny unfilled bearish gap sits just above the current price, hinting the market could keep digging.
On the 4‑hour picture the price is hovering around the 0.00224 zone. If $VIB can’t hold above the 0.00235 ceiling, the bearish case stays alive and the next target slides toward the 0.00204 area. Lose the 0.00224 level on a 4H close and the read flips.
Tap $VIB to pull up the chart and verify the zones yourself.
My take: expect the bears to test the 0.00235 barrier; a break below the 0.00224 zone would reinforce the downtrend.
Follow me for the next update when the 0.00235 line either holds or gives way – I’ll break down what that means for the swing.
What level are you watching on $VIB’s chart right now? 👇
⚠️ Not financial advice. DYOR.
#VIB #Crypto #BinanceSquare
1
Your loss is staring at the 0.00235 ceiling – $VIB is about to test it.
Read on 👇
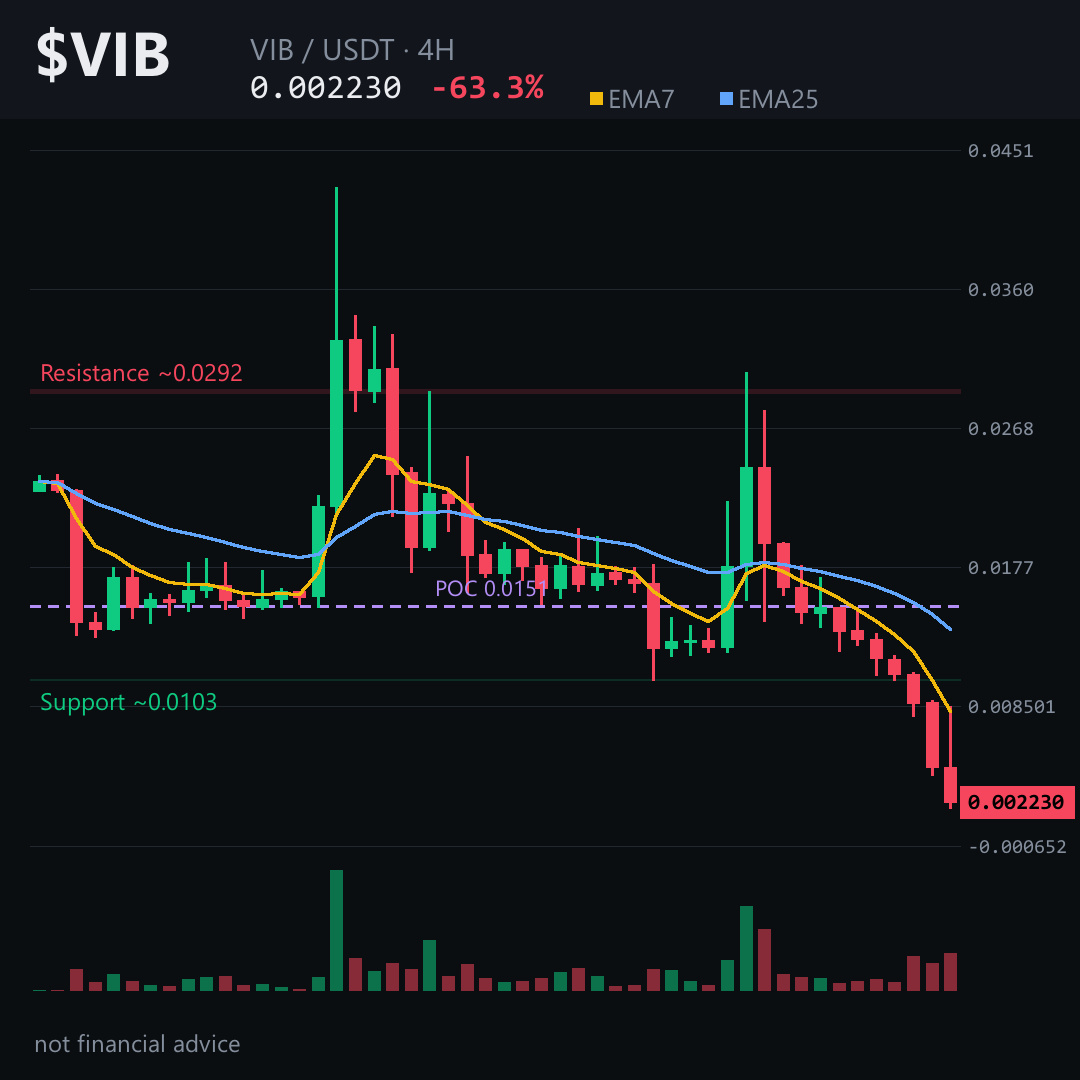
Price is deep in the red, 10 of 12 candles down, RSI under 30, and the 4‑hour EMA7 sits well under EMA25. Yet the chart hides a bearish gap that could pull the market lower.
On the 4‑hour picture the current price hovers around the 0.00224 area. The next barrier is the ~0.00235 zone – a break above this level on a 4H close would invalidate the bearish case. The downside target sits near the 0.00204 zone, where the volume‑profile point of control sits, offering the next demand pocket. Tap $VIB to pull up the chart and see these zones yourself.
The structure points to another leg down; the real risk is a surprise bounce above 0.00235.
If you want a follow‑up when that ceiling cracks or holds, hit follow – I’ll break down the next move. What level do you think will hold the most pressure on $VIB? 👇
⚠️ Not financial advice. DYOR. #VIB #Crypto #BinanceSquare
Your loss is staring at the 0.00235 ceiling – $VIB is about to test it.
Read on 👇
Price is deep in the red, 10 of 12 candles down, RSI under 30, and the 4‑hour EMA7 sits well under EMA25. Yet the chart hides a bearish gap that could pull the market lower.
On the 4‑hour picture the current price hovers around the 0.00224 area. The next barrier is the ~0.00235 zone – a break above this level on a 4H close would invalidate the bearish case. The downside target sits near the 0.00204 zone, where the volume‑profile point of control sits, offering the next demand pocket. Tap $VIB to pull up the chart and see these zones yourself.
The structure points to another leg down; the real risk is a surprise bounce above 0.00235.
If you want a follow‑up when that ceiling cracks or holds, hit follow – I’ll break down the next move. What level do you think will hold the most pressure on $VIB? 👇
⚠️ Not financial advice. DYOR. #VIB #Crypto #BinanceSquare
Read on 👇
Price is deep in the red, 10 of 12 candles down, RSI under 30, and the 4‑hour EMA7 sits well under EMA25. Yet the chart hides a bearish gap that could pull the market lower.
On the 4‑hour picture the current price hovers around the 0.00224 area. The next barrier is the ~0.00235 zone – a break above this level on a 4H close would invalidate the bearish case. The downside target sits near the 0.00204 zone, where the volume‑profile point of control sits, offering the next demand pocket. Tap $VIB to pull up the chart and see these zones yourself.
The structure points to another leg down; the real risk is a surprise bounce above 0.00235.
If you want a follow‑up when that ceiling cracks or holds, hit follow – I’ll break down the next move. What level do you think will hold the most pressure on $VIB? 👇
⚠️ Not financial advice. DYOR. #VIB #Crypto #BinanceSquare
13
VIB just printed a -63% candle in a single day.
Is this the bottom, or just a pause before it gets uglier?
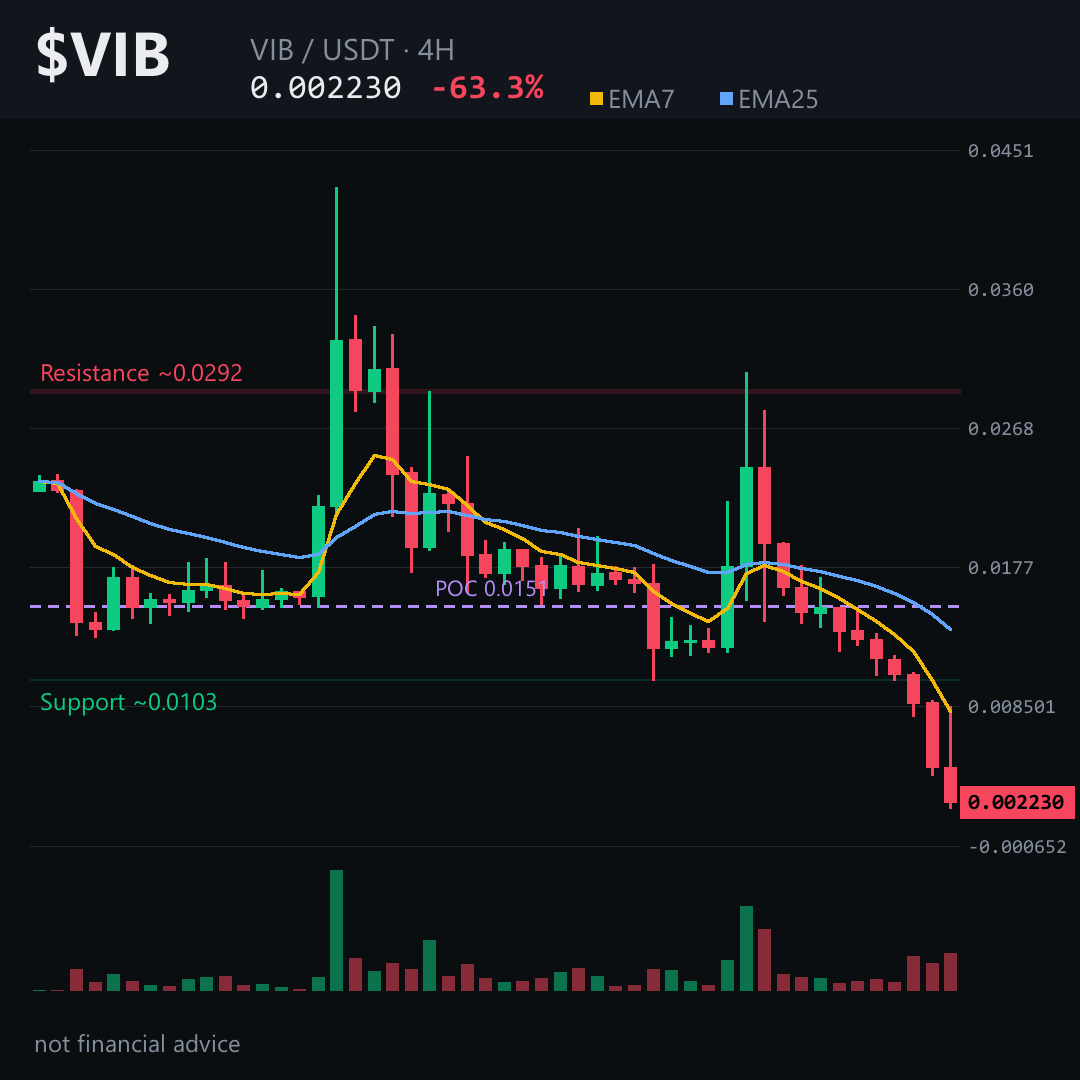
Price is near 0.0022. The 4H trend is firmly bearish. RSI is deeply oversold at 28 — but oversold in a downtrend often just means "cheap can get cheaper."
There's an unfilled gap between roughly 0.0102 and 0.0089 — a zone price blew through so fast it never came back. That's the trap. Any bounce toward it is likely to get sold again.
If $VIB can't reclaim 0.00235 on a 4H close, the path of least resistance stays lower — next zone around 0.0020, then the macro objective near 0.0014.
My read: a falling knife with no real buying pressure yet. Any bounce is a relief move, not a trend change.
Tap $VIB to pull up the chart.
Follow me — I'll update if 0.00235 gets reclaimed or 0.0020 breaks.
Which zone are you watching more closely on $VIB — the reclaim or the breakdown? 👇
⚠️ Not financial advice. DYOR.
#VIB #Crypto #Altcoins #BinanceSquare
VIB just printed a -63% candle in a single day.
Is this the bottom, or just a pause before it gets uglier?
Price is near 0.0022. The 4H trend is firmly bearish. RSI is deeply oversold at 28 — but oversold in a downtrend often just means "cheap can get cheaper."
There's an unfilled gap between roughly 0.0102 and 0.0089 — a zone price blew through so fast it never came back. That's the trap. Any bounce toward it is likely to get sold again.
If $VIB can't reclaim 0.00235 on a 4H close, the path of least resistance stays lower — next zone around 0.0020, then the macro objective near 0.0014.
My read: a falling knife with no real buying pressure yet. Any bounce is a relief move, not a trend change.
Tap $VIB to pull up the chart.
Follow me — I'll update if 0.00235 gets reclaimed or 0.0020 breaks.
Which zone are you watching more closely on $VIB — the reclaim or the breakdown? 👇
⚠️ Not financial advice. DYOR.
#VIB #Crypto #Altcoins #BinanceSquare
Is this the bottom, or just a pause before it gets uglier?
Price is near 0.0022. The 4H trend is firmly bearish. RSI is deeply oversold at 28 — but oversold in a downtrend often just means "cheap can get cheaper."
There's an unfilled gap between roughly 0.0102 and 0.0089 — a zone price blew through so fast it never came back. That's the trap. Any bounce toward it is likely to get sold again.
If $VIB can't reclaim 0.00235 on a 4H close, the path of least resistance stays lower — next zone around 0.0020, then the macro objective near 0.0014.
My read: a falling knife with no real buying pressure yet. Any bounce is a relief move, not a trend change.
Tap $VIB to pull up the chart.
Follow me — I'll update if 0.00235 gets reclaimed or 0.0020 breaks.
Which zone are you watching more closely on $VIB — the reclaim or the breakdown? 👇
⚠️ Not financial advice. DYOR.
#VIB #Crypto #Altcoins #BinanceSquare
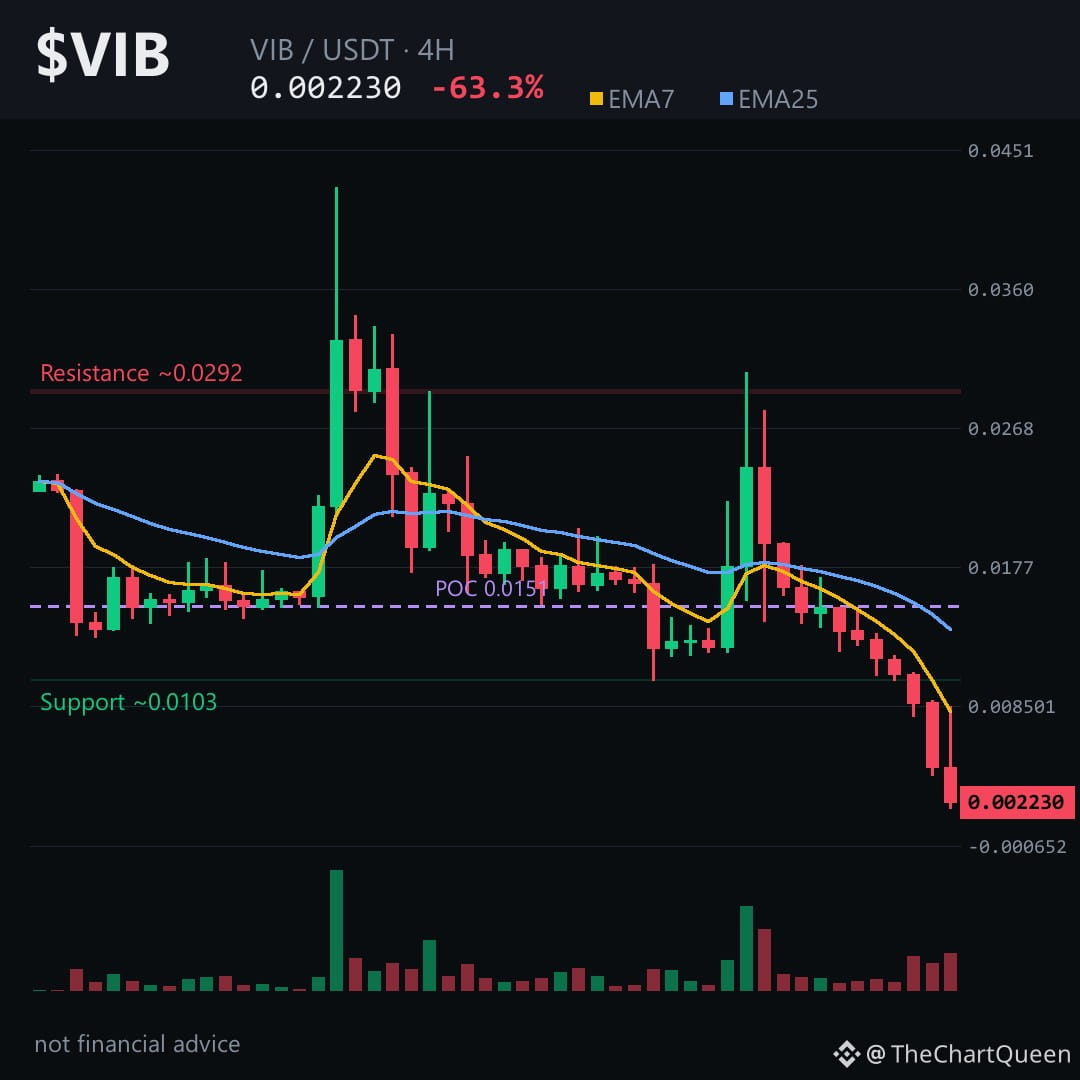
8
Everyone sees a 63% crash and expects a dead-cat bounce. The chart disagrees.
$VIB just printed two consecutive 50% down candles — the last one closing at 0.00223 after tagging 0.0018. That's not a flush. That's a stairway with no railings, and the 4H structure shows no fight from buyers at all.
The 4H read is brutally simple: price sits under every moving average, RSI is buried near 28, and there's a bearish gap unfilled just above — the 0.0089 to 0.0102 zone. That's the ceiling. As long as $VIB trades below it, any bounce is noise, not recovery.
The level to watch is the current pivot around 0.00224. Lose that and the objective sits near 0.00204 — but honestly, the volume profile says bigger demand only appears much lower. The invalidation is clean: a 4H close above 0.00235 and the immediate bearish pressure fades. Until then, sellers own this tape. Tap $VIB and zoom out — the weekly chart is even uglier.
My read: the crowd wants a reversal because the number looks cheap. The chart says cheap can get cheaper. I'd rather wait for structure to form than catch a falling knife.
Follow me — if VIB reclaims that 0.00235 area, the follow-up changes tone fast.
What level are you watching on VIB right now? 👇
⚠️ Not financial advice. DYOR.
#VIB #Crypto #BinanceSquare #Altcoins
Everyone sees a 63% crash and expects a dead-cat bounce. The chart disagrees.
$VIB just printed two consecutive 50% down candles — the last one closing at 0.00223 after tagging 0.0018. That's not a flush. That's a stairway with no railings, and the 4H structure shows no fight from buyers at all.
The 4H read is brutally simple: price sits under every moving average, RSI is buried near 28, and there's a bearish gap unfilled just above — the 0.0089 to 0.0102 zone. That's the ceiling. As long as $VIB trades below it, any bounce is noise, not recovery.
The level to watch is the current pivot around 0.00224. Lose that and the objective sits near 0.00204 — but honestly, the volume profile says bigger demand only appears much lower. The invalidation is clean: a 4H close above 0.00235 and the immediate bearish pressure fades. Until then, sellers own this tape. Tap $VIB and zoom out — the weekly chart is even uglier.
My read: the crowd wants a reversal because the number looks cheap. The chart says cheap can get cheaper. I'd rather wait for structure to form than catch a falling knife.
Follow me — if VIB reclaims that 0.00235 area, the follow-up changes tone fast.
What level are you watching on VIB right now? 👇
⚠️ Not financial advice. DYOR.
#VIB #Crypto #BinanceSquare #Altcoins
$VIB just printed two consecutive 50% down candles — the last one closing at 0.00223 after tagging 0.0018. That's not a flush. That's a stairway with no railings, and the 4H structure shows no fight from buyers at all.
The 4H read is brutally simple: price sits under every moving average, RSI is buried near 28, and there's a bearish gap unfilled just above — the 0.0089 to 0.0102 zone. That's the ceiling. As long as $VIB trades below it, any bounce is noise, not recovery.
The level to watch is the current pivot around 0.00224. Lose that and the objective sits near 0.00204 — but honestly, the volume profile says bigger demand only appears much lower. The invalidation is clean: a 4H close above 0.00235 and the immediate bearish pressure fades. Until then, sellers own this tape. Tap $VIB and zoom out — the weekly chart is even uglier.
My read: the crowd wants a reversal because the number looks cheap. The chart says cheap can get cheaper. I'd rather wait for structure to form than catch a falling knife.
Follow me — if VIB reclaims that 0.00235 area, the follow-up changes tone fast.
What level are you watching on VIB right now? 👇
⚠️ Not financial advice. DYOR.
#VIB #Crypto #BinanceSquare #Altcoins
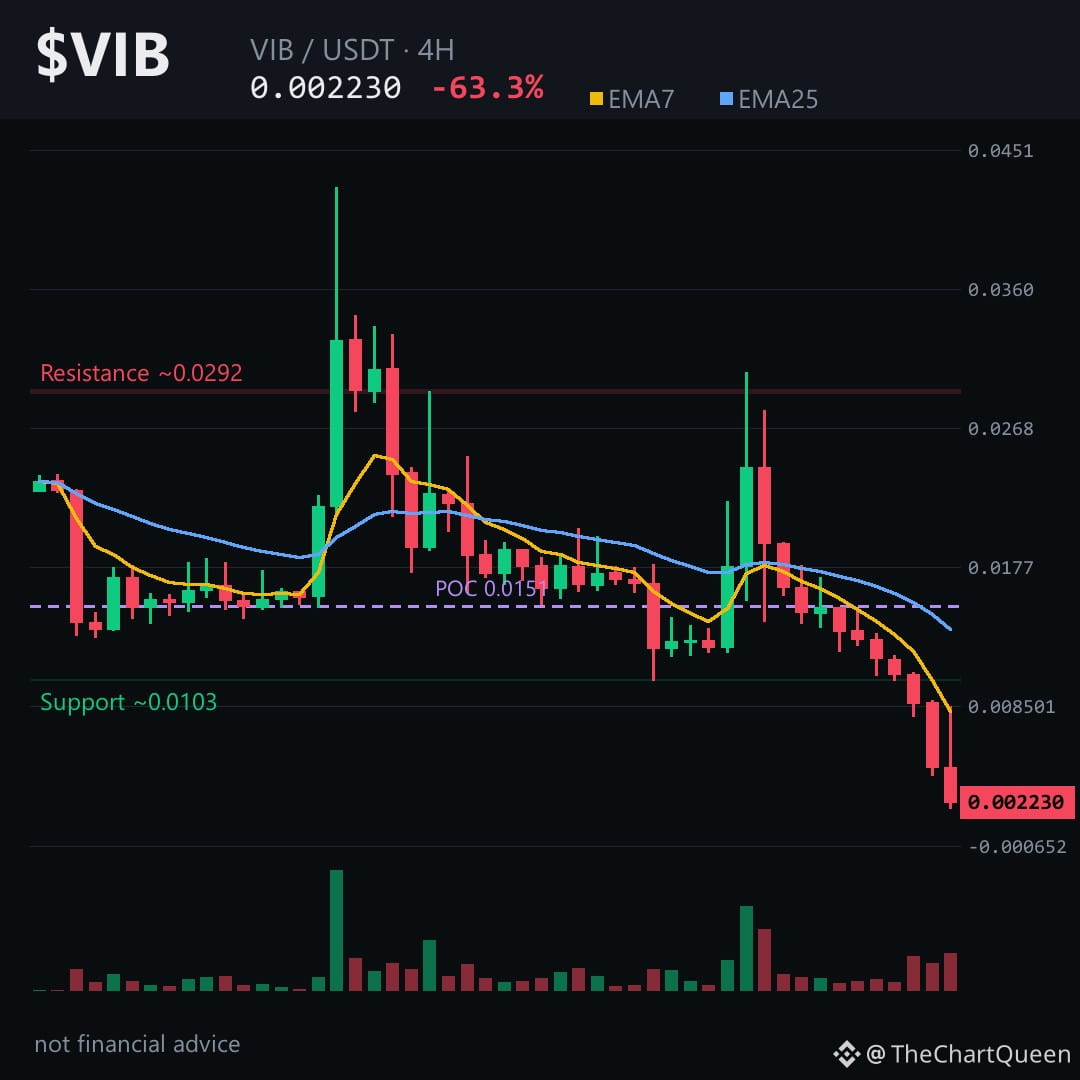
47
What happens when a coin loses 63% in a single day — and then keeps sliding?
That's the question hanging over $VIB right now.
24 hours ago it traded near 0.007. Today it's around 0.0022 — and the last two 4-hour candles each closed down roughly 50%. This isn't a dip. It's a liquidation cascade in slow motion.
Price is far below every major moving average. RSI is buried near 28, which sounds "oversold" until you realize oversold can stay oversold for days in a collapse like this.
The one thing I'm watching: an unfilled gap between roughly 0.0089 and 0.0102. Markets often revisit those zones — but "often" doesn't mean "soon," and $VIB is still printing fresh lows.
My read: the 4-hour chart leans hard bearish. If price can't reclaim 0.00235, the next magnet sits near 0.00204. Lose that and there's very little structure below. Tap $VIB to see how cleanly it's rejecting every bounce.
The real risk isn't missing a rebound — it's catching a falling knife while liquidity sits at zero. No one's paying to be short, and no one's paying to be long. The market simply doesn't know where fair value is yet.
Follow me — I'll be watching whether VIB can stabilize above 0.00235 or if this unwind still has another leg down. Which level are you watching more closely right now? 👇
⚠️ Not financial advice. DYOR.
#VIB #Crypto #Altcoins #BinanceSquare
What happens when a coin loses 63% in a single day — and then keeps sliding?
That's the question hanging over $VIB right now.
24 hours ago it traded near 0.007. Today it's around 0.0022 — and the last two 4-hour candles each closed down roughly 50%. This isn't a dip. It's a liquidation cascade in slow motion.
Price is far below every major moving average. RSI is buried near 28, which sounds "oversold" until you realize oversold can stay oversold for days in a collapse like this.
The one thing I'm watching: an unfilled gap between roughly 0.0089 and 0.0102. Markets often revisit those zones — but "often" doesn't mean "soon," and $VIB is still printing fresh lows.
My read: the 4-hour chart leans hard bearish. If price can't reclaim 0.00235, the next magnet sits near 0.00204. Lose that and there's very little structure below. Tap $VIB to see how cleanly it's rejecting every bounce.
The real risk isn't missing a rebound — it's catching a falling knife while liquidity sits at zero. No one's paying to be short, and no one's paying to be long. The market simply doesn't know where fair value is yet.
Follow me — I'll be watching whether VIB can stabilize above 0.00235 or if this unwind still has another leg down. Which level are you watching more closely right now? 👇
⚠️ Not financial advice. DYOR.
#VIB #Crypto #Altcoins #BinanceSquare
That's the question hanging over $VIB right now.
24 hours ago it traded near 0.007. Today it's around 0.0022 — and the last two 4-hour candles each closed down roughly 50%. This isn't a dip. It's a liquidation cascade in slow motion.
Price is far below every major moving average. RSI is buried near 28, which sounds "oversold" until you realize oversold can stay oversold for days in a collapse like this.
The one thing I'm watching: an unfilled gap between roughly 0.0089 and 0.0102. Markets often revisit those zones — but "often" doesn't mean "soon," and $VIB is still printing fresh lows.
My read: the 4-hour chart leans hard bearish. If price can't reclaim 0.00235, the next magnet sits near 0.00204. Lose that and there's very little structure below. Tap $VIB to see how cleanly it's rejecting every bounce.
The real risk isn't missing a rebound — it's catching a falling knife while liquidity sits at zero. No one's paying to be short, and no one's paying to be long. The market simply doesn't know where fair value is yet.
Follow me — I'll be watching whether VIB can stabilize above 0.00235 or if this unwind still has another leg down. Which level are you watching more closely right now? 👇
⚠️ Not financial advice. DYOR.
#VIB #Crypto #Altcoins #BinanceSquare
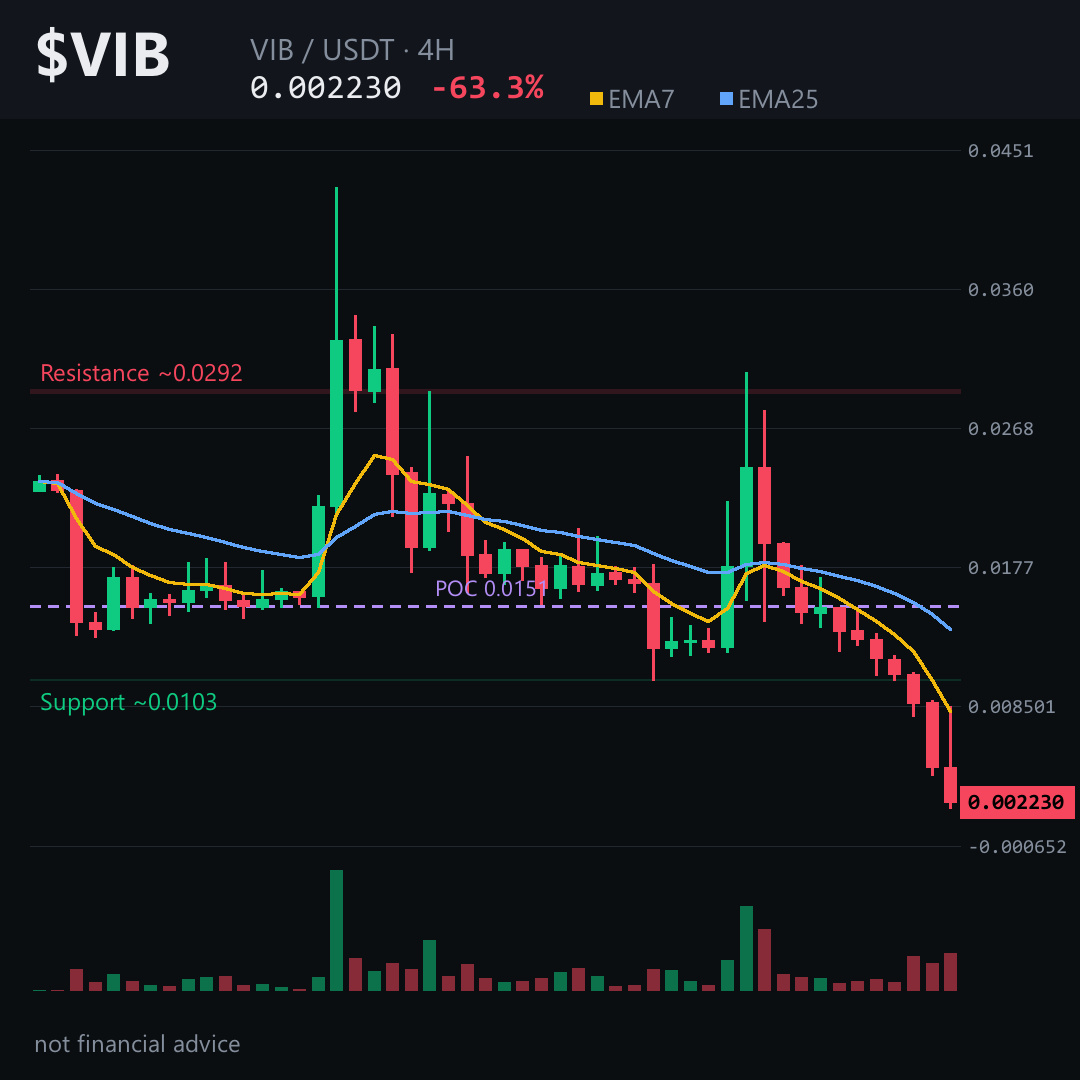
48

·
--
Extreme intraday ranges usually teach one big lesson: order book depth matters.
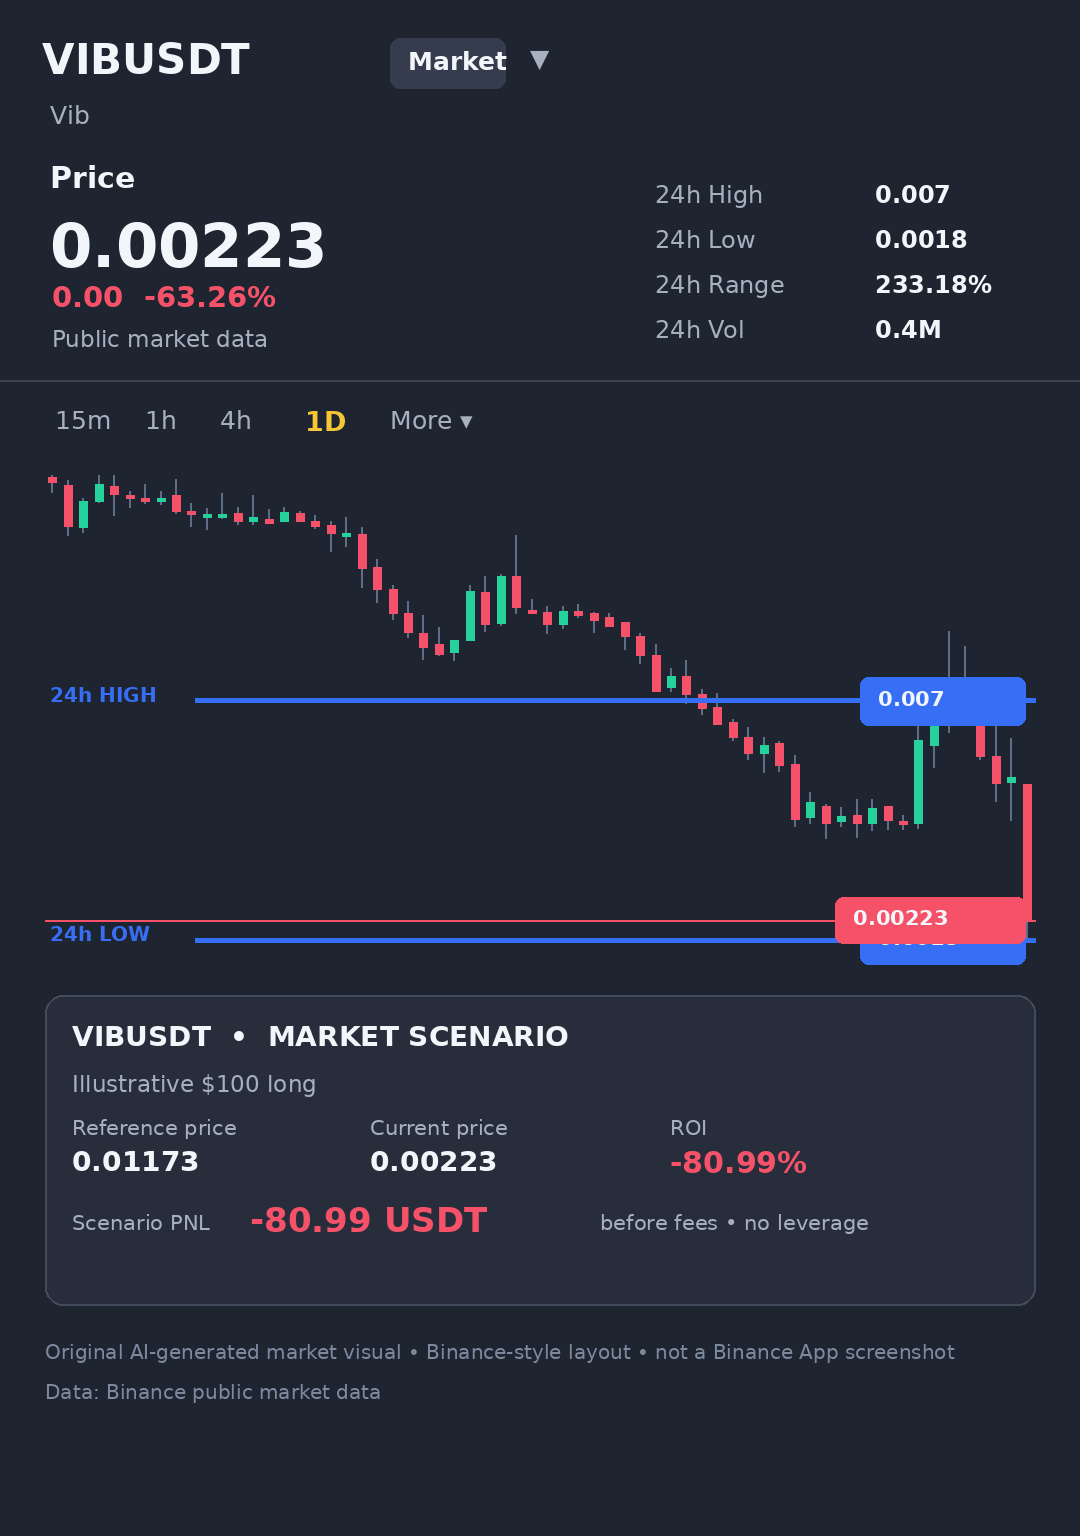
$VIB is down 63.26% at 0.00223, but the key takeaway is its massive 233.18% spread between 0.007 and 0.0018 on $380,612 volume. When liquidity is thin, market orders can easily trigger outsized swings in either direction.
How do you manage your risk during volatility spikes like this? #VIB #CryptoTrading
Extreme intraday ranges usually teach one big lesson: order book depth matters.
$VIB is down 63.26% at 0.00223, but the key takeaway is its massive 233.18% spread between 0.007 and 0.0018 on $380,612 volume. When liquidity is thin, market orders can easily trigger outsized swings in either direction.
How do you manage your risk during volatility spikes like this? #VIB #CryptoTrading
$VIB is down 63.26% at 0.00223, but the key takeaway is its massive 233.18% spread between 0.007 and 0.0018 on $380,612 volume. When liquidity is thin, market orders can easily trigger outsized swings in either direction.
How do you manage your risk during volatility spikes like this? #VIB #CryptoTrading
81

·
--
Sharp drop: Is it time to buy the dip?
I checked the prices this morning and was shocked to see down 63.26%, with a volume of 380612. Honestly, I often wonder whether I should ignore “vibe coding” projects whose only news seems to be apologies—like the TV incident caused by AI not really knowing what it was doing—or look for opportunities while the market is in a panic.
1) Potential: is showing a great deal of volatility. Compared with another project that has a clearer technological foundation, I think is quite risky because the information about it isn’t really clear. It seems like a highly experimental project with little oversight. 🤔
2) Risk and reward: With a sharp drop of 63.26%, the potential returns could be very high if it recovers. But there’s also the risk of losing everything if the project doesn’t have a solid foundation. Michael Saylor once said that investing means believing in intrinsic value, not “vibes.”
For informational purposes only, not investment advice. DYOR.
#VIB $VIB
Sharp drop: Is it time to buy the dip?
I checked the prices this morning and was shocked to see down 63.26%, with a volume of 380612. Honestly, I often wonder whether I should ignore “vibe coding” projects whose only news seems to be apologies—like the TV incident caused by AI not really knowing what it was doing—or look for opportunities while the market is in a panic.
1) Potential: is showing a great deal of volatility. Compared with another project that has a clearer technological foundation, I think is quite risky because the information about it isn’t really clear. It seems like a highly experimental project with little oversight. 🤔
2) Risk and reward: With a sharp drop of 63.26%, the potential returns could be very high if it recovers. But there’s also the risk of losing everything if the project doesn’t have a solid foundation. Michael Saylor once said that investing means believing in intrinsic value, not “vibes.”
For informational purposes only, not investment advice. DYOR.
#VIB $VIB
I checked the prices this morning and was shocked to see down 63.26%, with a volume of 380612. Honestly, I often wonder whether I should ignore “vibe coding” projects whose only news seems to be apologies—like the TV incident caused by AI not really knowing what it was doing—or look for opportunities while the market is in a panic.
1) Potential: is showing a great deal of volatility. Compared with another project that has a clearer technological foundation, I think is quite risky because the information about it isn’t really clear. It seems like a highly experimental project with little oversight. 🤔
2) Risk and reward: With a sharp drop of 63.26%, the potential returns could be very high if it recovers. But there’s also the risk of losing everything if the project doesn’t have a solid foundation. Michael Saylor once said that investing means believing in intrinsic value, not “vibes.”
For informational purposes only, not investment advice. DYOR.
#VIB $VIB
10
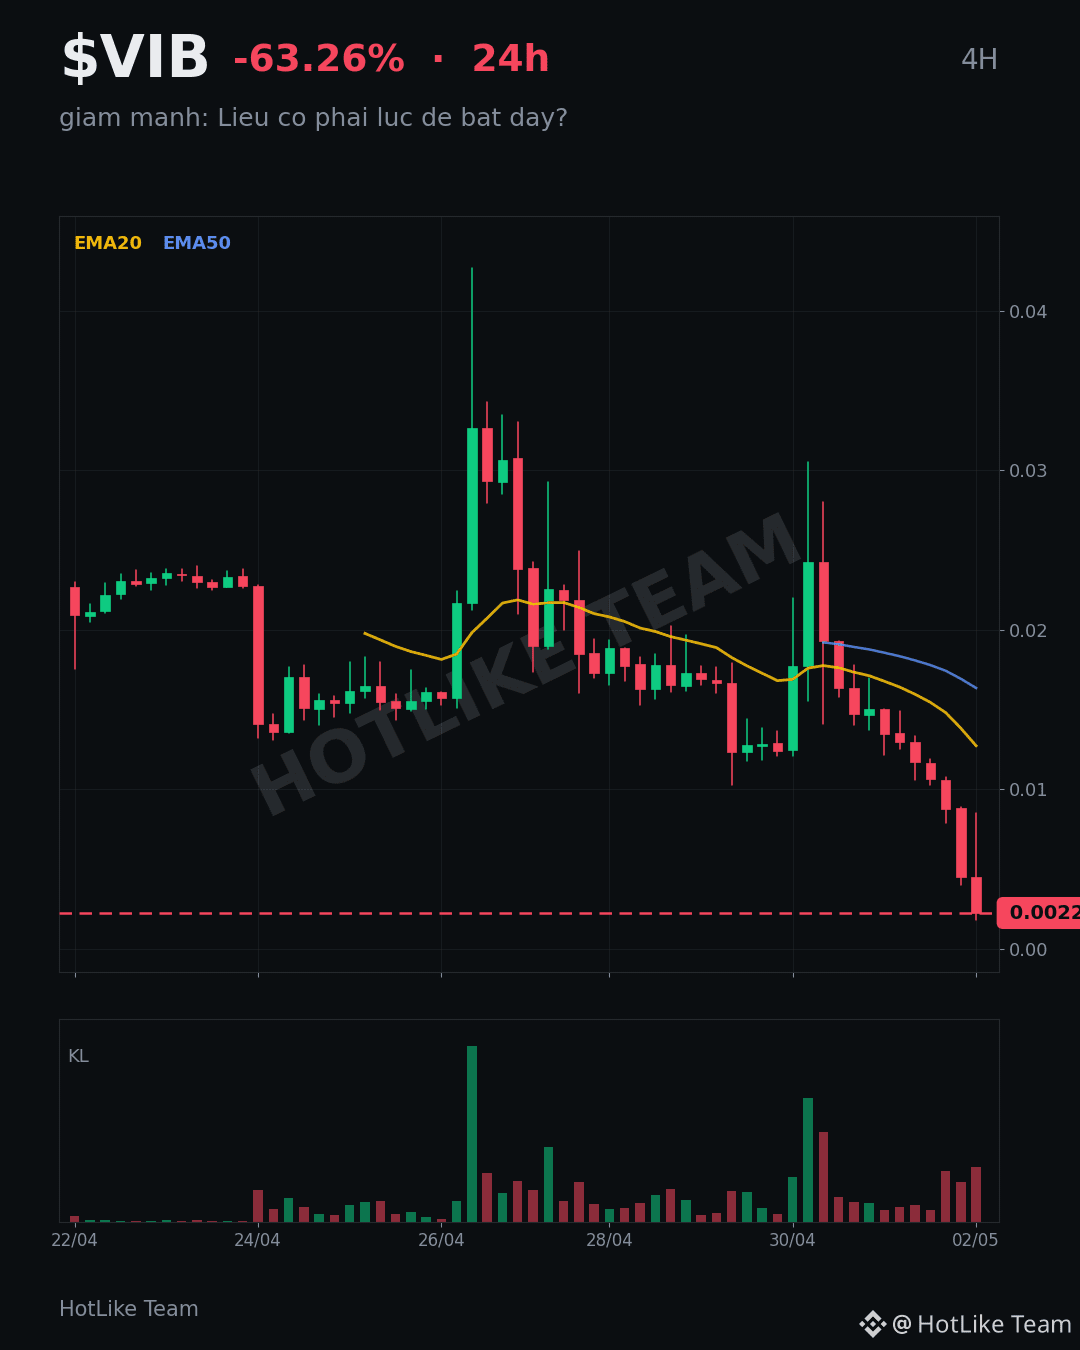
The 24h chart lost 63% and still hasn't found a floor. That is not a dip — that is a structural break.
Ten of the last twelve 4H candles are red, with the last two down 49% and 50%. Price sits near 0.0022 after tagging 0.0018. RSI is buried under 30, but oversold is a condition, not a signal. EMA7 is less than half the EMA25 — that's a liquidation cascade, not a trend.
Funding is flat at zero and open interest is empty. No leveraged crowd left to squeeze. Any bounce is spot-driven and likely shallow. The bearish FVG between 0.0089 and 0.0102 is the overhead gap that must fill before this looks anything but heavy.
The level that matters is 0.00235. If $VIB can't reclaim that zone on a 4H close, path of least resistance stays down toward 0.0020 and potentially lower. Tap $VIB to see how cleanly it rejected every attempt to hold above 0.004.
My read: a falling knife with no futures support underneath. The risk is not missing a bounce — it's catching one before volume confirms.
I'll revisit if price closes back above 0.00235 — follow so that analysis lands on your feed.
What level are you watching on $VIB right now 👇
Not financial advice. DYOR.
#VIB #Viberate #Crypto #BinanceSquare
The 24h chart lost 63% and still hasn't found a floor. That is not a dip — that is a structural break.
Ten of the last twelve 4H candles are red, with the last two down 49% and 50%. Price sits near 0.0022 after tagging 0.0018. RSI is buried under 30, but oversold is a condition, not a signal. EMA7 is less than half the EMA25 — that's a liquidation cascade, not a trend.
Funding is flat at zero and open interest is empty. No leveraged crowd left to squeeze. Any bounce is spot-driven and likely shallow. The bearish FVG between 0.0089 and 0.0102 is the overhead gap that must fill before this looks anything but heavy.
The level that matters is 0.00235. If $VIB can't reclaim that zone on a 4H close, path of least resistance stays down toward 0.0020 and potentially lower. Tap $VIB to see how cleanly it rejected every attempt to hold above 0.004.
My read: a falling knife with no futures support underneath. The risk is not missing a bounce — it's catching one before volume confirms.
I'll revisit if price closes back above 0.00235 — follow so that analysis lands on your feed.
What level are you watching on $VIB right now 👇
Not financial advice. DYOR.
#VIB #Viberate #Crypto #BinanceSquare
Ten of the last twelve 4H candles are red, with the last two down 49% and 50%. Price sits near 0.0022 after tagging 0.0018. RSI is buried under 30, but oversold is a condition, not a signal. EMA7 is less than half the EMA25 — that's a liquidation cascade, not a trend.
Funding is flat at zero and open interest is empty. No leveraged crowd left to squeeze. Any bounce is spot-driven and likely shallow. The bearish FVG between 0.0089 and 0.0102 is the overhead gap that must fill before this looks anything but heavy.
The level that matters is 0.00235. If $VIB can't reclaim that zone on a 4H close, path of least resistance stays down toward 0.0020 and potentially lower. Tap $VIB to see how cleanly it rejected every attempt to hold above 0.004.
My read: a falling knife with no futures support underneath. The risk is not missing a bounce — it's catching one before volume confirms.
I'll revisit if price closes back above 0.00235 — follow so that analysis lands on your feed.
What level are you watching on $VIB right now 👇
Not financial advice. DYOR.
#VIB #Viberate #Crypto #BinanceSquare
88
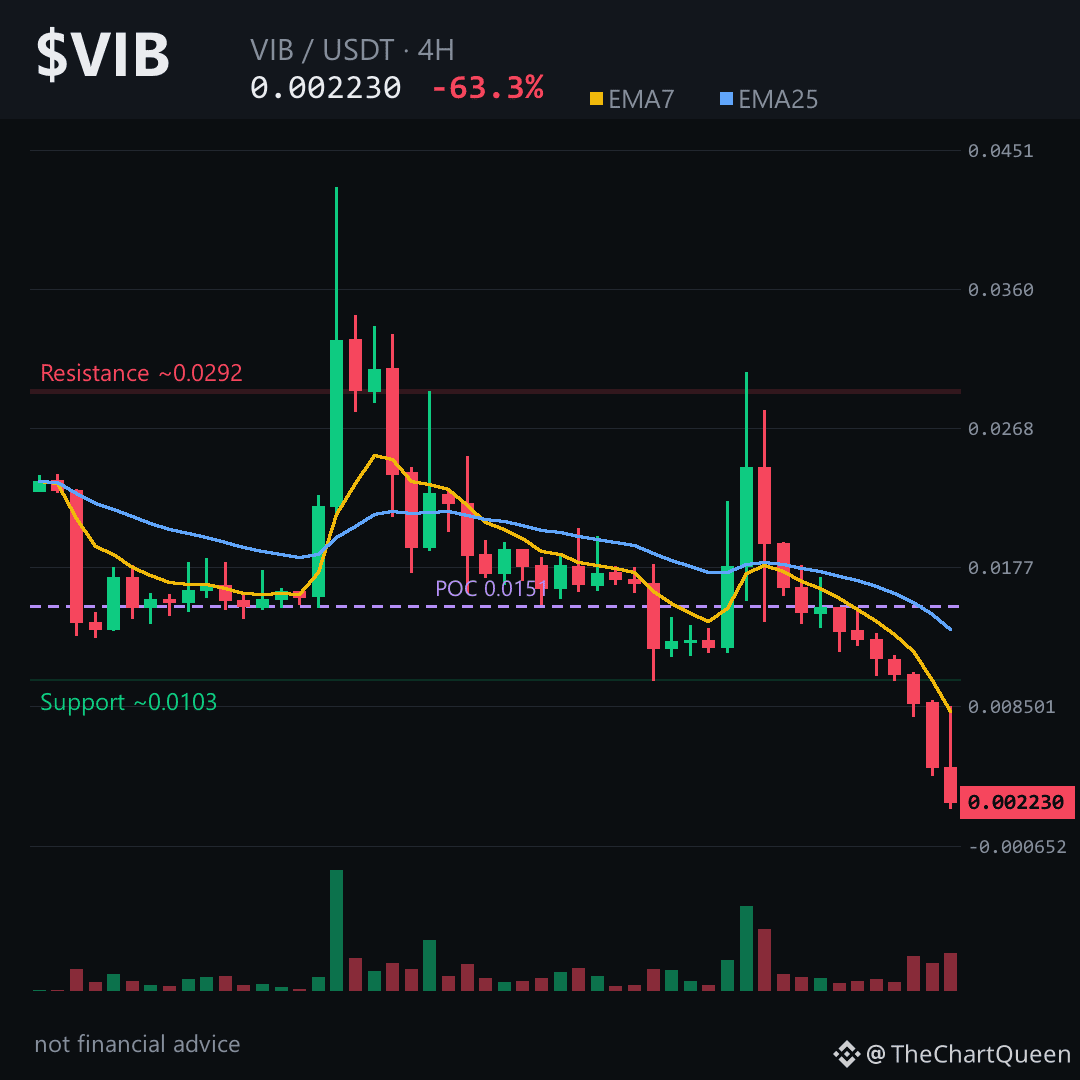
-63.26% in a single day. That number alone tells you $VIB isn't in a dip — it's in a structural collapse.
The 4H chart shows twelve candles of nearly uninterrupted selling. Two green. Ten red. The last four candles alone carved out a -49% and -50% move back-to-back. This is a market repricing the asset with zero bid underneath.
RSI sits at 28 on the 4H — technically oversold, but in a freefall like this, oversold can stay oversold for days. The EMA7 has utterly detached from the EMA25, with price trading far below both. That's not a setup. That's a falling knife with no handle.
And here's the trap: the unfilled bearish gap between the 0.0102 and 0.0089 area on the 4H. Price blew through it with such velocity that it never paused to fill. Gaps like that often act as magnets on any relief bounce — but only after momentum exhausts. We're not there yet.
The 4H level that matters most is the invalidation zone around 0.00235. As long as $VIB stays below that area, the path of least resistance remains lower. The next objective sits near the 0.00204 zone, which is the last meaningful pivot before the prior low structure gives way entirely. Tap $VIB to pull up the chart and verify these zones yourself.
My read: the trend is decisively bearish, but the real risk isn't more downside — it's a violent dead-cat bounce that punishes anyone chasing the breakdown. Patience beats heroics here.
I'll revisit this chart once price either reclaims the 0.00235 area or breaks the 0.00204 zone — follow so you catch that update.
What level are you watching most closely on VIB right now? 👇
⚠️ Not financial advice. DYOR.
#VIB #Crypto #Altcoins #BinanceSquare
-63.26% in a single day. That number alone tells you $VIB isn't in a dip — it's in a structural collapse.
The 4H chart shows twelve candles of nearly uninterrupted selling. Two green. Ten red. The last four candles alone carved out a -49% and -50% move back-to-back. This is a market repricing the asset with zero bid underneath.
RSI sits at 28 on the 4H — technically oversold, but in a freefall like this, oversold can stay oversold for days. The EMA7 has utterly detached from the EMA25, with price trading far below both. That's not a setup. That's a falling knife with no handle.
And here's the trap: the unfilled bearish gap between the 0.0102 and 0.0089 area on the 4H. Price blew through it with such velocity that it never paused to fill. Gaps like that often act as magnets on any relief bounce — but only after momentum exhausts. We're not there yet.
The 4H level that matters most is the invalidation zone around 0.00235. As long as $VIB stays below that area, the path of least resistance remains lower. The next objective sits near the 0.00204 zone, which is the last meaningful pivot before the prior low structure gives way entirely. Tap $VIB to pull up the chart and verify these zones yourself.
My read: the trend is decisively bearish, but the real risk isn't more downside — it's a violent dead-cat bounce that punishes anyone chasing the breakdown. Patience beats heroics here.
I'll revisit this chart once price either reclaims the 0.00235 area or breaks the 0.00204 zone — follow so you catch that update.
What level are you watching most closely on VIB right now? 👇
⚠️ Not financial advice. DYOR.
#VIB #Crypto #Altcoins #BinanceSquare
The 4H chart shows twelve candles of nearly uninterrupted selling. Two green. Ten red. The last four candles alone carved out a -49% and -50% move back-to-back. This is a market repricing the asset with zero bid underneath.
RSI sits at 28 on the 4H — technically oversold, but in a freefall like this, oversold can stay oversold for days. The EMA7 has utterly detached from the EMA25, with price trading far below both. That's not a setup. That's a falling knife with no handle.
And here's the trap: the unfilled bearish gap between the 0.0102 and 0.0089 area on the 4H. Price blew through it with such velocity that it never paused to fill. Gaps like that often act as magnets on any relief bounce — but only after momentum exhausts. We're not there yet.
The 4H level that matters most is the invalidation zone around 0.00235. As long as $VIB stays below that area, the path of least resistance remains lower. The next objective sits near the 0.00204 zone, which is the last meaningful pivot before the prior low structure gives way entirely. Tap $VIB to pull up the chart and verify these zones yourself.
My read: the trend is decisively bearish, but the real risk isn't more downside — it's a violent dead-cat bounce that punishes anyone chasing the breakdown. Patience beats heroics here.
I'll revisit this chart once price either reclaims the 0.00235 area or breaks the 0.00204 zone — follow so you catch that update.
What level are you watching most closely on VIB right now? 👇
⚠️ Not financial advice. DYOR.
#VIB #Crypto #Altcoins #BinanceSquare
9
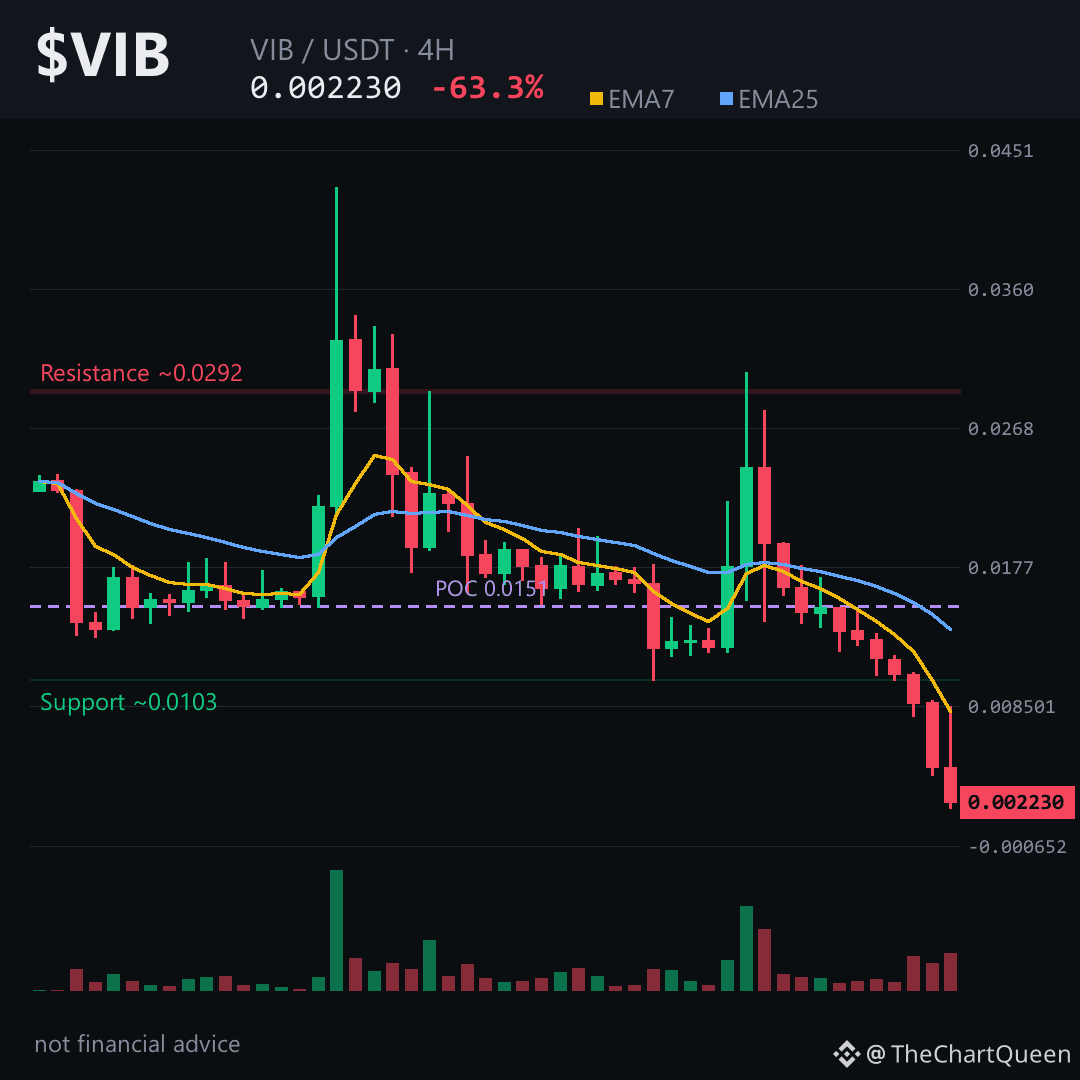
-63.26% in 24 hours.
That’s not a dip. That’s a structural collapse. And the chart has one more secret it hasn’t told you yet.
The 4H is brutal: eleven red candles out of twelve, the last two slicing price nearly in half each. RSI is buried at 28 — oversold, yes, but in a market this broken, oversold can stay oversold for days. EMA structure is inverted across every timeframe. Momentum isn’t just weak; it’s accelerating downward.
An unfilled bearish gap sits between 0.0102 and 0.0089 — price blew through so fast it never paused to fill it. That vacuum confirms how fast sellers overwhelmed buyers.
On the daily, $VIB is pinned near 0.00227, with only the psychological floor at 0.0019 holding it up. If that zone breaks on a daily close, the next meaningful support doesn’t arrive until 0.00141. That’s the level I’m watching most closely. The invalidation for this bearish view sits near 0.00246 — a daily close back above that and this breakdown thesis loses its teeth.
My read: this is a falling knife with no hands catching it yet. Volume is thin, sentiment is absent, weekly RSI at 23 — deep capitulation. That can mean a bounce is near, but not a bottom. The risk isn’t missing the reversal; it’s catching a bounce with no follow-through. Tap $VIB to see how cleanly this breakdown has unfolded.
I’ll keep tracking whether the 0.0019 floor holds or cracks — follow along for the update when that test comes.
Which level do you trust more on $VIB — the 0.0019 floor or the 0.00246 ceiling? 👇
⚠️ Not financial advice. DYOR.
#VIB #Altcoins #Crypto #BinanceSquare
-63.26% in 24 hours.
That’s not a dip. That’s a structural collapse. And the chart has one more secret it hasn’t told you yet.
The 4H is brutal: eleven red candles out of twelve, the last two slicing price nearly in half each. RSI is buried at 28 — oversold, yes, but in a market this broken, oversold can stay oversold for days. EMA structure is inverted across every timeframe. Momentum isn’t just weak; it’s accelerating downward.
An unfilled bearish gap sits between 0.0102 and 0.0089 — price blew through so fast it never paused to fill it. That vacuum confirms how fast sellers overwhelmed buyers.
On the daily, $VIB is pinned near 0.00227, with only the psychological floor at 0.0019 holding it up. If that zone breaks on a daily close, the next meaningful support doesn’t arrive until 0.00141. That’s the level I’m watching most closely. The invalidation for this bearish view sits near 0.00246 — a daily close back above that and this breakdown thesis loses its teeth.
My read: this is a falling knife with no hands catching it yet. Volume is thin, sentiment is absent, weekly RSI at 23 — deep capitulation. That can mean a bounce is near, but not a bottom. The risk isn’t missing the reversal; it’s catching a bounce with no follow-through. Tap $VIB to see how cleanly this breakdown has unfolded.
I’ll keep tracking whether the 0.0019 floor holds or cracks — follow along for the update when that test comes.
Which level do you trust more on $VIB — the 0.0019 floor or the 0.00246 ceiling? 👇
⚠️ Not financial advice. DYOR.
#VIB #Altcoins #Crypto #BinanceSquare
That’s not a dip. That’s a structural collapse. And the chart has one more secret it hasn’t told you yet.
The 4H is brutal: eleven red candles out of twelve, the last two slicing price nearly in half each. RSI is buried at 28 — oversold, yes, but in a market this broken, oversold can stay oversold for days. EMA structure is inverted across every timeframe. Momentum isn’t just weak; it’s accelerating downward.
An unfilled bearish gap sits between 0.0102 and 0.0089 — price blew through so fast it never paused to fill it. That vacuum confirms how fast sellers overwhelmed buyers.
On the daily, $VIB is pinned near 0.00227, with only the psychological floor at 0.0019 holding it up. If that zone breaks on a daily close, the next meaningful support doesn’t arrive until 0.00141. That’s the level I’m watching most closely. The invalidation for this bearish view sits near 0.00246 — a daily close back above that and this breakdown thesis loses its teeth.
My read: this is a falling knife with no hands catching it yet. Volume is thin, sentiment is absent, weekly RSI at 23 — deep capitulation. That can mean a bounce is near, but not a bottom. The risk isn’t missing the reversal; it’s catching a bounce with no follow-through. Tap $VIB to see how cleanly this breakdown has unfolded.
I’ll keep tracking whether the 0.0019 floor holds or cracks — follow along for the update when that test comes.
Which level do you trust more on $VIB — the 0.0019 floor or the 0.00246 ceiling? 👇
⚠️ Not financial advice. DYOR.
#VIB #Altcoins #Crypto #BinanceSquare
49
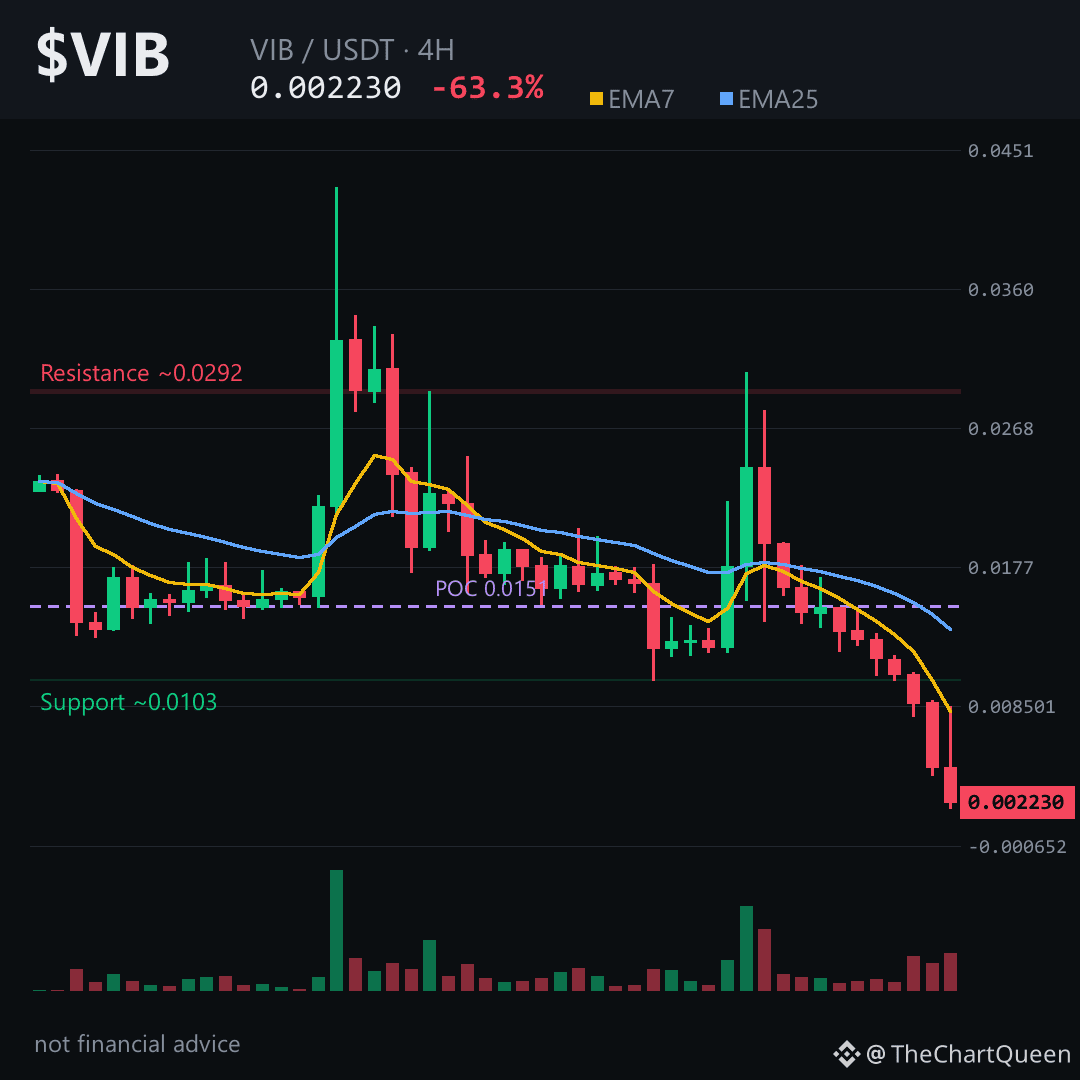
Everyone sees a -63% day and thinks the bottom is in.
Flip it: the last two 4H candles fell 49% and 50% — this is a falling knife, not a floor.
$VIB isn't just correcting. It's vaporizing.
That 24H range of nearly 289% says it all — price swung from 0.007 to 0.0018. Support isn't support; it's a suggestion.
RSI near 28 on the 4H isn't "cheap" — it's sellers still in control. EMAs stacked bearish, every bounce sold.
The level I'm watching: the bearish gap at 0.0089–0.0102. Price left it behind during the -49% candle. Gaps like that act as a magnet on relief bounces — trapped buyers trying to escape.
But price is near 0.0022. That gap is miles above. If it gets there, it's not recovery — it's liquidation of hope.
Daily is uglier: weekly RSI near 23, price below every major EMA. Structural decline, not a dip.
If $VIB loses 0.0018 — the 24H low — next real support is 0.0014.
Tap $VIB and look at the 4H. Red candles aren't slowing down.
The real risk isn't missing a bounce. It's catching one that never comes.
Follow me — I'll update if that gap zone gets revisited. That's where the next big decision happens.
What level are you watching on VIB right now? 👇
⚠️ Not financial advice. DYOR.
#VIB #Crypto #BinanceSquare
Everyone sees a -63% day and thinks the bottom is in.
Flip it: the last two 4H candles fell 49% and 50% — this is a falling knife, not a floor.
$VIB isn't just correcting. It's vaporizing.
That 24H range of nearly 289% says it all — price swung from 0.007 to 0.0018. Support isn't support; it's a suggestion.
RSI near 28 on the 4H isn't "cheap" — it's sellers still in control. EMAs stacked bearish, every bounce sold.
The level I'm watching: the bearish gap at 0.0089–0.0102. Price left it behind during the -49% candle. Gaps like that act as a magnet on relief bounces — trapped buyers trying to escape.
But price is near 0.0022. That gap is miles above. If it gets there, it's not recovery — it's liquidation of hope.
Daily is uglier: weekly RSI near 23, price below every major EMA. Structural decline, not a dip.
If $VIB loses 0.0018 — the 24H low — next real support is 0.0014.
Tap $VIB and look at the 4H. Red candles aren't slowing down.
The real risk isn't missing a bounce. It's catching one that never comes.
Follow me — I'll update if that gap zone gets revisited. That's where the next big decision happens.
What level are you watching on VIB right now? 👇
⚠️ Not financial advice. DYOR.
#VIB #Crypto #BinanceSquare
Flip it: the last two 4H candles fell 49% and 50% — this is a falling knife, not a floor.
$VIB isn't just correcting. It's vaporizing.
That 24H range of nearly 289% says it all — price swung from 0.007 to 0.0018. Support isn't support; it's a suggestion.
RSI near 28 on the 4H isn't "cheap" — it's sellers still in control. EMAs stacked bearish, every bounce sold.
The level I'm watching: the bearish gap at 0.0089–0.0102. Price left it behind during the -49% candle. Gaps like that act as a magnet on relief bounces — trapped buyers trying to escape.
But price is near 0.0022. That gap is miles above. If it gets there, it's not recovery — it's liquidation of hope.
Daily is uglier: weekly RSI near 23, price below every major EMA. Structural decline, not a dip.
If $VIB loses 0.0018 — the 24H low — next real support is 0.0014.
Tap $VIB and look at the 4H. Red candles aren't slowing down.
The real risk isn't missing a bounce. It's catching one that never comes.
Follow me — I'll update if that gap zone gets revisited. That's where the next big decision happens.
What level are you watching on VIB right now? 👇
⚠️ Not financial advice. DYOR.
#VIB #Crypto #BinanceSquare
4
·
--
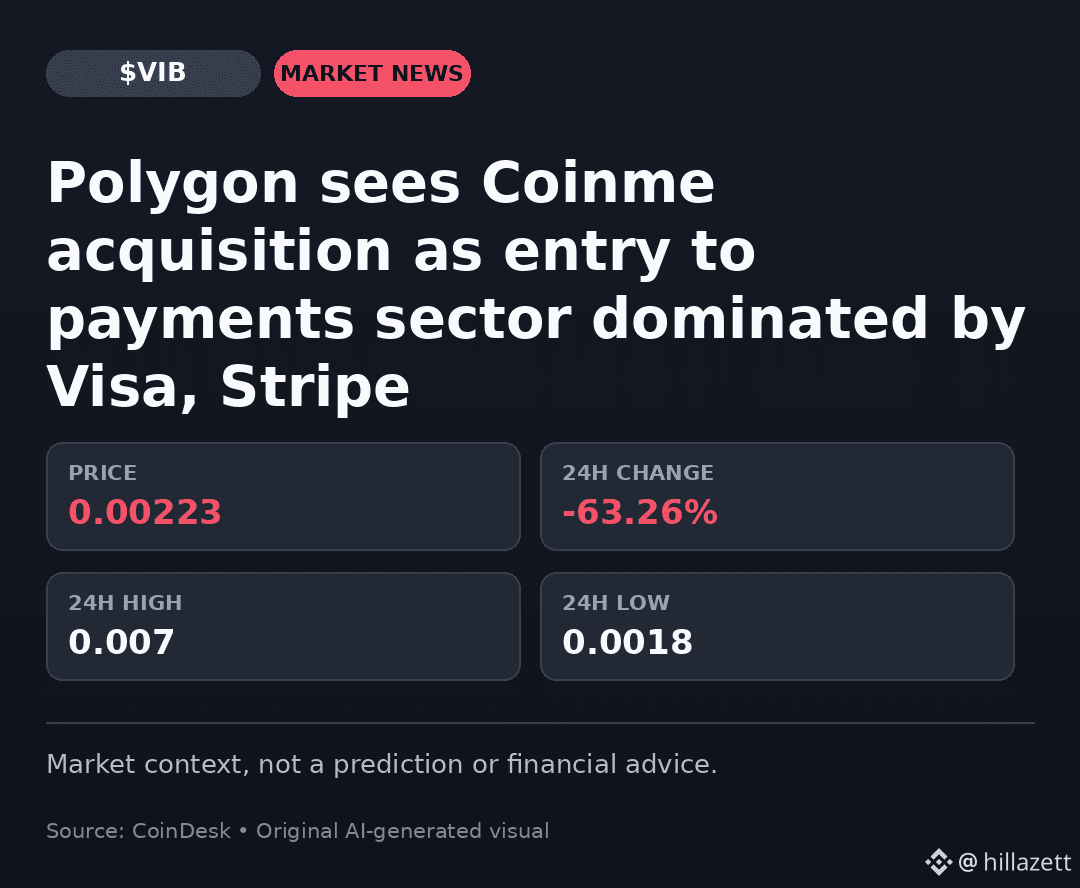
While major networks like Polygon target traditional payment giants, altcoin liquidity is telling a much harsher story today.
$VIB dropped 63.26% to 0.00223, swinging across a 233.18% spread between 0.007 and 0.0018 on $380,612 in volume.
Long-term adoption battles mainstream rails, but intraday volatility shows no mercy. Are you sitting back or looking for entries? #Macro #VIB
While major networks like Polygon target traditional payment giants, altcoin liquidity is telling a much harsher story today.
$VIB dropped 63.26% to 0.00223, swinging across a 233.18% spread between 0.007 and 0.0018 on $380,612 in volume.
Long-term adoption battles mainstream rails, but intraday volatility shows no mercy. Are you sitting back or looking for entries? #Macro #VIB
$VIB dropped 63.26% to 0.00223, swinging across a 233.18% spread between 0.007 and 0.0018 on $380,612 in volume.
Long-term adoption battles mainstream rails, but intraday volatility shows no mercy. Are you sitting back or looking for entries? #Macro #VIB
38
What just happened to VIB?
24 hours ago it was trading around 0.024. Now it's at 0.0022. That's a 90% wipe in a single day.
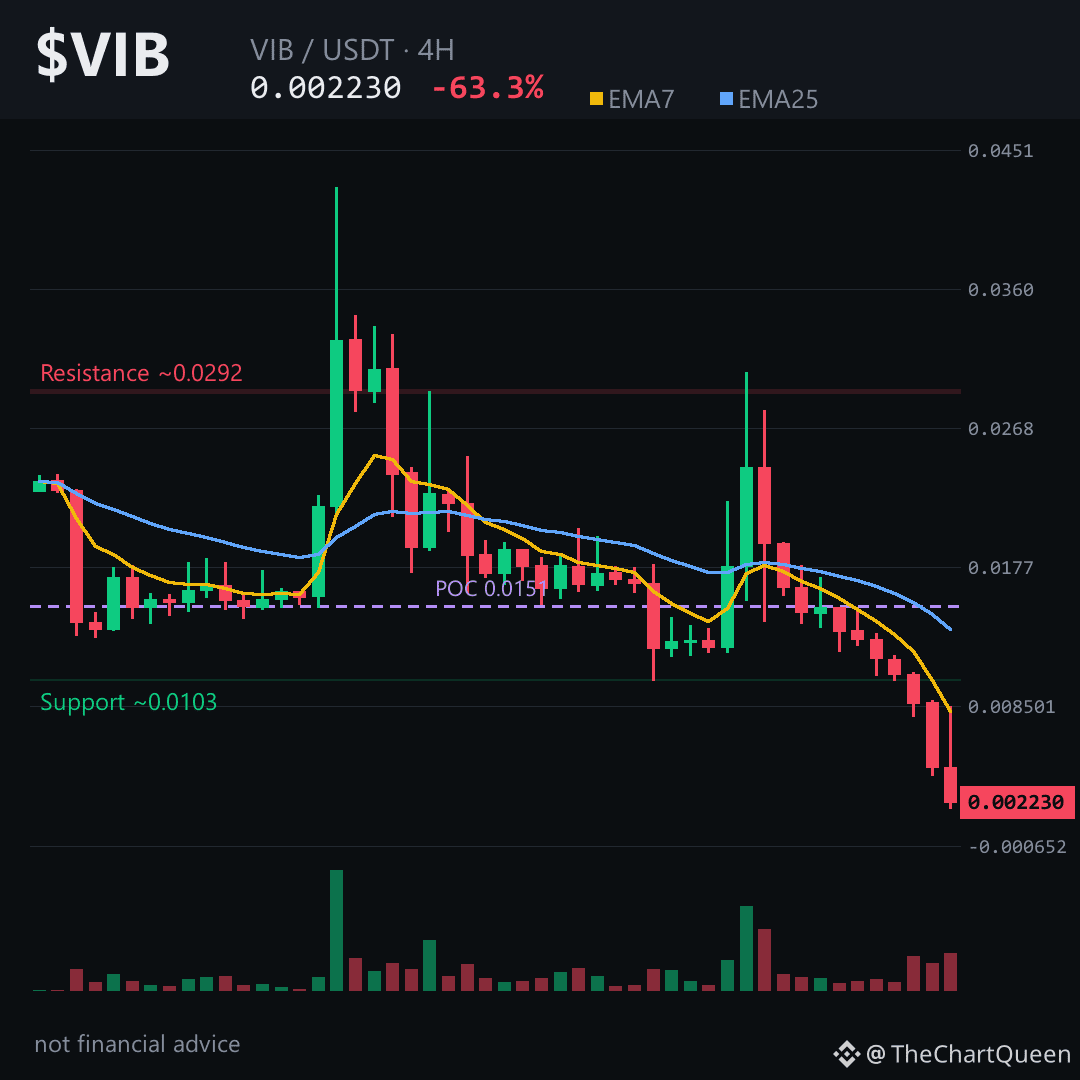
Here's the part nobody's talking about: there's an unfilled gap sitting right above the current price.
An FVG happens when price moves so violently that it leaves a zone where almost no trading took place. Price often drifts back to "fill" that hole before deciding its next move.
For $VIB, that hole sits between roughly 0.0089 and 0.0102.
But here's the trap.
The 4H chart is still bleeding. RSI is at 28 — deeply oversold, but oversold can stay oversold in a downtrend. EMAs are stacked bearish. That's not a reversal structure. That's a falling knife.
The level that matters most right now is the current pivot zone near 0.0022.
If price holds that area and starts building higher lows, a bounce toward the gap becomes realistic — and that gap fill would be violent.
But if 0.0022 fails on a 4H close, the next objective sits around 0.0020, and after that it's open air.
My read: the chart is still in a downtrend. The real risk isn't missing a bounce — it's catching a knife before any base has formed. The gap is a magnet, not a guarantee.
Tap $VIB to pull up the chart and see that gap for yourself.
I'll keep tracking this one as the structure develops — follow so you don't miss the next read.
What level are you watching on $VIB right now? 👇
⚠️ Not financial advice. DYOR.
#VIB #Viberate #Crypto #BinanceSquare
What just happened to VIB?
24 hours ago it was trading around 0.024. Now it's at 0.0022. That's a 90% wipe in a single day.
Here's the part nobody's talking about: there's an unfilled gap sitting right above the current price.
An FVG happens when price moves so violently that it leaves a zone where almost no trading took place. Price often drifts back to "fill" that hole before deciding its next move.
For $VIB, that hole sits between roughly 0.0089 and 0.0102.
But here's the trap.
The 4H chart is still bleeding. RSI is at 28 — deeply oversold, but oversold can stay oversold in a downtrend. EMAs are stacked bearish. That's not a reversal structure. That's a falling knife.
The level that matters most right now is the current pivot zone near 0.0022.
If price holds that area and starts building higher lows, a bounce toward the gap becomes realistic — and that gap fill would be violent.
But if 0.0022 fails on a 4H close, the next objective sits around 0.0020, and after that it's open air.
My read: the chart is still in a downtrend. The real risk isn't missing a bounce — it's catching a knife before any base has formed. The gap is a magnet, not a guarantee.
Tap $VIB to pull up the chart and see that gap for yourself.
I'll keep tracking this one as the structure develops — follow so you don't miss the next read.
What level are you watching on $VIB right now? 👇
⚠️ Not financial advice. DYOR.
#VIB #Viberate #Crypto #BinanceSquare
24 hours ago it was trading around 0.024. Now it's at 0.0022. That's a 90% wipe in a single day.
Here's the part nobody's talking about: there's an unfilled gap sitting right above the current price.
An FVG happens when price moves so violently that it leaves a zone where almost no trading took place. Price often drifts back to "fill" that hole before deciding its next move.
For $VIB, that hole sits between roughly 0.0089 and 0.0102.
But here's the trap.
The 4H chart is still bleeding. RSI is at 28 — deeply oversold, but oversold can stay oversold in a downtrend. EMAs are stacked bearish. That's not a reversal structure. That's a falling knife.
The level that matters most right now is the current pivot zone near 0.0022.
If price holds that area and starts building higher lows, a bounce toward the gap becomes realistic — and that gap fill would be violent.
But if 0.0022 fails on a 4H close, the next objective sits around 0.0020, and after that it's open air.
My read: the chart is still in a downtrend. The real risk isn't missing a bounce — it's catching a knife before any base has formed. The gap is a magnet, not a guarantee.
Tap $VIB to pull up the chart and see that gap for yourself.
I'll keep tracking this one as the structure develops — follow so you don't miss the next read.
What level are you watching on $VIB right now? 👇
⚠️ Not financial advice. DYOR.
#VIB #Viberate #Crypto #BinanceSquare
15
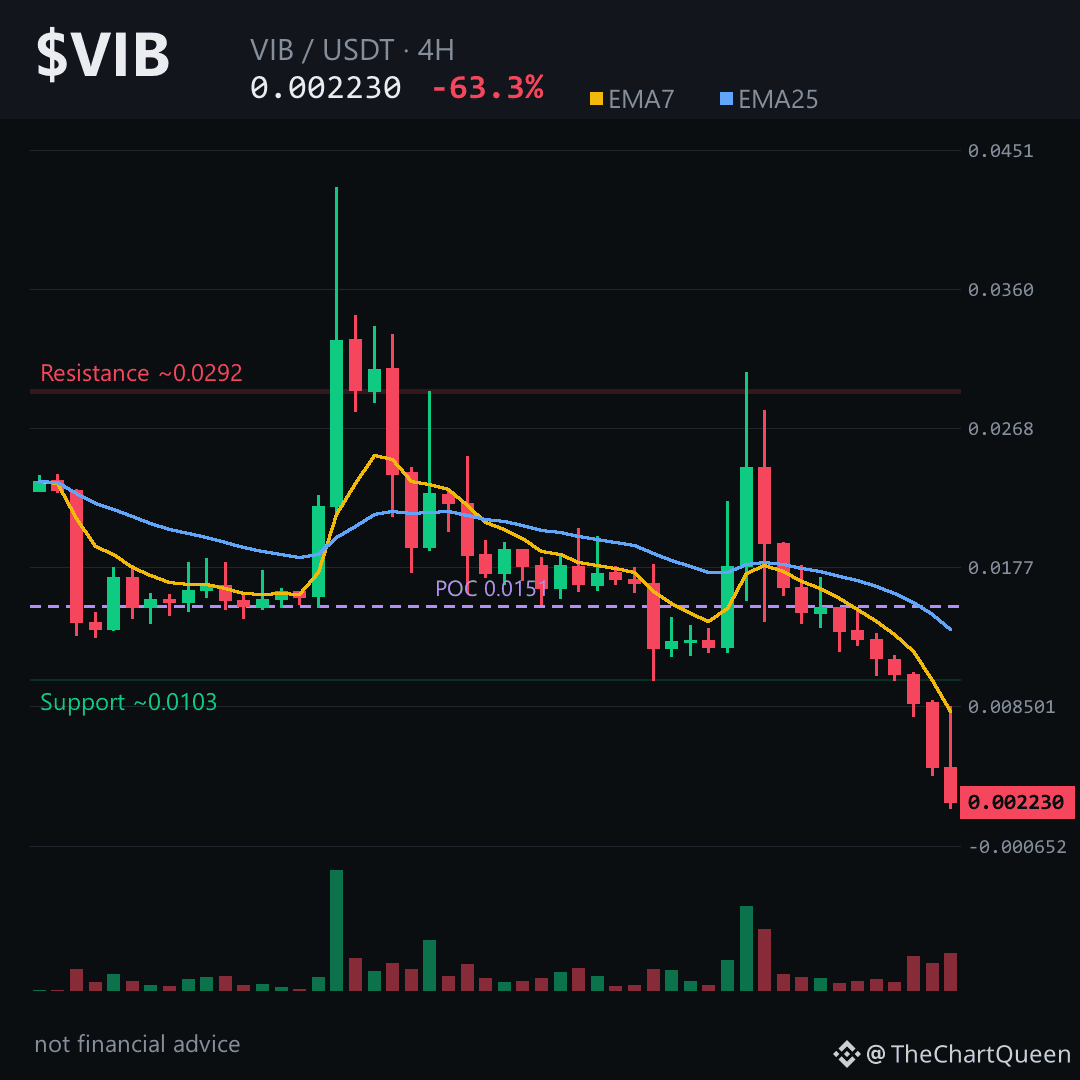
A 63% single-day collapse isn’t a dip. It’s a liquidation event wearing a ticker symbol. And the ugliest part? The 4H chart shows a gaping, unfilled void between 0.01023 and 0.00890 — price fell straight through it in one candle, and it hasn’t even looked back.
RSI on the 4H is buried at 28.62, deeply oversold but still pointing lower. EMA7 at 0.00821 vs EMA25 at 0.01341 — that spread tells you momentum isn’t just bearish, it’s broken. And those -49% and -50.55% candles? Not normal selling. Forced distribution.
Here’s what I’m watching on $VIB.
Current price is hovering around 0.00224. If this bleed continues, the only logical objective is the 0.00204 area — just below the recent low of 0.00180, which already got wicked and rejected. That low is the line. Lose it, and there’s no historical support until 0.00141.
The invalidation is tight. If price reclaims the 0.00235 zone on a 4H close, this read is off the table. But until then, every bounce is being sold into that unfilled gap overhead.
My read: this is a falling knife with zero futures liquidity — no open interest, flat funding. Nobody’s paying to short; they’re just dumping spot and walking away. The real risk isn’t missing a bounce. It’s catching one that never comes.
Tap $VIB to pull up the chart and see that gap for yourself.
Follow me for the follow-up when this level either holds or gives way — I’ll be watching the 0.00204 area closely.
What’s your read on the gap overhead — do you think $VIB fills it this week, or keeps bleeding first? 👇
⚠️ Not financial advice. DYOR.
#VIB #Crypto #BinanceSquare #Altcoins
A 63% single-day collapse isn’t a dip. It’s a liquidation event wearing a ticker symbol. And the ugliest part? The 4H chart shows a gaping, unfilled void between 0.01023 and 0.00890 — price fell straight through it in one candle, and it hasn’t even looked back.
RSI on the 4H is buried at 28.62, deeply oversold but still pointing lower. EMA7 at 0.00821 vs EMA25 at 0.01341 — that spread tells you momentum isn’t just bearish, it’s broken. And those -49% and -50.55% candles? Not normal selling. Forced distribution.
Here’s what I’m watching on $VIB.
Current price is hovering around 0.00224. If this bleed continues, the only logical objective is the 0.00204 area — just below the recent low of 0.00180, which already got wicked and rejected. That low is the line. Lose it, and there’s no historical support until 0.00141.
The invalidation is tight. If price reclaims the 0.00235 zone on a 4H close, this read is off the table. But until then, every bounce is being sold into that unfilled gap overhead.
My read: this is a falling knife with zero futures liquidity — no open interest, flat funding. Nobody’s paying to short; they’re just dumping spot and walking away. The real risk isn’t missing a bounce. It’s catching one that never comes.
Tap $VIB to pull up the chart and see that gap for yourself.
Follow me for the follow-up when this level either holds or gives way — I’ll be watching the 0.00204 area closely.
What’s your read on the gap overhead — do you think $VIB fills it this week, or keeps bleeding first? 👇
⚠️ Not financial advice. DYOR.
#VIB #Crypto #BinanceSquare #Altcoins
RSI on the 4H is buried at 28.62, deeply oversold but still pointing lower. EMA7 at 0.00821 vs EMA25 at 0.01341 — that spread tells you momentum isn’t just bearish, it’s broken. And those -49% and -50.55% candles? Not normal selling. Forced distribution.
Here’s what I’m watching on $VIB.
Current price is hovering around 0.00224. If this bleed continues, the only logical objective is the 0.00204 area — just below the recent low of 0.00180, which already got wicked and rejected. That low is the line. Lose it, and there’s no historical support until 0.00141.
The invalidation is tight. If price reclaims the 0.00235 zone on a 4H close, this read is off the table. But until then, every bounce is being sold into that unfilled gap overhead.
My read: this is a falling knife with zero futures liquidity — no open interest, flat funding. Nobody’s paying to short; they’re just dumping spot and walking away. The real risk isn’t missing a bounce. It’s catching one that never comes.
Tap $VIB to pull up the chart and see that gap for yourself.
Follow me for the follow-up when this level either holds or gives way — I’ll be watching the 0.00204 area closely.
What’s your read on the gap overhead — do you think $VIB fills it this week, or keeps bleeding first? 👇
⚠️ Not financial advice. DYOR.
#VIB #Crypto #BinanceSquare #Altcoins
10
-63.26% in 24 hours. That is not a correction — that is a structural break.
The 4H candles tell the real story: eleven straight closes below the prior open, the last two printing 49% and 50% range collapses. Volume is thin at 380K USDT, meaning there is no real bid absorbing the fall. Price is simply discovering lower.
That unfilled gap between roughly 0.0102 and 0.0089 now sits far above — a void where no one traded, and gravity pulls back toward it only after exhaustion. Right now, the 4H trend is too broken to fade. The 7-period average is sloping hard against price, and momentum has not even attempted a reclaim of the 0.00235 area.
My levels on $VIB: the current zone near 0.00224 is just a ledge, not a floor. A 4H close back above 0.00235 would be the first sign the bleed is pausing. Until then, the path of least resistance points toward the 0.00204 area, and if that fails, the macro picture has no meaningful support until near 0.0014.
My read: this is a falling knife with no cushion. The only thing that changes that is a decisive reclaim of 0.00235 — until then, the down-move is unopposed.
If this level breaks or holds, I’ll map what comes next — follow along and tap $VIB to check the chart yourself.
What level are you watching on $VIB? 👇
#VIB #Crypto #BinanceSquare
⚠️ Not financial advice. DYOR.
-63.26% in 24 hours. That is not a correction — that is a structural break.
The 4H candles tell the real story: eleven straight closes below the prior open, the last two printing 49% and 50% range collapses. Volume is thin at 380K USDT, meaning there is no real bid absorbing the fall. Price is simply discovering lower.
That unfilled gap between roughly 0.0102 and 0.0089 now sits far above — a void where no one traded, and gravity pulls back toward it only after exhaustion. Right now, the 4H trend is too broken to fade. The 7-period average is sloping hard against price, and momentum has not even attempted a reclaim of the 0.00235 area.
My levels on $VIB: the current zone near 0.00224 is just a ledge, not a floor. A 4H close back above 0.00235 would be the first sign the bleed is pausing. Until then, the path of least resistance points toward the 0.00204 area, and if that fails, the macro picture has no meaningful support until near 0.0014.
My read: this is a falling knife with no cushion. The only thing that changes that is a decisive reclaim of 0.00235 — until then, the down-move is unopposed.
If this level breaks or holds, I’ll map what comes next — follow along and tap $VIB to check the chart yourself.
What level are you watching on $VIB? 👇
#VIB #Crypto #BinanceSquare
⚠️ Not financial advice. DYOR.
The 4H candles tell the real story: eleven straight closes below the prior open, the last two printing 49% and 50% range collapses. Volume is thin at 380K USDT, meaning there is no real bid absorbing the fall. Price is simply discovering lower.
That unfilled gap between roughly 0.0102 and 0.0089 now sits far above — a void where no one traded, and gravity pulls back toward it only after exhaustion. Right now, the 4H trend is too broken to fade. The 7-period average is sloping hard against price, and momentum has not even attempted a reclaim of the 0.00235 area.
My levels on $VIB: the current zone near 0.00224 is just a ledge, not a floor. A 4H close back above 0.00235 would be the first sign the bleed is pausing. Until then, the path of least resistance points toward the 0.00204 area, and if that fails, the macro picture has no meaningful support until near 0.0014.
My read: this is a falling knife with no cushion. The only thing that changes that is a decisive reclaim of 0.00235 — until then, the down-move is unopposed.
If this level breaks or holds, I’ll map what comes next — follow along and tap $VIB to check the chart yourself.
What level are you watching on $VIB? 👇
#VIB #Crypto #BinanceSquare
⚠️ Not financial advice. DYOR.
8
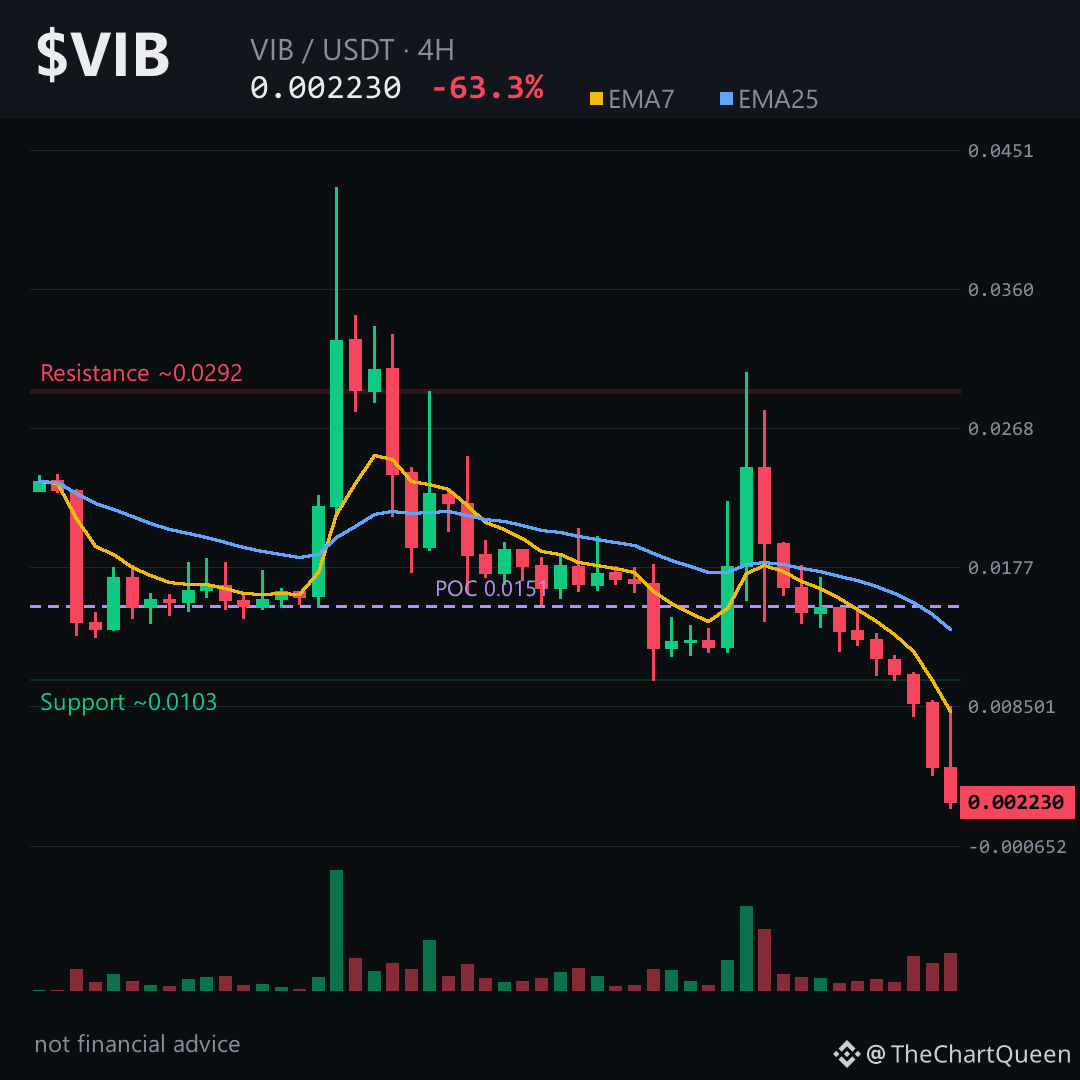
Everyone sees a -63% daily candle and thinks the bottom is in.
Flip it — that -63% is the *story*, not the setup.
The real read: $VIB printed a 289% daily range, and the 4H structure shows eleven red candles against just two green. That’s not capitulation. That’s distribution with no relief.
RSI on the 4H is buried near 28, but here’s the trap — an oversold RSI in a 49% down-candle tape often stays oversold. The 4H EMA7 is still less than half the EMA25, and price keeps closing below the old support zone near 0.0102 that everyone anchored to. That level is now overhead supply, and the unfilled bearish gap above it acts like a lid.
The cleanest read is the 4H: if $VIB can’t reclaim the 0.00235 area, the path of least resistance stays lower. The objective sits around 0.00204, with a deeper liquidity pocket near the 0.0018 low from the last 48 hours. Lose that and the macro weekly objective near 0.0014 becomes the conversation.
My read: this isn’t a falling knife to catch yet — it’s a falling knife still falling. The invalidation is simple: a 4H close back above 0.00235 and the bearish read is off. Tap $VIB to pull up the chart and read those levels yourself.
Follow for the update when this level either holds or gives way. Which zone are you watching more closely — 0.00235 or 0.0018? 👇
⚠️ Not financial advice. DYOR.
#VIB #Crypto #BinanceSquare
Everyone sees a -63% daily candle and thinks the bottom is in.
Flip it — that -63% is the *story*, not the setup.
The real read: $VIB printed a 289% daily range, and the 4H structure shows eleven red candles against just two green. That’s not capitulation. That’s distribution with no relief.
RSI on the 4H is buried near 28, but here’s the trap — an oversold RSI in a 49% down-candle tape often stays oversold. The 4H EMA7 is still less than half the EMA25, and price keeps closing below the old support zone near 0.0102 that everyone anchored to. That level is now overhead supply, and the unfilled bearish gap above it acts like a lid.
The cleanest read is the 4H: if $VIB can’t reclaim the 0.00235 area, the path of least resistance stays lower. The objective sits around 0.00204, with a deeper liquidity pocket near the 0.0018 low from the last 48 hours. Lose that and the macro weekly objective near 0.0014 becomes the conversation.
My read: this isn’t a falling knife to catch yet — it’s a falling knife still falling. The invalidation is simple: a 4H close back above 0.00235 and the bearish read is off. Tap $VIB to pull up the chart and read those levels yourself.
Follow for the update when this level either holds or gives way. Which zone are you watching more closely — 0.00235 or 0.0018? 👇
⚠️ Not financial advice. DYOR.
#VIB #Crypto #BinanceSquare
Flip it — that -63% is the *story*, not the setup.
The real read: $VIB printed a 289% daily range, and the 4H structure shows eleven red candles against just two green. That’s not capitulation. That’s distribution with no relief.
RSI on the 4H is buried near 28, but here’s the trap — an oversold RSI in a 49% down-candle tape often stays oversold. The 4H EMA7 is still less than half the EMA25, and price keeps closing below the old support zone near 0.0102 that everyone anchored to. That level is now overhead supply, and the unfilled bearish gap above it acts like a lid.
The cleanest read is the 4H: if $VIB can’t reclaim the 0.00235 area, the path of least resistance stays lower. The objective sits around 0.00204, with a deeper liquidity pocket near the 0.0018 low from the last 48 hours. Lose that and the macro weekly objective near 0.0014 becomes the conversation.
My read: this isn’t a falling knife to catch yet — it’s a falling knife still falling. The invalidation is simple: a 4H close back above 0.00235 and the bearish read is off. Tap $VIB to pull up the chart and read those levels yourself.
Follow for the update when this level either holds or gives way. Which zone are you watching more closely — 0.00235 or 0.0018? 👇
⚠️ Not financial advice. DYOR.
#VIB #Crypto #BinanceSquare
12

·
--
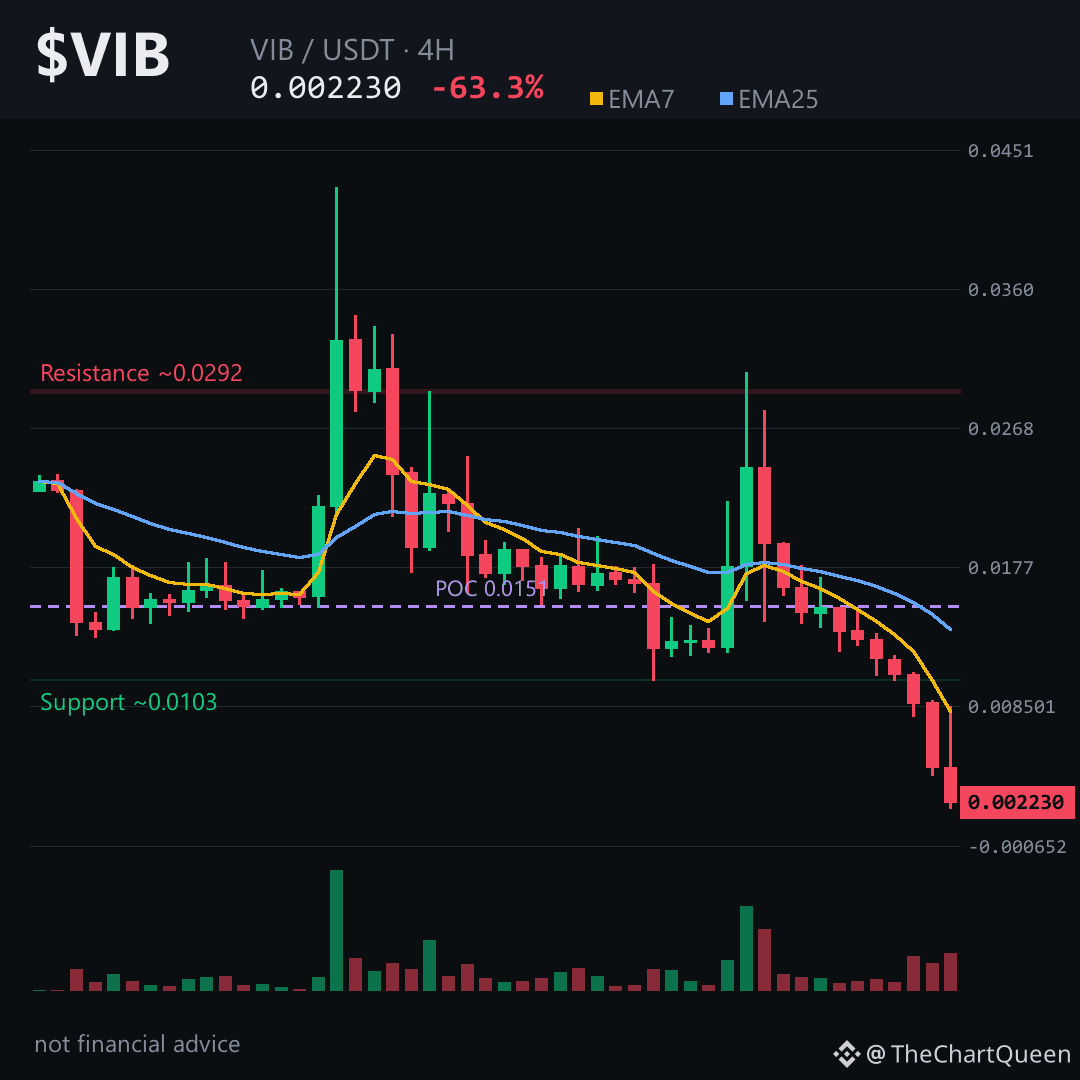
Looking at the current VIB chart, I see a scenario not for the faint-hearted. With a drop of over 63% in the last 24 hours, this is a massive sell-off that's completely shattered the market structure.
Trend assessment:
On both the 15m and 1h timeframes, the current price of 0.0022$ is well below the MA20 and EMA9 lines. Specifically, on the 1h chart, the MA20 is at 0.0090$ and the EMA9 is at 0.0060$, indicating an extremely bearish trend. The gap between the current price and the moving averages shows that selling pressure is still dominating, with no signs of balance or accumulation appearing yet.
Support and resistance:
Currently, VIB has fallen below traditional technical support zones. The range of 0.0050$ - 0.0060$ has now turned into strong resistance in the short term. Any bounce back towards this range will face significant sell pressure from those who are stuck holding higher positions. No solid support has been clearly established, so the risk of free fall still looms.
Trading plan:
For the LONG side: This is not the time to catch a falling knife. The wave structure is head-down, trying to LONG right now is like standing in front of a freight train. Wait for an accumulation pattern or a double bottom on the 1h timeframe before considering.
For the SHORT side: The opportunity for a SHORT position has passed at higher price levels. At 0.0022$, the risk of hitting a technical bounce (short squeeze) is very high. It's best to stand back and observe (wait and see) or look for a SHORT entry when the price retraces to test the EMA9 resistance (0.0060$) and fails.
In summary, the market is in a state of panic. Don't try to call the bottom when the downward momentum hasn't stopped yet.
$VIB #VIB #crypto #trading #priceaction #ptkt
Note: This is a personal opinion, not investment advice. Please be cautious with your trades (dyor).
Looking at the current VIB chart, I see a scenario not for the faint-hearted. With a drop of over 63% in the last 24 hours, this is a massive sell-off that's completely shattered the market structure.
Trend assessment:
On both the 15m and 1h timeframes, the current price of 0.0022$ is well below the MA20 and EMA9 lines. Specifically, on the 1h chart, the MA20 is at 0.0090$ and the EMA9 is at 0.0060$, indicating an extremely bearish trend. The gap between the current price and the moving averages shows that selling pressure is still dominating, with no signs of balance or accumulation appearing yet.
Support and resistance:
Currently, VIB has fallen below traditional technical support zones. The range of 0.0050$ - 0.0060$ has now turned into strong resistance in the short term. Any bounce back towards this range will face significant sell pressure from those who are stuck holding higher positions. No solid support has been clearly established, so the risk of free fall still looms.
Trading plan:
For the LONG side: This is not the time to catch a falling knife. The wave structure is head-down, trying to LONG right now is like standing in front of a freight train. Wait for an accumulation pattern or a double bottom on the 1h timeframe before considering.
For the SHORT side: The opportunity for a SHORT position has passed at higher price levels. At 0.0022$, the risk of hitting a technical bounce (short squeeze) is very high. It's best to stand back and observe (wait and see) or look for a SHORT entry when the price retraces to test the EMA9 resistance (0.0060$) and fails.
In summary, the market is in a state of panic. Don't try to call the bottom when the downward momentum hasn't stopped yet.
$VIB #VIB #crypto #trading #priceaction #ptkt
Note: This is a personal opinion, not investment advice. Please be cautious with your trades (dyor).
Trend assessment:
On both the 15m and 1h timeframes, the current price of 0.0022$ is well below the MA20 and EMA9 lines. Specifically, on the 1h chart, the MA20 is at 0.0090$ and the EMA9 is at 0.0060$, indicating an extremely bearish trend. The gap between the current price and the moving averages shows that selling pressure is still dominating, with no signs of balance or accumulation appearing yet.
Support and resistance:
Currently, VIB has fallen below traditional technical support zones. The range of 0.0050$ - 0.0060$ has now turned into strong resistance in the short term. Any bounce back towards this range will face significant sell pressure from those who are stuck holding higher positions. No solid support has been clearly established, so the risk of free fall still looms.
Trading plan:
For the LONG side: This is not the time to catch a falling knife. The wave structure is head-down, trying to LONG right now is like standing in front of a freight train. Wait for an accumulation pattern or a double bottom on the 1h timeframe before considering.
For the SHORT side: The opportunity for a SHORT position has passed at higher price levels. At 0.0022$, the risk of hitting a technical bounce (short squeeze) is very high. It's best to stand back and observe (wait and see) or look for a SHORT entry when the price retraces to test the EMA9 resistance (0.0060$) and fails.
In summary, the market is in a state of panic. Don't try to call the bottom when the downward momentum hasn't stopped yet.
$VIB #VIB #crypto #trading #priceaction #ptkt
Note: This is a personal opinion, not investment advice. Please be cautious with your trades (dyor).
1
🚨 Warning: $VIB is collapsing 📉. A hidden pattern is emerging... Full setup below 👇
$VIB's brutal 63% drop in 24h reveals a market in panic. Despite the chaos, a bearish trend is solidifying. The funding rate is 0%, indicating a lack of confidence, while the open interest is $0, showing a complete loss of conviction. The long/short ratio of 0 signals a total absence of bullish sentiment.
The window for this trade is closing fast. Here are the setups:
Scalp Setup (4H): Entry: $0.00226345 | SL: $0.00237662 | TP: $0.00209369 | Leverage: 10x Cross
Swing Setup (1D): Entry: $0.00231920 | SL: $0.00259750 | TP: $0.00176259 | Leverage: 10x Cross
Position Setup (3D): Entry: $0.00240840 | SL: $0.00284191 | TP: $0.00132462 | Leverage: 3x Cross
Macro Setup (1W/1M): Entry: $0.00256450 | SL: $0.00320563 | TP: $0.00128225 | Leverage: Spot (No Leverage)
I'm trading this setup. R:R is too good to ignore.
I've analyzed 150 charts overnight to bring you this insight. Support my caffeine addiction with a Binance Square Tip if this hits TP. FOLLOW and SAVE this post so you won't regret missing the pump. LONG or SHORT $VIB here? Let me know below! 👇
⚠️ Not financial advice. DYOR.
#VIB #Crypto #BinanceSquare
🚨 Warning: $VIB is collapsing 📉. A hidden pattern is emerging... Full setup below 👇
$VIB's brutal 63% drop in 24h reveals a market in panic. Despite the chaos, a bearish trend is solidifying. The funding rate is 0%, indicating a lack of confidence, while the open interest is $0, showing a complete loss of conviction. The long/short ratio of 0 signals a total absence of bullish sentiment.
The window for this trade is closing fast. Here are the setups:
Scalp Setup (4H): Entry: $0.00226345 | SL: $0.00237662 | TP: $0.00209369 | Leverage: 10x Cross
Swing Setup (1D): Entry: $0.00231920 | SL: $0.00259750 | TP: $0.00176259 | Leverage: 10x Cross
Position Setup (3D): Entry: $0.00240840 | SL: $0.00284191 | TP: $0.00132462 | Leverage: 3x Cross
Macro Setup (1W/1M): Entry: $0.00256450 | SL: $0.00320563 | TP: $0.00128225 | Leverage: Spot (No Leverage)
I'm trading this setup. R:R is too good to ignore.
I've analyzed 150 charts overnight to bring you this insight. Support my caffeine addiction with a Binance Square Tip if this hits TP. FOLLOW and SAVE this post so you won't regret missing the pump. LONG or SHORT $VIB here? Let me know below! 👇
⚠️ Not financial advice. DYOR.
#VIB #Crypto #BinanceSquare
$VIB's brutal 63% drop in 24h reveals a market in panic. Despite the chaos, a bearish trend is solidifying. The funding rate is 0%, indicating a lack of confidence, while the open interest is $0, showing a complete loss of conviction. The long/short ratio of 0 signals a total absence of bullish sentiment.
The window for this trade is closing fast. Here are the setups:
Scalp Setup (4H): Entry: $0.00226345 | SL: $0.00237662 | TP: $0.00209369 | Leverage: 10x Cross
Swing Setup (1D): Entry: $0.00231920 | SL: $0.00259750 | TP: $0.00176259 | Leverage: 10x Cross
Position Setup (3D): Entry: $0.00240840 | SL: $0.00284191 | TP: $0.00132462 | Leverage: 3x Cross
Macro Setup (1W/1M): Entry: $0.00256450 | SL: $0.00320563 | TP: $0.00128225 | Leverage: Spot (No Leverage)
I'm trading this setup. R:R is too good to ignore.
I've analyzed 150 charts overnight to bring you this insight. Support my caffeine addiction with a Binance Square Tip if this hits TP. FOLLOW and SAVE this post so you won't regret missing the pump. LONG or SHORT $VIB here? Let me know below! 👇
⚠️ Not financial advice. DYOR.
#VIB #Crypto #BinanceSquare
2
Log in to explore more content
Join global crypto users on Binance Square
⚡️ Get latest and useful information about crypto.
💬 Trusted by the world’s largest crypto exchange.
👍 Discover real insights from verified creators.
Email / Phone number
Trending Topics
1
#WhoWillSucceedJensenHuangatNvidia?
128,210 views
1,466 Discussing
2
#WhatWillDriveCryptoandStocks’NextRebound?
517,040 views
3,324 Discussing
3
#BitcoinActiveSupplyInProfitDropsBelow45%
54,054 views
598 Discussing
4
#KavaSaysAbnormalActivityLimitedToKavaLend
27,571 views
329 Discussing
5
#USSpotXRPETFsSeeLargestWeeklyOutflowIn8Months
21,112 views
284 Discussing
6
#USPPIMissMayEaseBTCPressure
260,097 views
2,183 Discussing
7
#WORPTLetsTouristsConvertCryptoToThaiBaht
7,565 views
79 Discussing
8
#TONStrategyReports$23.97MQ3NetLoss
8,017 views
41 Discussing
9
#PolkadotCommunityApprovesNewStrategyWith97%Vote
24,344 views
278 Discussing
10
#dYdXPlansV9.9UpgradeToShiftUSDCToInjective
19,805 views
231 Discussing