
#ltc
ltc
11.1M views
30,480 Discussing
Hot
Latest

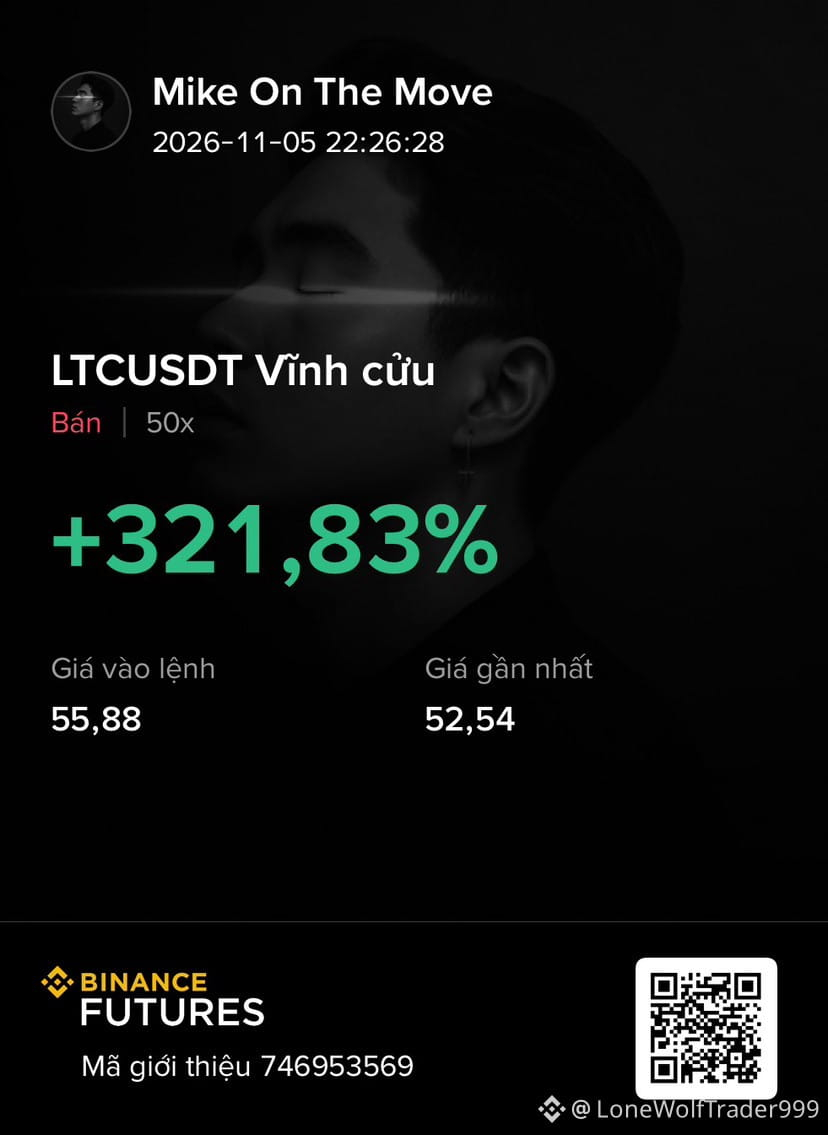
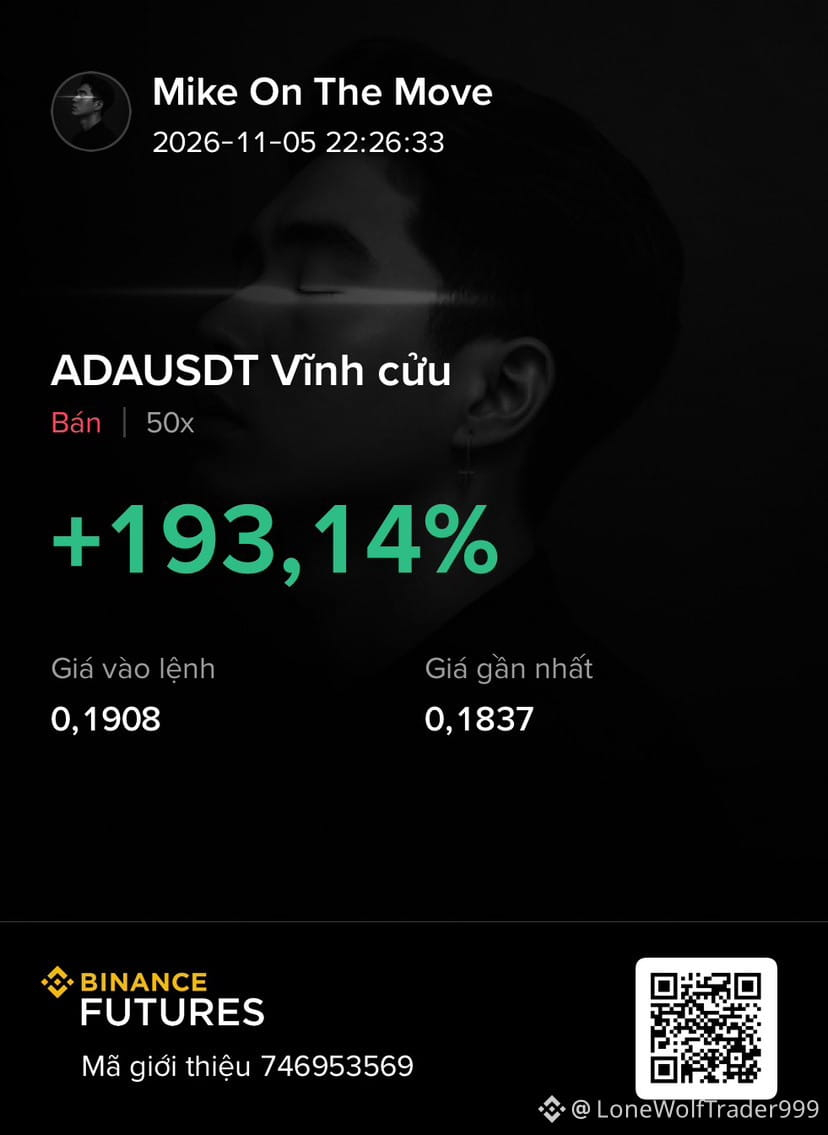
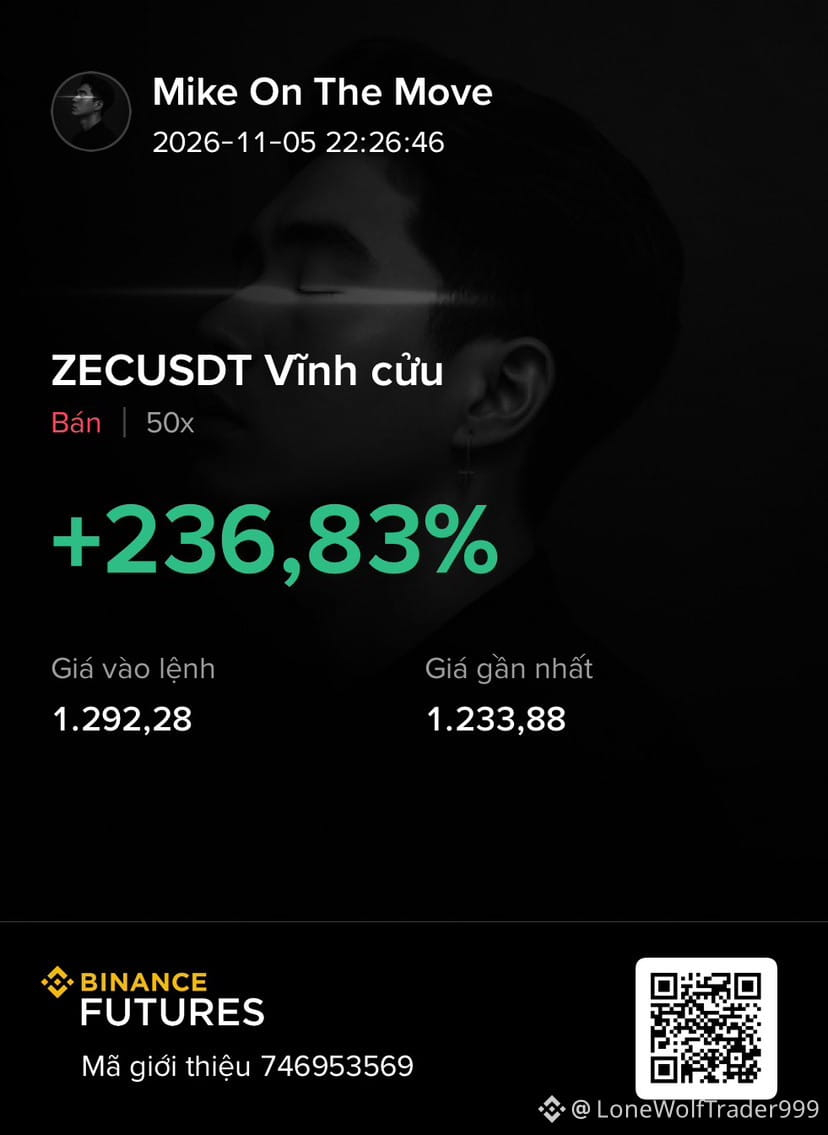
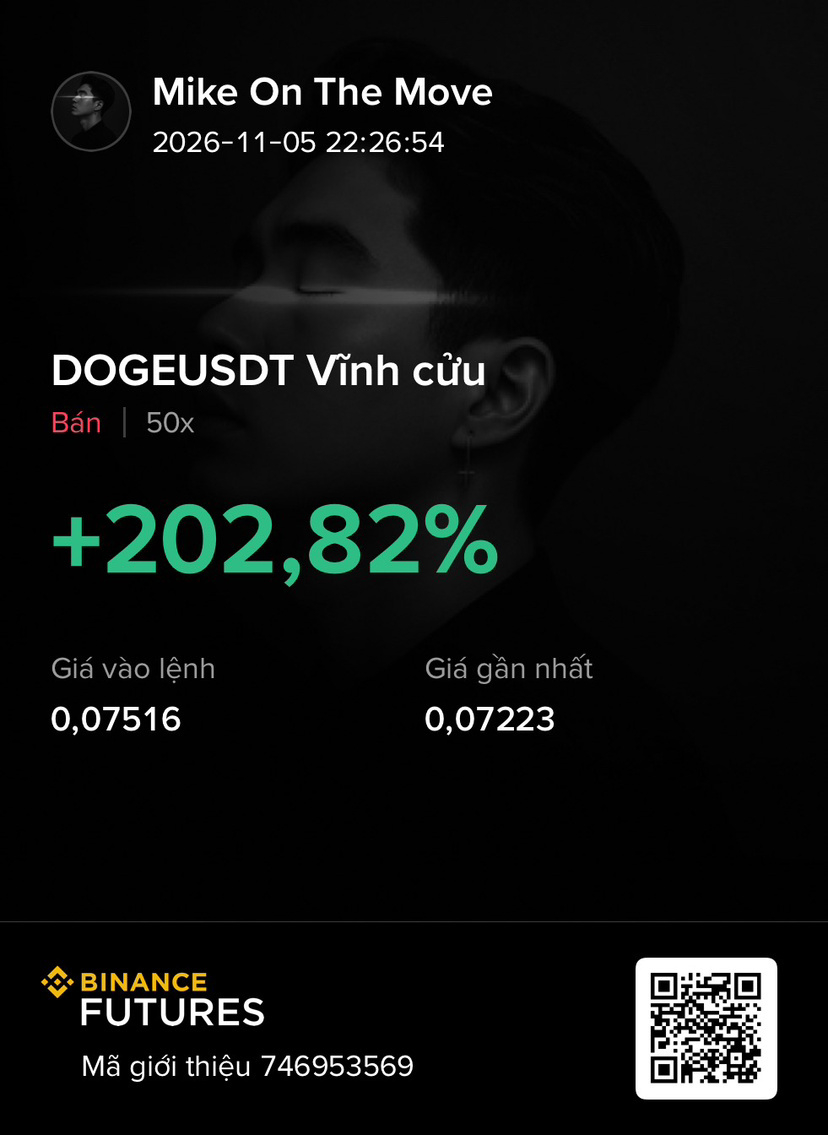
🚨 $LTC SLIDES DEEP INTO BEAR ZONE – SHORT CALLS ON FIRE! 🐻
Smart money 🦈 has been sweeping the order book, hammering $LTC below the 90‑day swing low while volume spikes 📊 confirm the sell‑off is more than a flash dip.
With the bears in control, the momentum ⚡ is primed for another leg down; lock in profits now and tighten your stop to guard against any sudden reversal. 💬 Are you ready to clip those short gains before the market catches a breath? 👇
⚠️ Not financial advice. Always manage your risk. 🛡️
🏷️ #LTC #ShortSetup #Bearish #Crypto
🔥 💎
🚨 $LTC SLIDES DEEP INTO BEAR ZONE – SHORT CALLS ON FIRE! 🐻
Smart money 🦈 has been sweeping the order book, hammering $LTC below the 90‑day swing low while volume spikes 📊 confirm the sell‑off is more than a flash dip.
With the bears in control, the momentum ⚡ is primed for another leg down; lock in profits now and tighten your stop to guard against any sudden reversal. 💬 Are you ready to clip those short gains before the market catches a breath? 👇
⚠️ Not financial advice. Always manage your risk. 🛡️
🏷️ #LTC #ShortSetup #Bearish #Crypto
🔥 💎
Smart money 🦈 has been sweeping the order book, hammering $LTC below the 90‑day swing low while volume spikes 📊 confirm the sell‑off is more than a flash dip.
With the bears in control, the momentum ⚡ is primed for another leg down; lock in profits now and tighten your stop to guard against any sudden reversal. 💬 Are you ready to clip those short gains before the market catches a breath? 👇
⚠️ Not financial advice. Always manage your risk. 🛡️
🏷️ #LTC #ShortSetup #Bearish #Crypto
🔥 💎
1

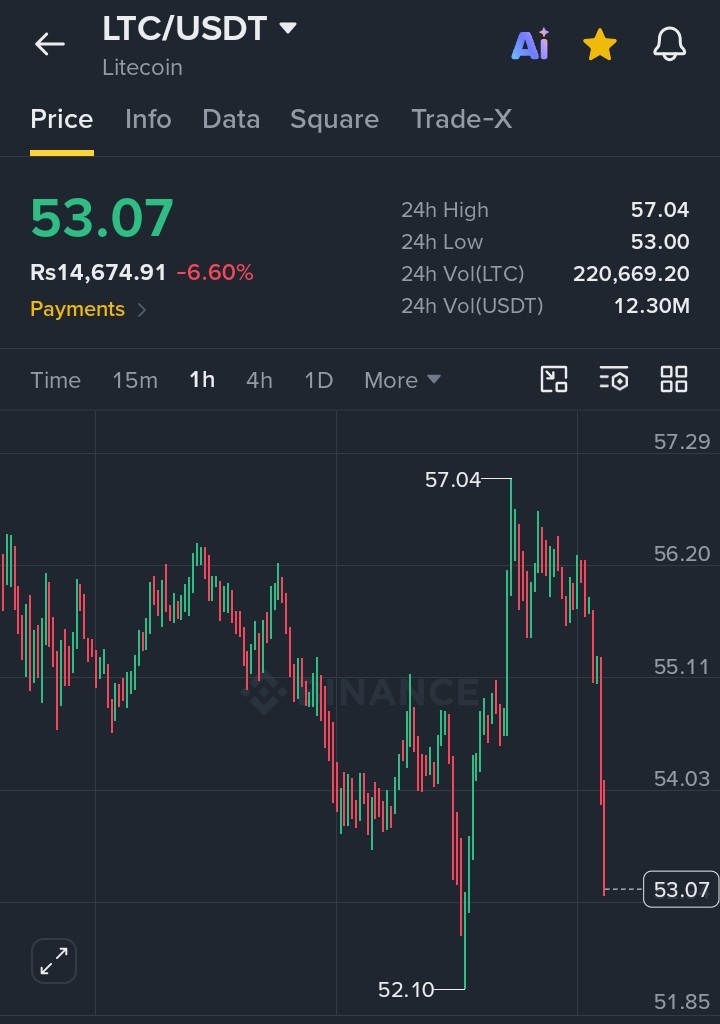
🔥 $LTC /USDT — LIQUIDITY SWEEP INCOMING? BULLISH REVERSAL SETUP TO WATCH! 🚀 $LTC is trading at $53.07 (-6.60%), showing strong bearish momentum after rejection from the $57.04 resistance zone. The 1H chart reveals a sharp sell-off, with price approaching the critical $53.00 support after losing the $54.03 structure. Smart-money traders should watch for a liquidity sweep below $53.00, followed by a bullish CHoCH/BOS to confirm buyers are stepping in. LONG SETUP: Entry: $53.00–$53.50 (only after a confirmed reclaim and bullish retest) | TP1: $54.03 | TP2: $55.11 | TP3: $56.20 | SL: $52.10. A successful recovery above $54.03 could open the door toward higher resistance levels, while a breakdown below $52.10 invalidates this bullish setup. Don't chase falling candles; wait for confirmation, follow smart money, and manage your risk. Follow for more clean technical setups!
#LTC
🔥 $LTC /USDT — LIQUIDITY SWEEP INCOMING? BULLISH REVERSAL SETUP TO WATCH! 🚀 $LTC is trading at $53.07 (-6.60%), showing strong bearish momentum after rejection from the $57.04 resistance zone. The 1H chart reveals a sharp sell-off, with price approaching the critical $53.00 support after losing the $54.03 structure. Smart-money traders should watch for a liquidity sweep below $53.00, followed by a bullish CHoCH/BOS to confirm buyers are stepping in. LONG SETUP: Entry: $53.00–$53.50 (only after a confirmed reclaim and bullish retest) | TP1: $54.03 | TP2: $55.11 | TP3: $56.20 | SL: $52.10. A successful recovery above $54.03 could open the door toward higher resistance levels, while a breakdown below $52.10 invalidates this bullish setup. Don't chase falling candles; wait for confirmation, follow smart money, and manage your risk. Follow for more clean technical setups!
#LTC
#LTC
1
64

·
--
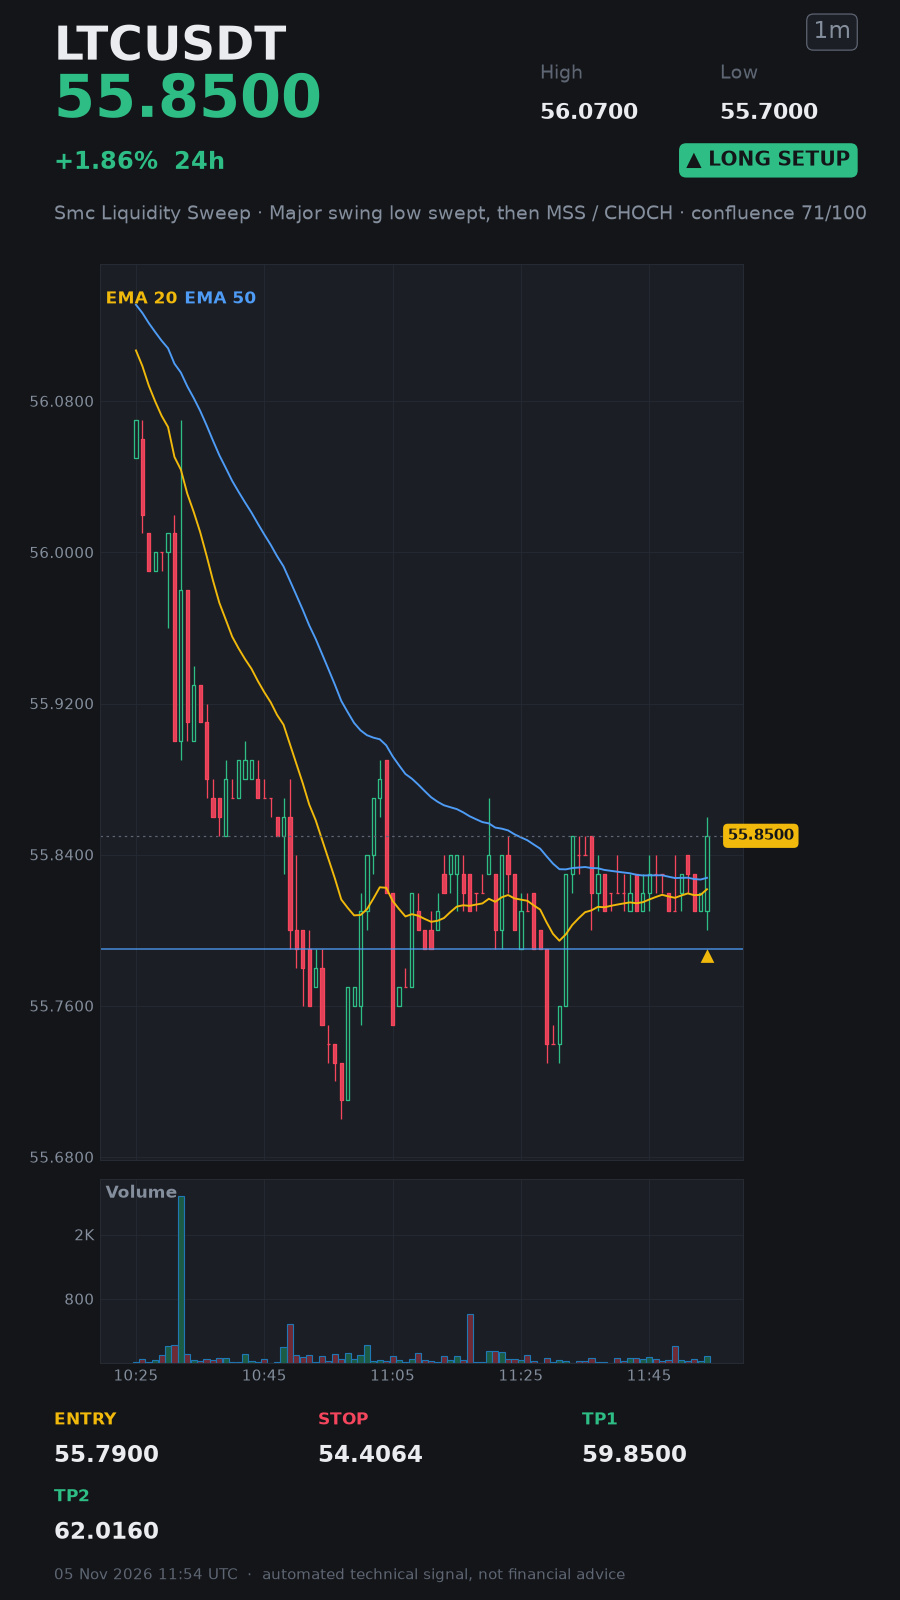
🚨 #LTC SWEEP SURGE COMING IN! 🤯⚡
I'm grabbing this trade now $LTC 👇
Long..... Fast..... Ride it..... Soon.....‼️‼️‼️
Entry: 55.7600 – 55.7900
Stop-loss: 54.4064
🟢 TP1: 59.8500
🟢 TP2: 62.0160
Join me, trade together now! 👇⬇️⬇️ Long.. With meee...👇⬇️ $LTC
🚨 #LTC SWEEP SURGE COMING IN! 🤯⚡
I'm grabbing this trade now $LTC 👇
Long..... Fast..... Ride it..... Soon.....‼️‼️‼️
Entry: 55.7600 – 55.7900
Stop-loss: 54.4064
🟢 TP1: 59.8500
🟢 TP2: 62.0160
Join me, trade together now! 👇⬇️⬇️ Long.. With meee...👇⬇️ $LTC
I'm grabbing this trade now $LTC 👇
Long..... Fast..... Ride it..... Soon.....‼️‼️‼️
Entry: 55.7600 – 55.7900
Stop-loss: 54.4064
🟢 TP1: 59.8500
🟢 TP2: 62.0160
Join me, trade together now! 👇⬇️⬇️ Long.. With meee...👇⬇️ $LTC
6

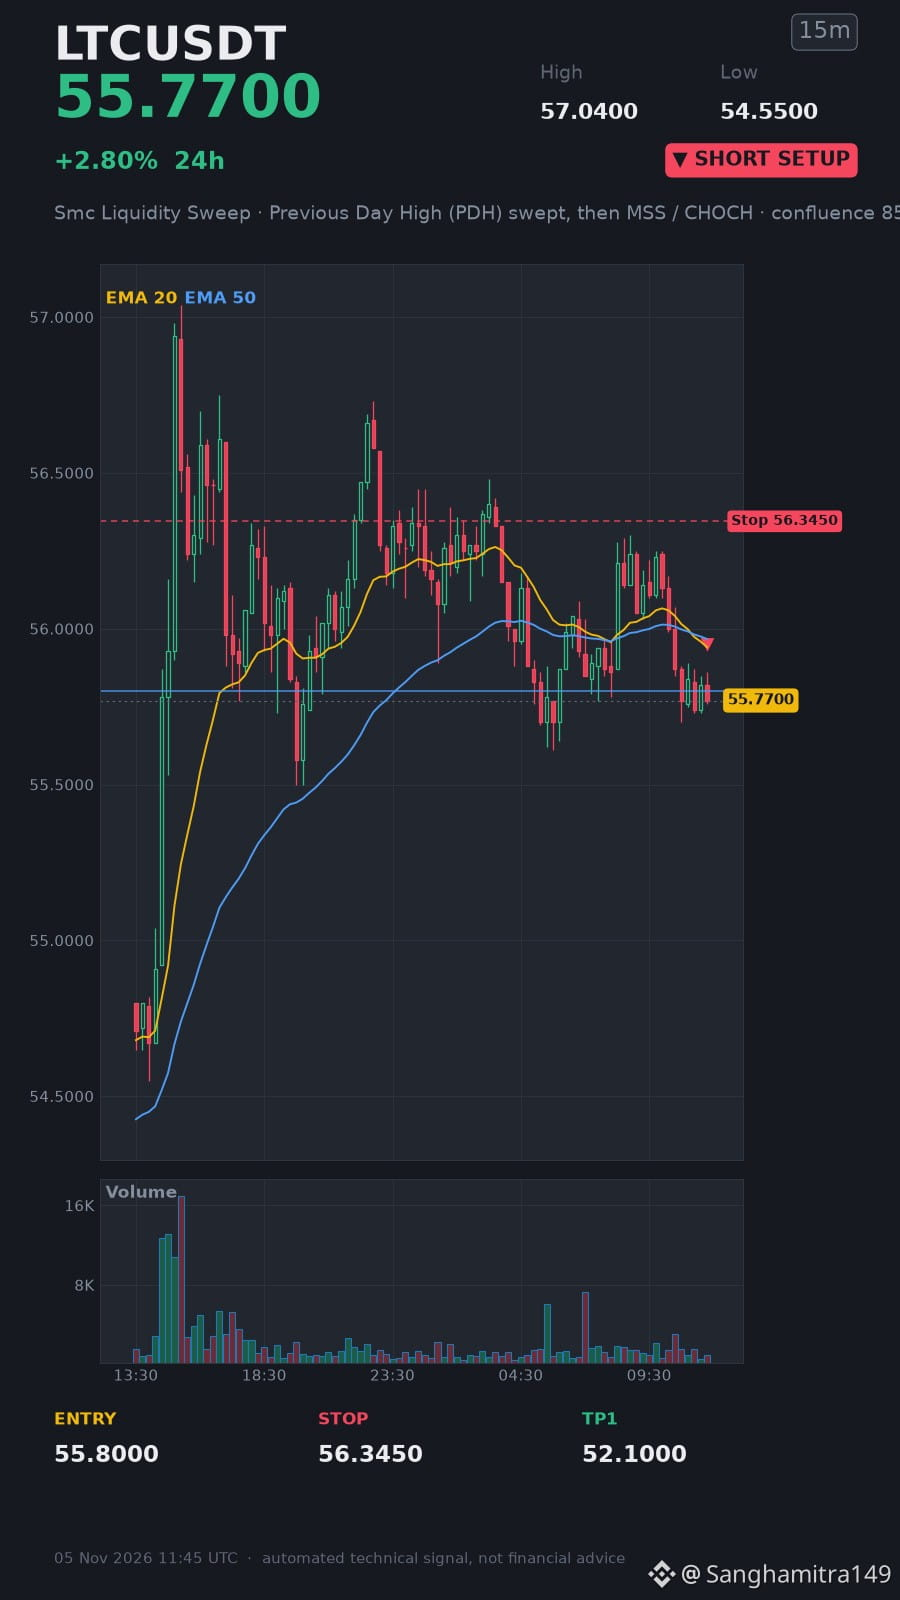
🚨 #LTC SMC SWEEP BLASTING THE MARKET! 🤯🐻
I'm riding this short now $LTC 👇
Short..... Fast..... Watch the melt..... Soon.....‼️‼️‼️
Entry: 55.8000 – 55.8200
Stop-loss: 56.3450
🟢 TP1: 52.1000
Join me, trade the drop together 👇⬇️⬇️ Short.. With meee...👇⬇️ $LTC
🚨 #LTC SMC SWEEP BLASTING THE MARKET! 🤯🐻
I'm riding this short now $LTC 👇
Short..... Fast..... Watch the melt..... Soon.....‼️‼️‼️
Entry: 55.8000 – 55.8200
Stop-loss: 56.3450
🟢 TP1: 52.1000
Join me, trade the drop together 👇⬇️⬇️ Short.. With meee...👇⬇️ $LTC
I'm riding this short now $LTC 👇
Short..... Fast..... Watch the melt..... Soon.....‼️‼️‼️
Entry: 55.8000 – 55.8200
Stop-loss: 56.3450
🟢 TP1: 52.1000
Join me, trade the drop together 👇⬇️⬇️ Short.. With meee...👇⬇️ $LTC
3
·
--
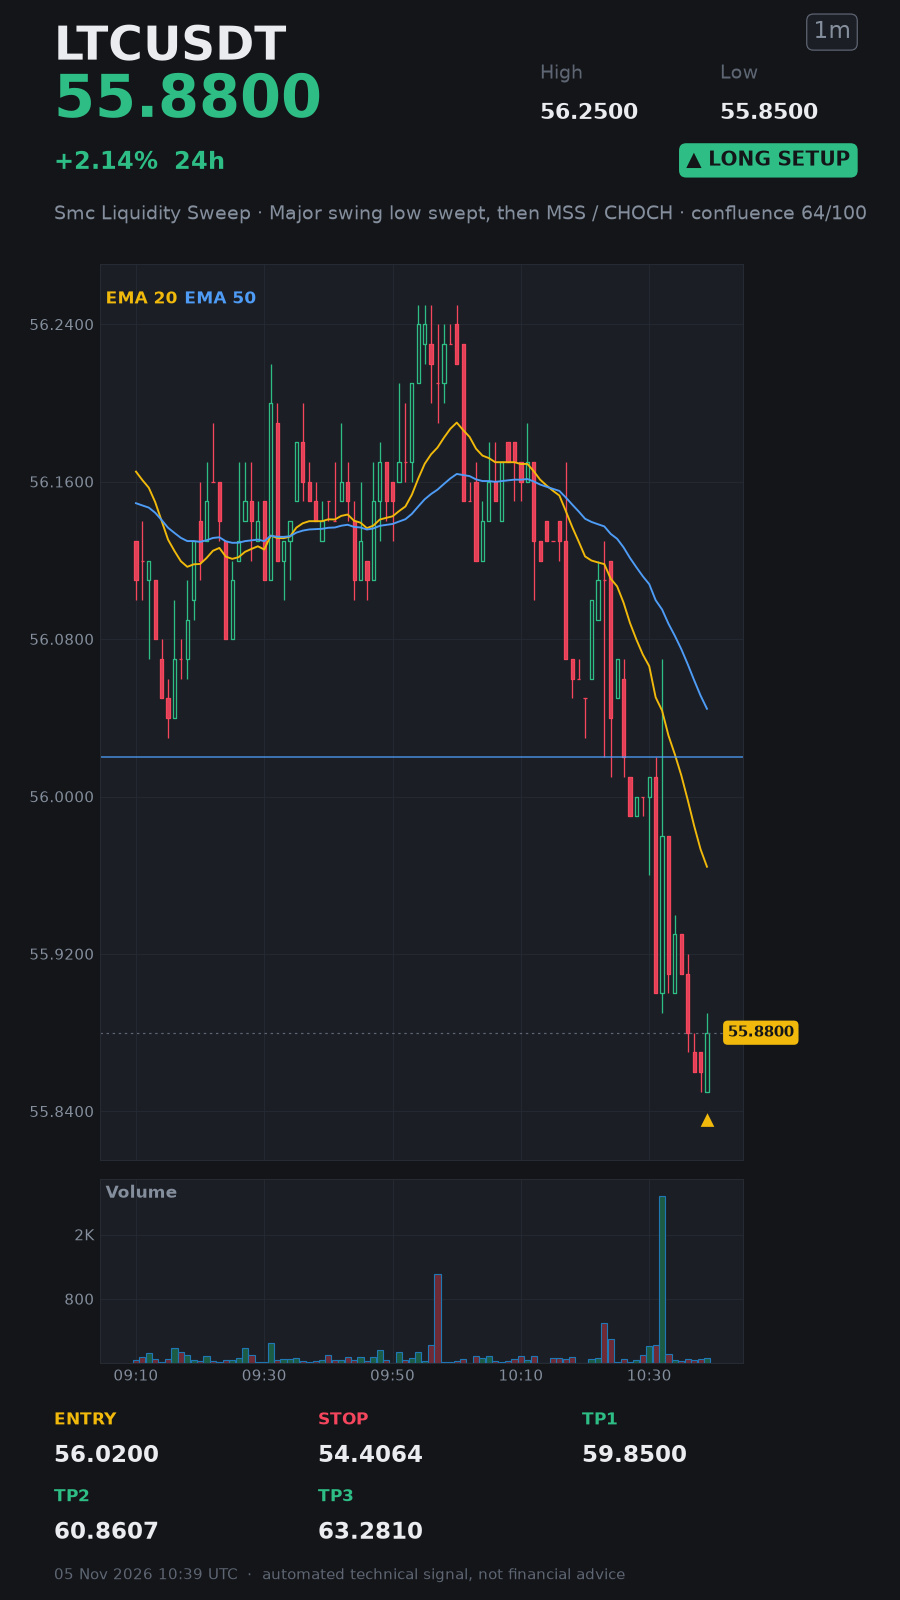
🚨 #LTC SMC SWEEP IGNITES BULLISH SURGE! 🤯🚀
I’m going long right now $LTC 👇
Long..... Waves..... Trust meee..... Ride it.....‼️‼️‼️
Entry: 55.9000 – 56.0200
Stop-loss: 54.4064
🟢 TP1: 59.8500
🟢 TP2: 60.8607
🟢 TP3: 63.2810
Join me, trade together now 👇⬇️⬇️ Long.. With meee...👇⬇️ $LTC
🚨 #LTC SMC SWEEP IGNITES BULLISH SURGE! 🤯🚀
I’m going long right now $LTC 👇
Long..... Waves..... Trust meee..... Ride it.....‼️‼️‼️
Entry: 55.9000 – 56.0200
Stop-loss: 54.4064
🟢 TP1: 59.8500
🟢 TP2: 60.8607
🟢 TP3: 63.2810
Join me, trade together now 👇⬇️⬇️ Long.. With meee...👇⬇️ $LTC
I’m going long right now $LTC 👇
Long..... Waves..... Trust meee..... Ride it.....‼️‼️‼️
Entry: 55.9000 – 56.0200
Stop-loss: 54.4064
🟢 TP1: 59.8500
🟢 TP2: 60.8607
🟢 TP3: 63.2810
Join me, trade together now 👇⬇️⬇️ Long.. With meee...👇⬇️ $LTC
5

·
--
🚀 Crypto Market Update | LTC • ARB • INJ
🥈 $LTC (Litecoin): Around $55.96 (+2.89%). Showing recovery signs. Watch $57.10 resistance for a possible breakout.
🔵 $ARB (Arbitrum): Around $0.1645 (+4.91%). Buyers are gaining momentum. Sustained volume could support further upside.
⚡ $INJ (Injective): Around $7.77 (+7.92%). Strong bullish momentum today. Watch the $8.00–$8.10 resistance zone.
📊 Market Outlook: All three coins are showing positive 24-hour performance. INJ is leading today's move. Watch volume and key support levels.
🔥 Stay focused. Trade smart. Protect your capital!
#LTC #ARB #INJ #CryptoAnalysis #Altcoins #CryptoMarket
{future}(LTCUSDT)
{future}(ARBUSDT)
{future}(INJUSDT)
🚀 Crypto Market Update | LTC • ARB • INJ
🥈 $LTC (Litecoin): Around $55.96 (+2.89%). Showing recovery signs. Watch $57.10 resistance for a possible breakout.
🔵 $ARB (Arbitrum): Around $0.1645 (+4.91%). Buyers are gaining momentum. Sustained volume could support further upside.
⚡ $INJ (Injective): Around $7.77 (+7.92%). Strong bullish momentum today. Watch the $8.00–$8.10 resistance zone.
📊 Market Outlook: All three coins are showing positive 24-hour performance. INJ is leading today's move. Watch volume and key support levels.
🔥 Stay focused. Trade smart. Protect your capital!
#LTC #ARB #INJ #CryptoAnalysis #Altcoins #CryptoMarket
🥈 $LTC (Litecoin): Around $55.96 (+2.89%). Showing recovery signs. Watch $57.10 resistance for a possible breakout.
🔵 $ARB (Arbitrum): Around $0.1645 (+4.91%). Buyers are gaining momentum. Sustained volume could support further upside.
⚡ $INJ (Injective): Around $7.77 (+7.92%). Strong bullish momentum today. Watch the $8.00–$8.10 resistance zone.
📊 Market Outlook: All three coins are showing positive 24-hour performance. INJ is leading today's move. Watch volume and key support levels.
🔥 Stay focused. Trade smart. Protect your capital!
#LTC #ARB #INJ #CryptoAnalysis #Altcoins #CryptoMarket

53
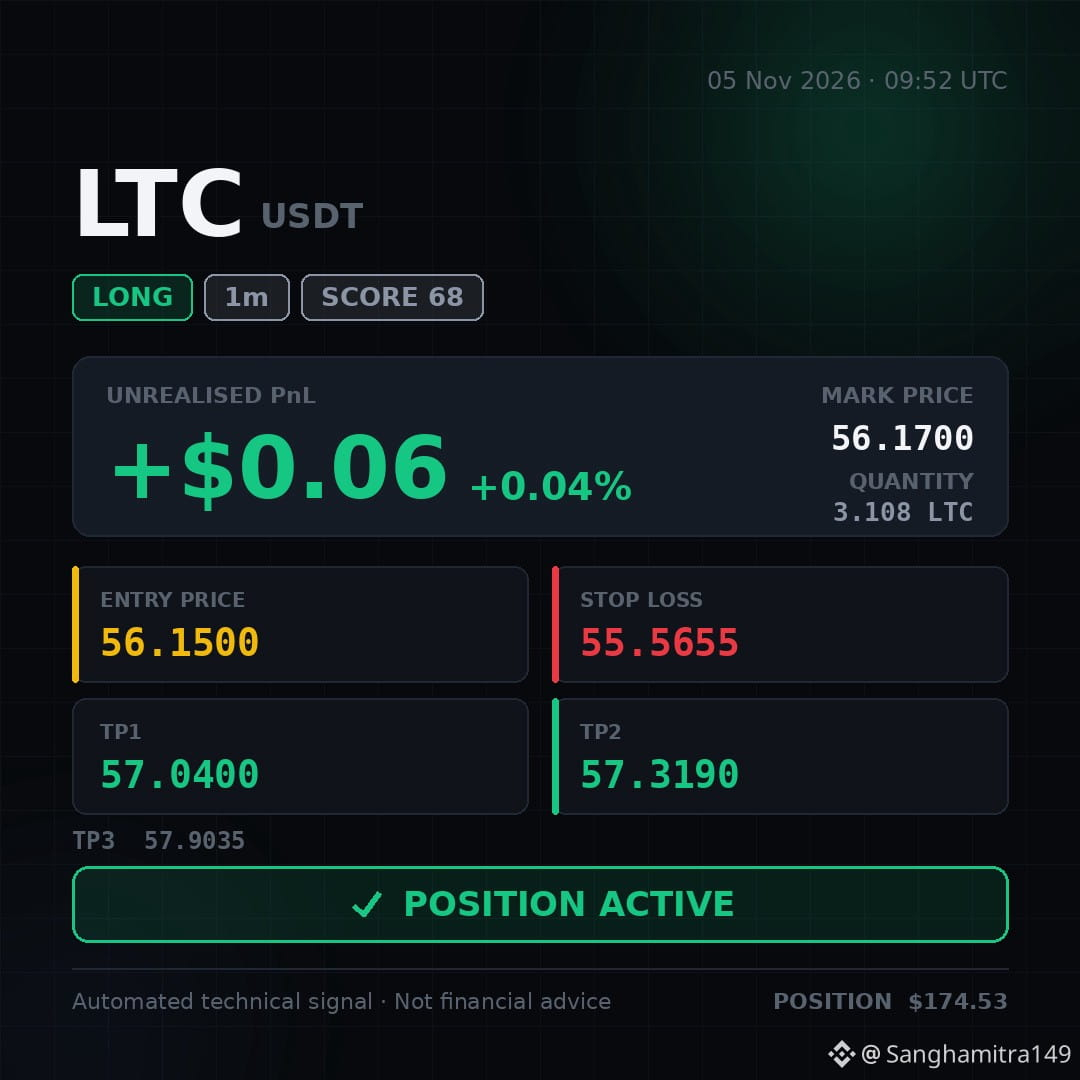
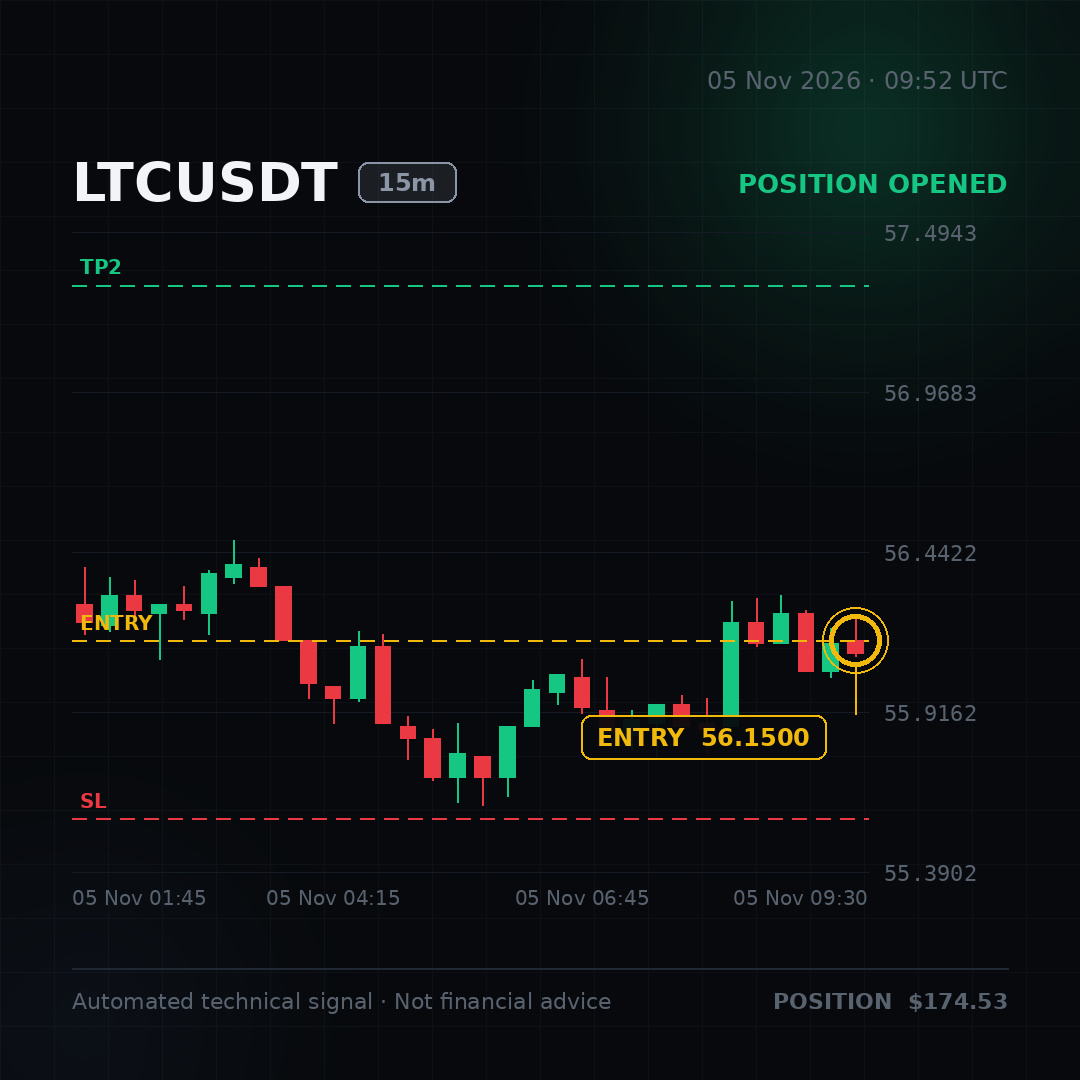
✅ POSITION ACTIVE — I've taken this long. Running at +0.04%.
🚨 #LTC SMC SWEEP IGNITES A BULLISH RUSH! 🤯💪
I'm taking this long right now. $LTC 👇
Long..... Sweep..... Feel the surge..... Hold tight.....‼️‼️‼️
Entry: 56.1100 – 56.1500
Stop-loss: 55.5655
🟢 TP1: 57.0400
🟢 TP2: 57.3190
🟢 TP3: 57.9035
Join me, trade the wave together! 👇⬇️⬇️ Long.. With meee...👇⬇️ $LTC
✅ POSITION ACTIVE — I've taken this long. Running at +0.04%.
🚨 #LTC SMC SWEEP IGNITES A BULLISH RUSH! 🤯💪
I'm taking this long right now. $LTC 👇
Long..... Sweep..... Feel the surge..... Hold tight.....‼️‼️‼️
Entry: 56.1100 – 56.1500
Stop-loss: 55.5655
🟢 TP1: 57.0400
🟢 TP2: 57.3190
🟢 TP3: 57.9035
Join me, trade the wave together! 👇⬇️⬇️ Long.. With meee...👇⬇️ $LTC
🚨 #LTC SMC SWEEP IGNITES A BULLISH RUSH! 🤯💪
I'm taking this long right now. $LTC 👇
Long..... Sweep..... Feel the surge..... Hold tight.....‼️‼️‼️
Entry: 56.1100 – 56.1500
Stop-loss: 55.5655
🟢 TP1: 57.0400
🟢 TP2: 57.3190
🟢 TP3: 57.9035
Join me, trade the wave together! 👇⬇️⬇️ Long.. With meee...👇⬇️ $LTC
4
·
--
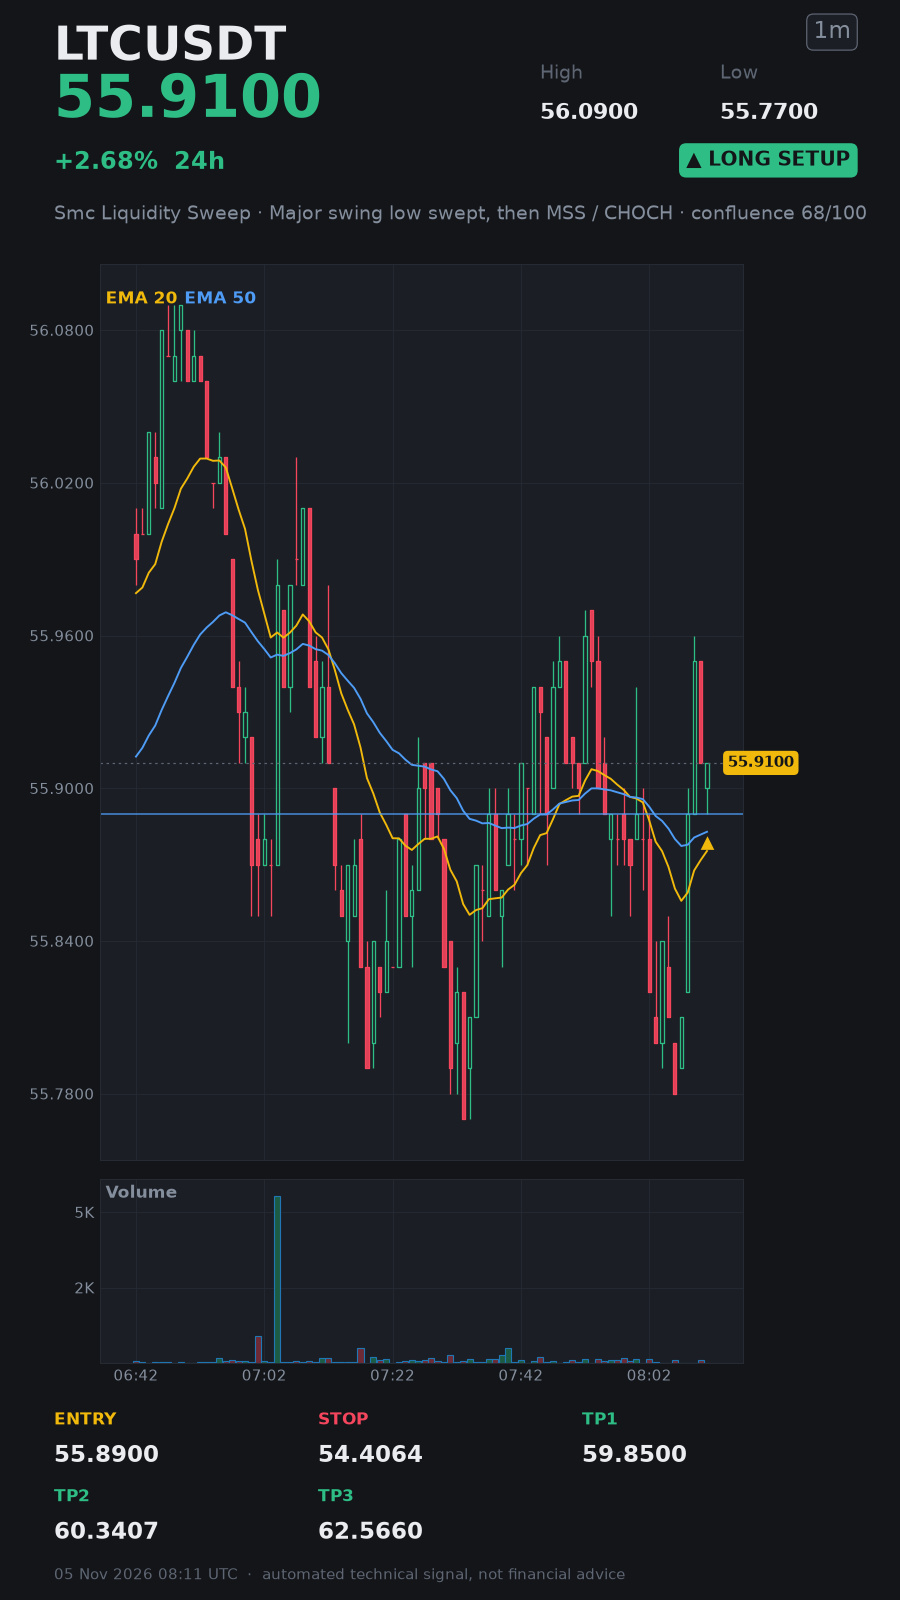
🚨 #LTC SMC SWEEP IGNITES MAJOR LONG MOVE! 🤯⚡
I'm in this trade now $LTC 👇
Long..... Fast..... Watch the ride.....‼️‼️‼️
Entry: 55.8100 – 55.8900
Stop-loss: 54.4064
🟢 TP1: 59.8500
🟢 TP2: 60.3407
🟢 TP3: 62.5660
Join me, trade together now 👇⬇️⬇️ Long.. With meee...👇⬇️ $LTC
🚨 #LTC SMC SWEEP IGNITES MAJOR LONG MOVE! 🤯⚡
I'm in this trade now $LTC 👇
Long..... Fast..... Watch the ride.....‼️‼️‼️
Entry: 55.8100 – 55.8900
Stop-loss: 54.4064
🟢 TP1: 59.8500
🟢 TP2: 60.3407
🟢 TP3: 62.5660
Join me, trade together now 👇⬇️⬇️ Long.. With meee...👇⬇️ $LTC
I'm in this trade now $LTC 👇
Long..... Fast..... Watch the ride.....‼️‼️‼️
Entry: 55.8100 – 55.8900
Stop-loss: 54.4064
🟢 TP1: 59.8500
🟢 TP2: 60.3407
🟢 TP3: 62.5660
Join me, trade together now 👇⬇️⬇️ Long.. With meee...👇⬇️ $LTC
4

·
--
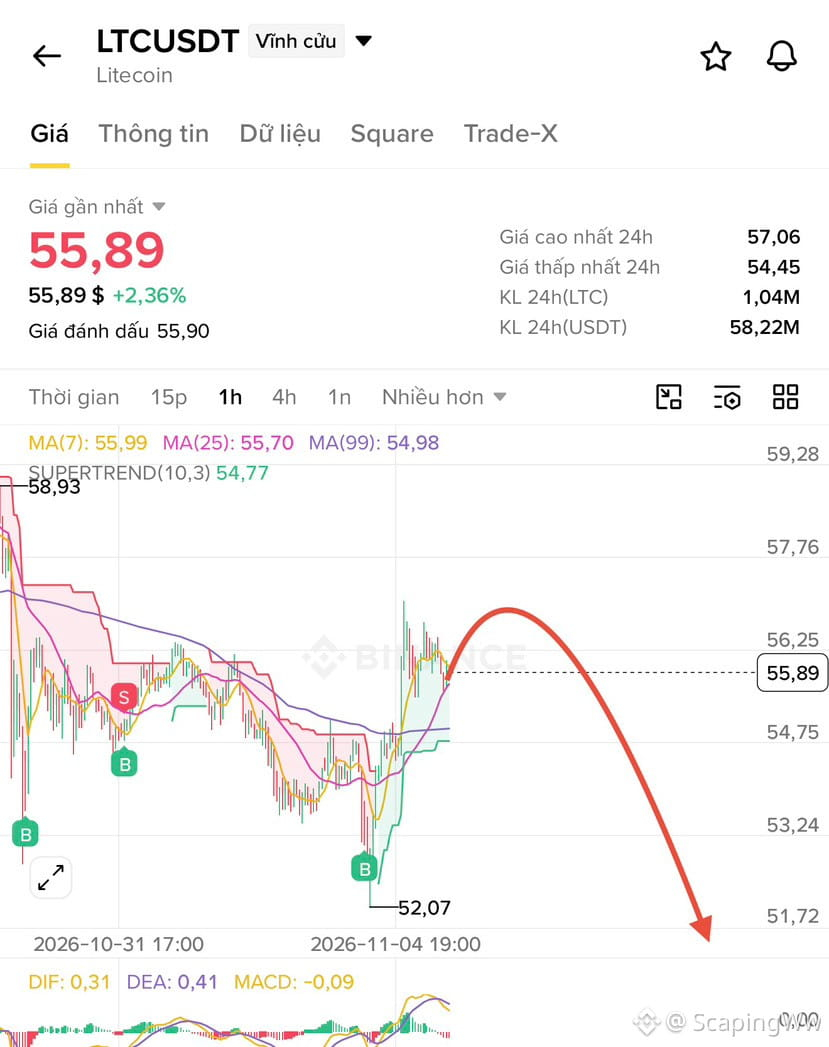
🔴 $LTC SLIDING INTO DEEP SELL ZONE 🚨
Entry: 55.34-56.46 ⚡
Target: 54.11 🎯
Target: 52.21 🎯
Target: 50.87 🎯
Stop Loss: 60.70 ⚠️
📊 Smart money is draining liquidity beneath the 60‑level, leaving a clean vacuum for sellers. 🦈 Volume spikes on the 1H chart confirm a relentless bid‑wall collapse, while the RSI dives below 40, flashing a classic oversold trap. 💥 The next wave of liquidation is primed to cascade through the 55‑56 band, feeding the bearish thrust.
💬 Who’s ready to ride the downside and lock in those tight profit zones? 👇
⚠️ Not financial advice. Always manage your risk. 🛡️
🏷️ #LTC #ShortSetup #Crypto #Bearish
🔥 🦈
🔴 $LTC SLIDING INTO DEEP SELL ZONE 🚨
Entry: 55.34-56.46 ⚡
Target: 54.11 🎯
Target: 52.21 🎯
Target: 50.87 🎯
Stop Loss: 60.70 ⚠️
📊 Smart money is draining liquidity beneath the 60‑level, leaving a clean vacuum for sellers. 🦈 Volume spikes on the 1H chart confirm a relentless bid‑wall collapse, while the RSI dives below 40, flashing a classic oversold trap. 💥 The next wave of liquidation is primed to cascade through the 55‑56 band, feeding the bearish thrust.
💬 Who’s ready to ride the downside and lock in those tight profit zones? 👇
⚠️ Not financial advice. Always manage your risk. 🛡️
🏷️ #LTC #ShortSetup #Crypto #Bearish
🔥 🦈
Entry: 55.34-56.46 ⚡
Target: 54.11 🎯
Target: 52.21 🎯
Target: 50.87 🎯
Stop Loss: 60.70 ⚠️
📊 Smart money is draining liquidity beneath the 60‑level, leaving a clean vacuum for sellers. 🦈 Volume spikes on the 1H chart confirm a relentless bid‑wall collapse, while the RSI dives below 40, flashing a classic oversold trap. 💥 The next wave of liquidation is primed to cascade through the 55‑56 band, feeding the bearish thrust.
💬 Who’s ready to ride the downside and lock in those tight profit zones? 👇
⚠️ Not financial advice. Always manage your risk. 🛡️
🏷️ #LTC #ShortSetup #Crypto #Bearish
🔥 🦈
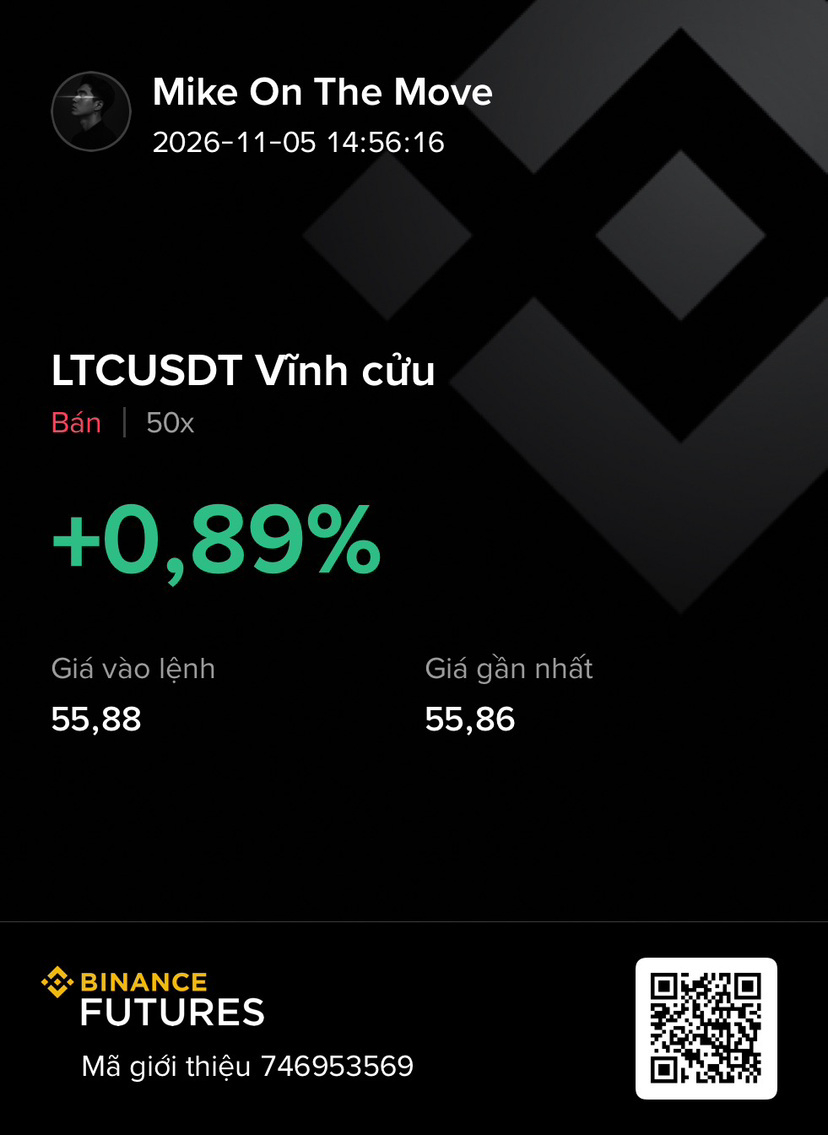
7

🔴 $LTC SET FOR QUICK SELL-OFF AS LIQUIDITY SWEEP LOOMS! 📉
Entry: 55.34-56.46 ⚡
Target: 54.11 🚀
Target: 52.21 🚀
Target: 50.87 🚀
Stop Loss: 60.70 ⚠️
📊 The recent order block around 56.00 has been devoured by smart‑money sellers, leaving a pronounced liquidity pocket above 60. 📌 A swift bearish retest is primed, and volume spikes on the 4‑hour chart confirm the pressure buildup. 🦈 Expect the market to hunt the remaining liquidity before conceding lower, carving a clean path toward the TP cluster.
💬 Do you see the next short entry aligning with this liquidity sweep? 👇
⚠️ Not financial advice. Always manage your risk. 🛡️
🏷️ #LTC #ShortSetup #LiquiditySweep #Crypto
🦈 🔥
🔴 $LTC SET FOR QUICK SELL-OFF AS LIQUIDITY SWEEP LOOMS! 📉
Entry: 55.34-56.46 ⚡
Target: 54.11 🚀
Target: 52.21 🚀
Target: 50.87 🚀
Stop Loss: 60.70 ⚠️
📊 The recent order block around 56.00 has been devoured by smart‑money sellers, leaving a pronounced liquidity pocket above 60. 📌 A swift bearish retest is primed, and volume spikes on the 4‑hour chart confirm the pressure buildup. 🦈 Expect the market to hunt the remaining liquidity before conceding lower, carving a clean path toward the TP cluster.
💬 Do you see the next short entry aligning with this liquidity sweep? 👇
⚠️ Not financial advice. Always manage your risk. 🛡️
🏷️ #LTC #ShortSetup #LiquiditySweep #Crypto
🦈 🔥
Entry: 55.34-56.46 ⚡
Target: 54.11 🚀
Target: 52.21 🚀
Target: 50.87 🚀
Stop Loss: 60.70 ⚠️
📊 The recent order block around 56.00 has been devoured by smart‑money sellers, leaving a pronounced liquidity pocket above 60. 📌 A swift bearish retest is primed, and volume spikes on the 4‑hour chart confirm the pressure buildup. 🦈 Expect the market to hunt the remaining liquidity before conceding lower, carving a clean path toward the TP cluster.
💬 Do you see the next short entry aligning with this liquidity sweep? 👇
⚠️ Not financial advice. Always manage your risk. 🛡️
🏷️ #LTC #ShortSetup #LiquiditySweep #Crypto
🦈 🔥
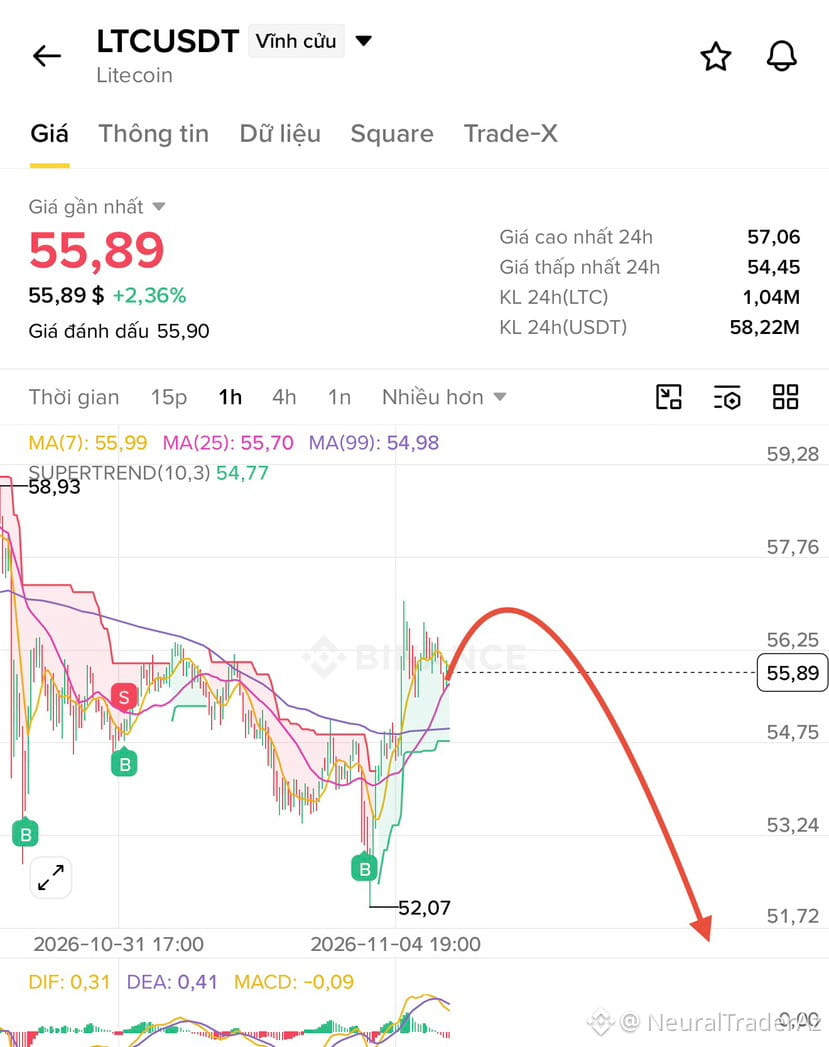
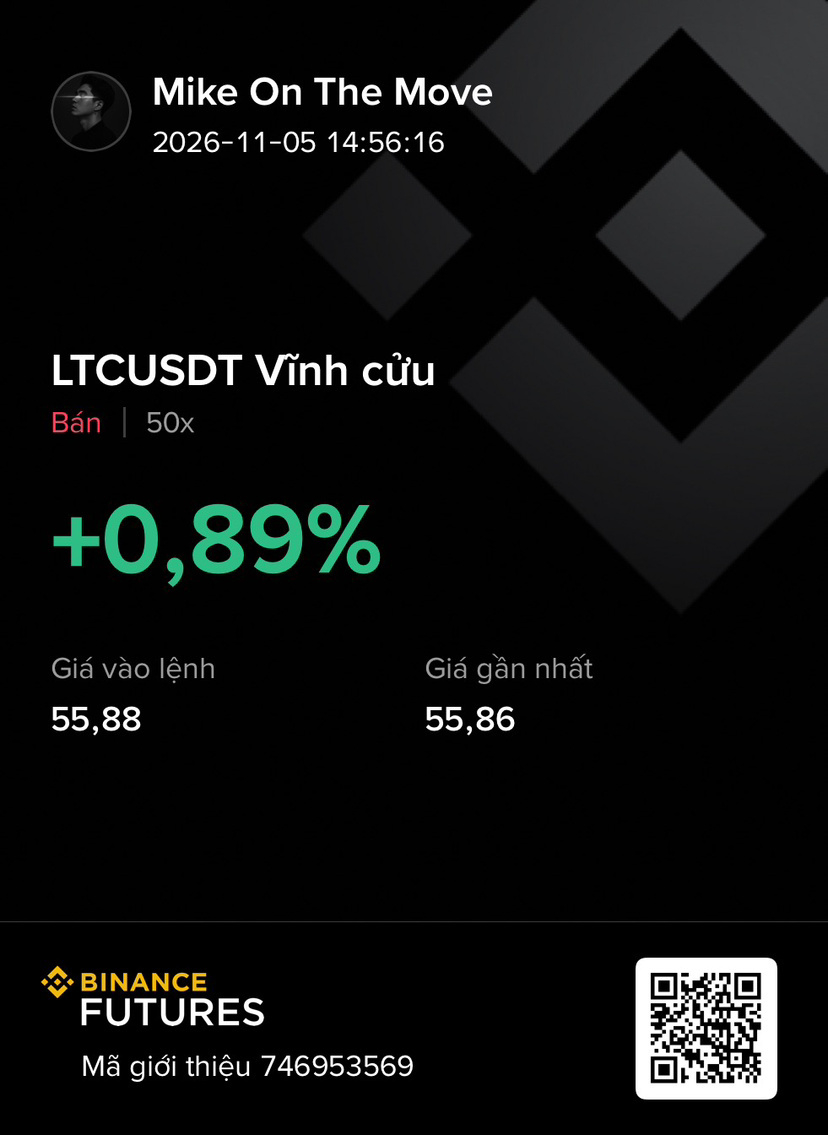
9

·
--
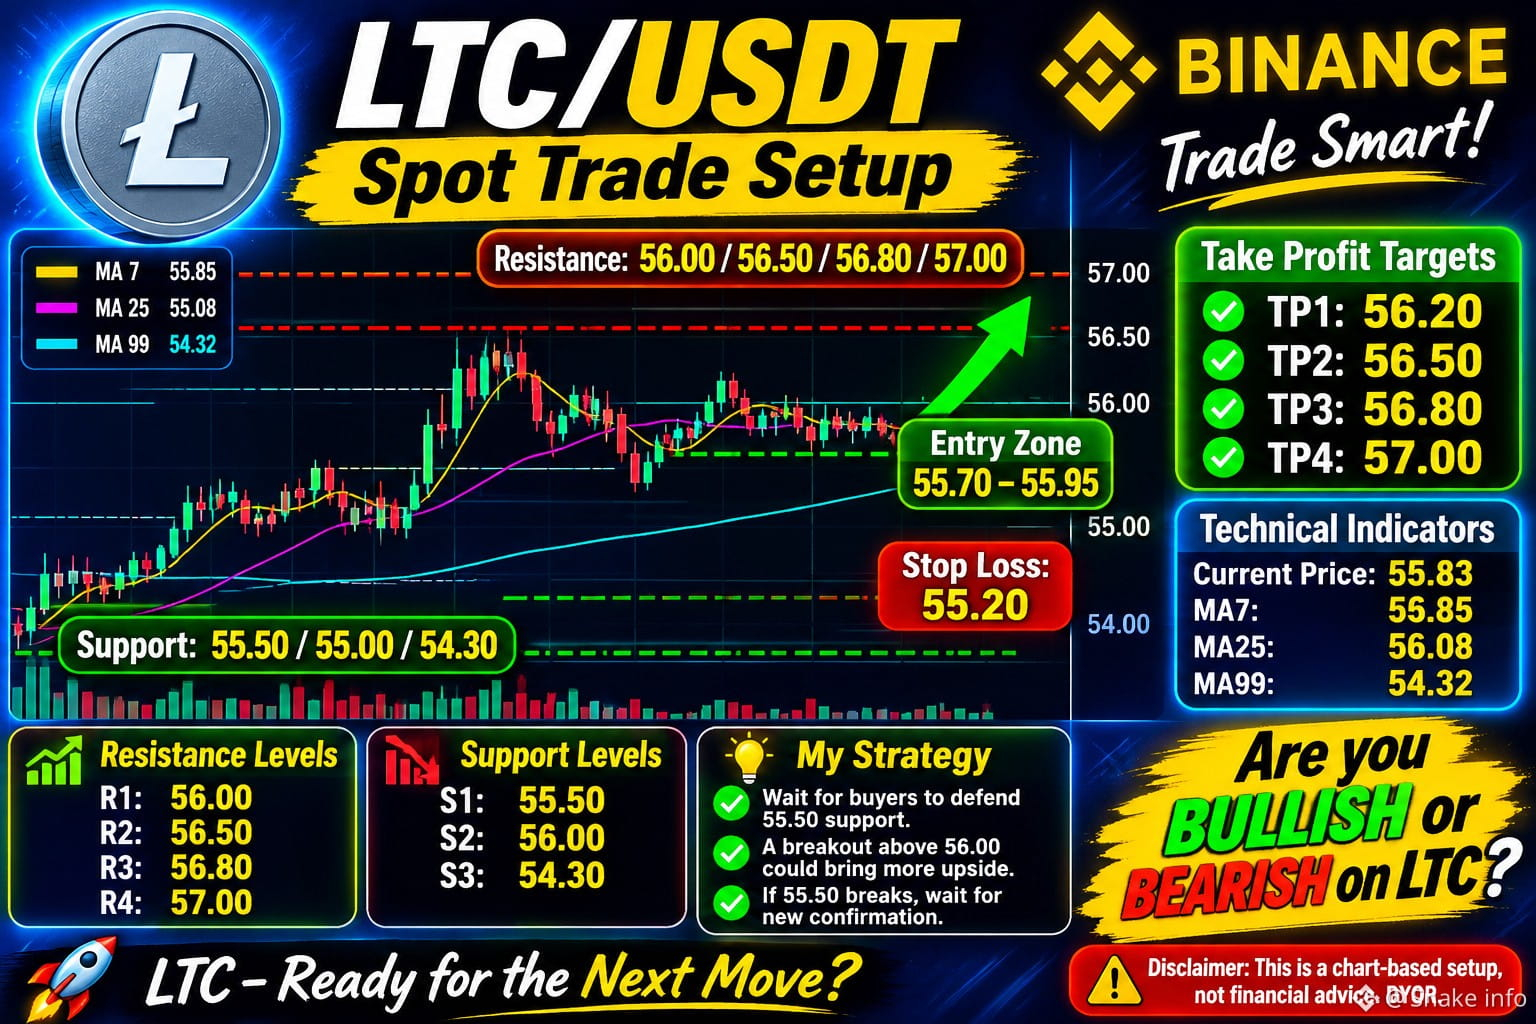
🚀 LTC/USDT — SPOT TRADING SETUP | 15M CHART 🟢
Litecoin is trading around 55.83 USDT, showing consolidation after a strong upward move.
Price is holding above MA25 and MA99, but short-term momentum is slowing. Buyers need to defend support and push through resistance for another bullish move.
🟢 SPOT BUY ENTRY ZONE
55.70 – 55.95 USDT
🎯 TAKE PROFIT TARGETS
TP1: 56.20
TP2: 56.50
TP3: 56.80
TP4: 57.00
🛑 STOP LOSS
55.20 USDT
📊 SUPPORT LEVELS
S1: 55.50
S2: 55.00
S3: 54.30
🚧 RESISTANCE LEVELS
R1: 56.00
R2: 56.50
R3: 56.80
R4: 57.00
📈 TECHNICAL INDICATORS
Current Price: 55.83
MA7: 55.85
MA25: 55.08
MA99: 54.32
🔥 MY STRATEGY
LTC is showing a potentially bullish structure on the 15-minute chart.
✅ Wait for buyers to defend the 55.50 area.
✅ A strong breakout above 56.00 could support further upside.
⚠️ If price breaks below 55.50, wait for a new confirmation.
💬 Are you BULLISH or BEARISH on Litecoin?
#LTC #LTCUSDT #Litecoin #Binance
Disclaimer: Educational chart-based setup, not financial advice. Levels are estimated from the supplied screenshot and may change with market conditions. Always DYOR.
CLICK TO BELOW TRADE👇
$LTC
{spot}(LTCUSDT)
🚀 LTC/USDT — SPOT TRADING SETUP | 15M CHART 🟢
Litecoin is trading around 55.83 USDT, showing consolidation after a strong upward move.
Price is holding above MA25 and MA99, but short-term momentum is slowing. Buyers need to defend support and push through resistance for another bullish move.
🟢 SPOT BUY ENTRY ZONE
55.70 – 55.95 USDT
🎯 TAKE PROFIT TARGETS
TP1: 56.20
TP2: 56.50
TP3: 56.80
TP4: 57.00
🛑 STOP LOSS
55.20 USDT
📊 SUPPORT LEVELS
S1: 55.50
S2: 55.00
S3: 54.30
🚧 RESISTANCE LEVELS
R1: 56.00
R2: 56.50
R3: 56.80
R4: 57.00
📈 TECHNICAL INDICATORS
Current Price: 55.83
MA7: 55.85
MA25: 55.08
MA99: 54.32
🔥 MY STRATEGY
LTC is showing a potentially bullish structure on the 15-minute chart.
✅ Wait for buyers to defend the 55.50 area.
✅ A strong breakout above 56.00 could support further upside.
⚠️ If price breaks below 55.50, wait for a new confirmation.
💬 Are you BULLISH or BEARISH on Litecoin?
#LTC #LTCUSDT #Litecoin #Binance
Disclaimer: Educational chart-based setup, not financial advice. Levels are estimated from the supplied screenshot and may change with market conditions. Always DYOR.
CLICK TO BELOW TRADE👇
$LTC
Litecoin is trading around 55.83 USDT, showing consolidation after a strong upward move.
Price is holding above MA25 and MA99, but short-term momentum is slowing. Buyers need to defend support and push through resistance for another bullish move.
🟢 SPOT BUY ENTRY ZONE
55.70 – 55.95 USDT
🎯 TAKE PROFIT TARGETS
TP1: 56.20
TP2: 56.50
TP3: 56.80
TP4: 57.00
🛑 STOP LOSS
55.20 USDT
📊 SUPPORT LEVELS
S1: 55.50
S2: 55.00
S3: 54.30
🚧 RESISTANCE LEVELS
R1: 56.00
R2: 56.50
R3: 56.80
R4: 57.00
📈 TECHNICAL INDICATORS
Current Price: 55.83
MA7: 55.85
MA25: 55.08
MA99: 54.32
🔥 MY STRATEGY
LTC is showing a potentially bullish structure on the 15-minute chart.
✅ Wait for buyers to defend the 55.50 area.
✅ A strong breakout above 56.00 could support further upside.
⚠️ If price breaks below 55.50, wait for a new confirmation.
💬 Are you BULLISH or BEARISH on Litecoin?
#LTC #LTCUSDT #Litecoin #Binance
Disclaimer: Educational chart-based setup, not financial advice. Levels are estimated from the supplied screenshot and may change with market conditions. Always DYOR.
CLICK TO BELOW TRADE👇
$LTC
70



·
--
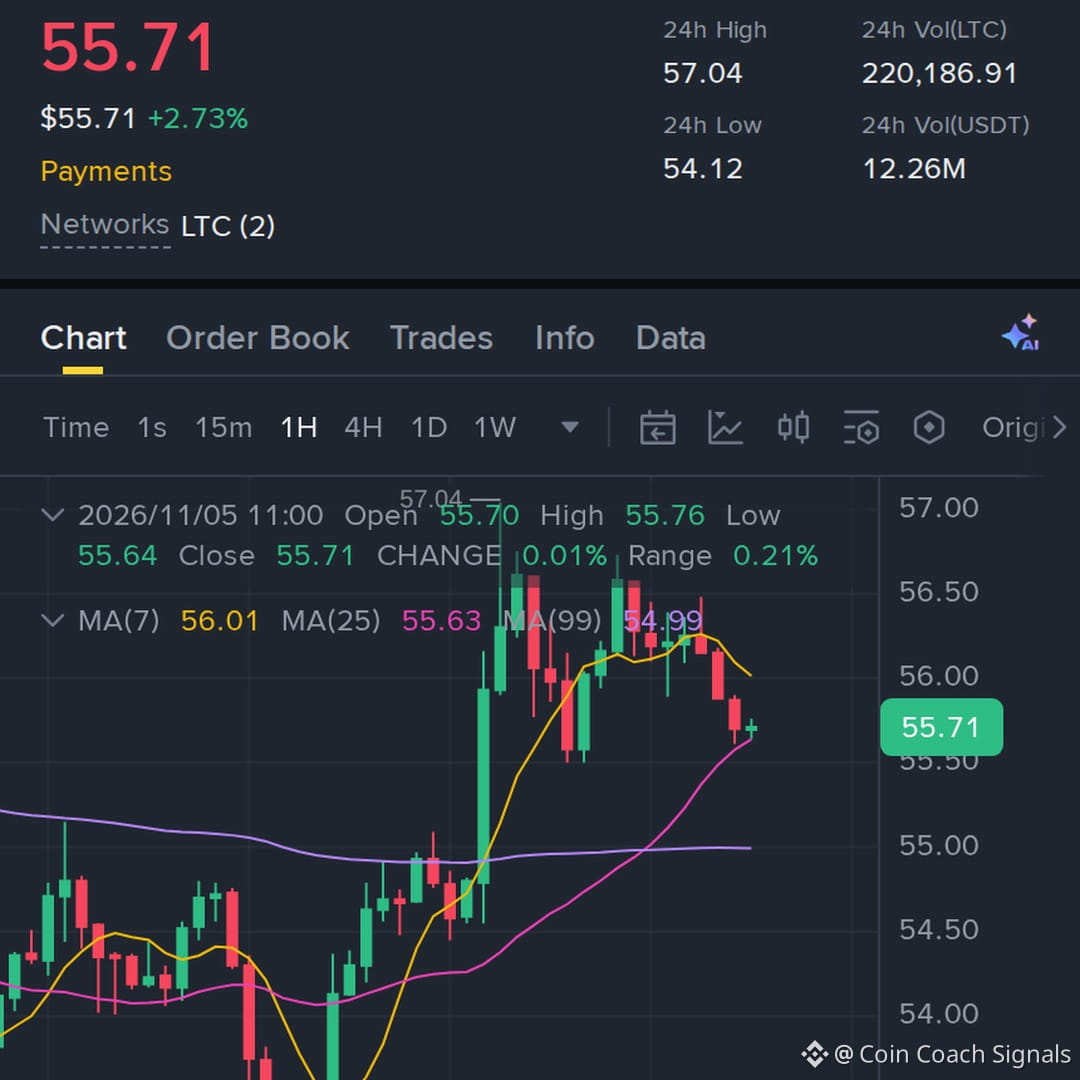
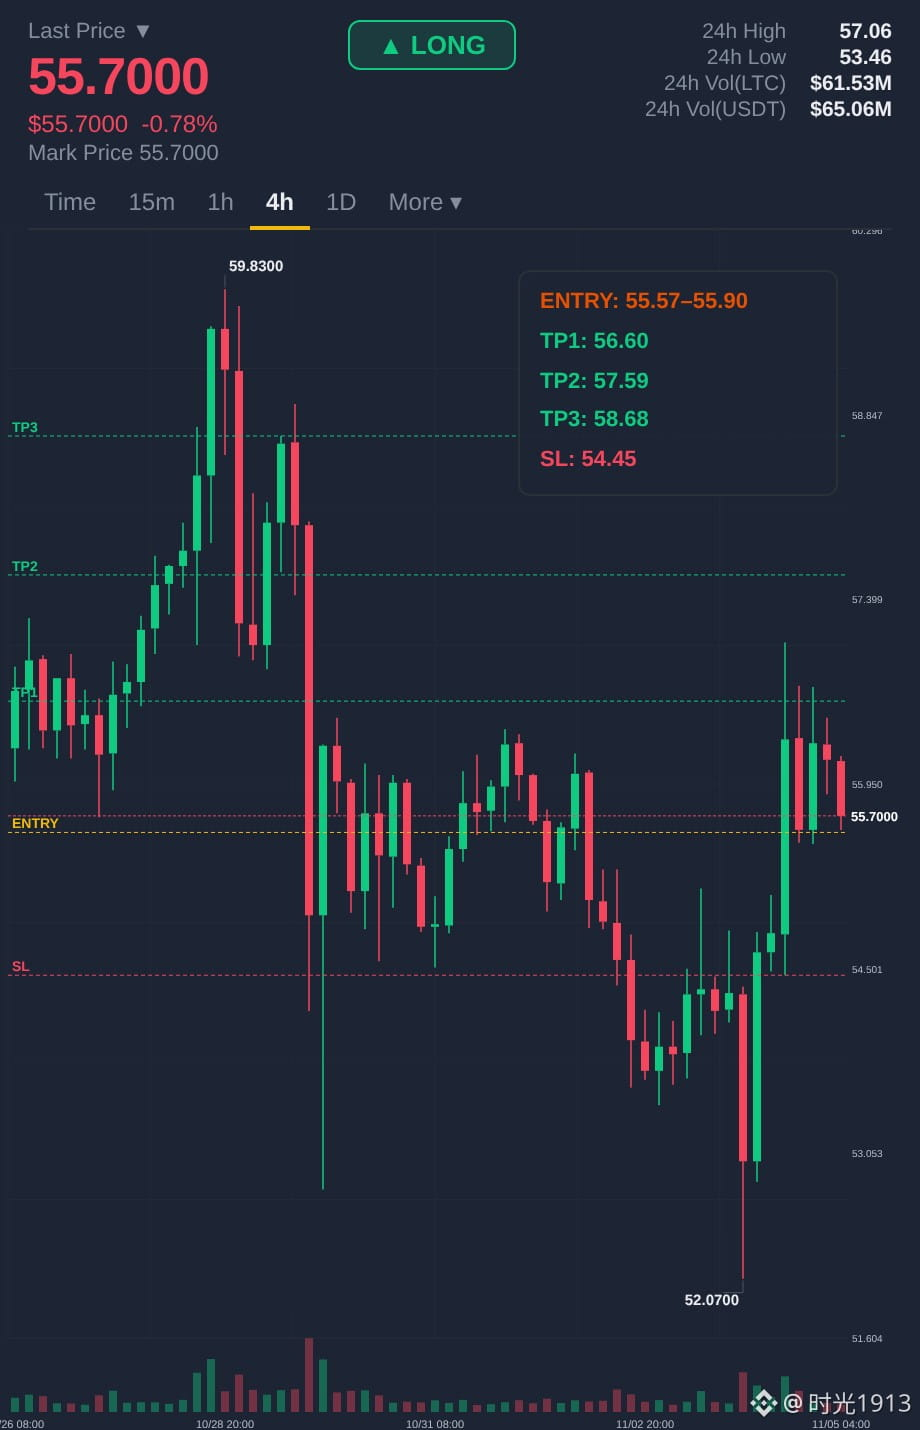
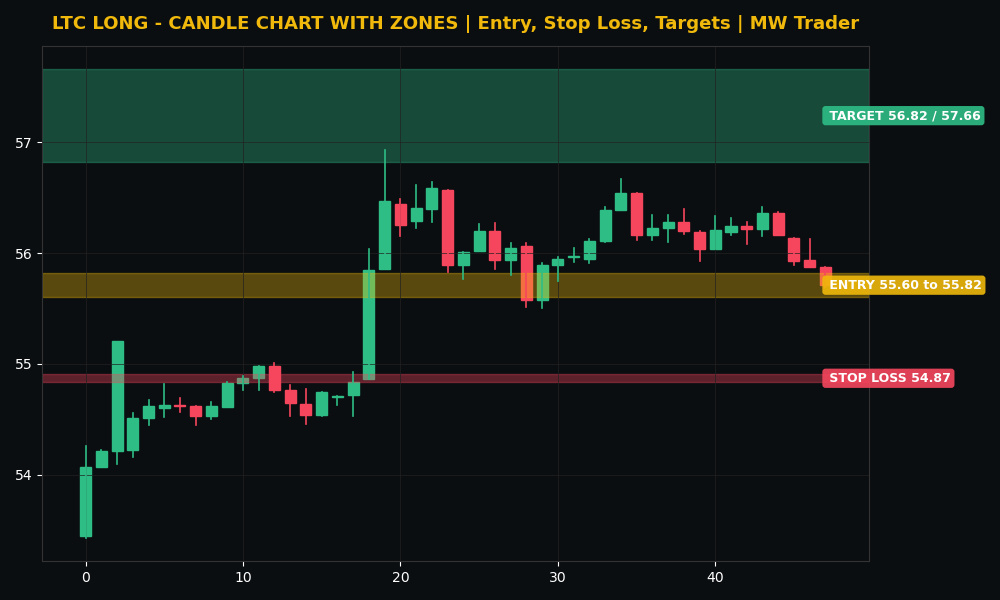
$LTC #LTC 🚀
Direction: LONG
Entry zone: 55.60 to 55.82
Stop loss: 54.87
Target 1: 56.82
Target 2: 57.66
Litecoin is trading near 55.71 dollars, up 2.55 percent in 24 hours, inside a range of 53.43 to 56.93, and the recent closes show a push that held, 56.16, then 55.93, then 55.87, then 55.71. 📈 My reading is that LTC is the quiet follower in this bounce, because it rose with Bitcoin's reclaim of 80,000 dollars and held above 55.50 instead of sliding back toward the 53.43 low. A long from the current zone, with a stop below 54.87, targets 56.82 first and then 57.66 if buyers push through the range high. A fall below 54.87 kills the idea without debate.
Futures trading is risky. Trade small, use a stop loss, and do your own research. This is my reading, not a guaranteed signal.
Does Litecoin rise to 56.82 first, or fall below 54.87? 🤔
Follow for more trades.
#LTC #Crypto #FuturesTrading #TradingSignals
$LTC #LTC 🚀
Direction: LONG
Entry zone: 55.60 to 55.82
Stop loss: 54.87
Target 1: 56.82
Target 2: 57.66
Litecoin is trading near 55.71 dollars, up 2.55 percent in 24 hours, inside a range of 53.43 to 56.93, and the recent closes show a push that held, 56.16, then 55.93, then 55.87, then 55.71. 📈 My reading is that LTC is the quiet follower in this bounce, because it rose with Bitcoin's reclaim of 80,000 dollars and held above 55.50 instead of sliding back toward the 53.43 low. A long from the current zone, with a stop below 54.87, targets 56.82 first and then 57.66 if buyers push through the range high. A fall below 54.87 kills the idea without debate.
Futures trading is risky. Trade small, use a stop loss, and do your own research. This is my reading, not a guaranteed signal.
Does Litecoin rise to 56.82 first, or fall below 54.87? 🤔
Follow for more trades.
#LTC #Crypto #FuturesTrading #TradingSignals
Direction: LONG
Entry zone: 55.60 to 55.82
Stop loss: 54.87
Target 1: 56.82
Target 2: 57.66
Litecoin is trading near 55.71 dollars, up 2.55 percent in 24 hours, inside a range of 53.43 to 56.93, and the recent closes show a push that held, 56.16, then 55.93, then 55.87, then 55.71. 📈 My reading is that LTC is the quiet follower in this bounce, because it rose with Bitcoin's reclaim of 80,000 dollars and held above 55.50 instead of sliding back toward the 53.43 low. A long from the current zone, with a stop below 54.87, targets 56.82 first and then 57.66 if buyers push through the range high. A fall below 54.87 kills the idea without debate.
Futures trading is risky. Trade small, use a stop loss, and do your own research. This is my reading, not a guaranteed signal.
Does Litecoin rise to 56.82 first, or fall below 54.87? 🤔
Follow for more trades.
#LTC #Crypto #FuturesTrading #TradingSignals
6
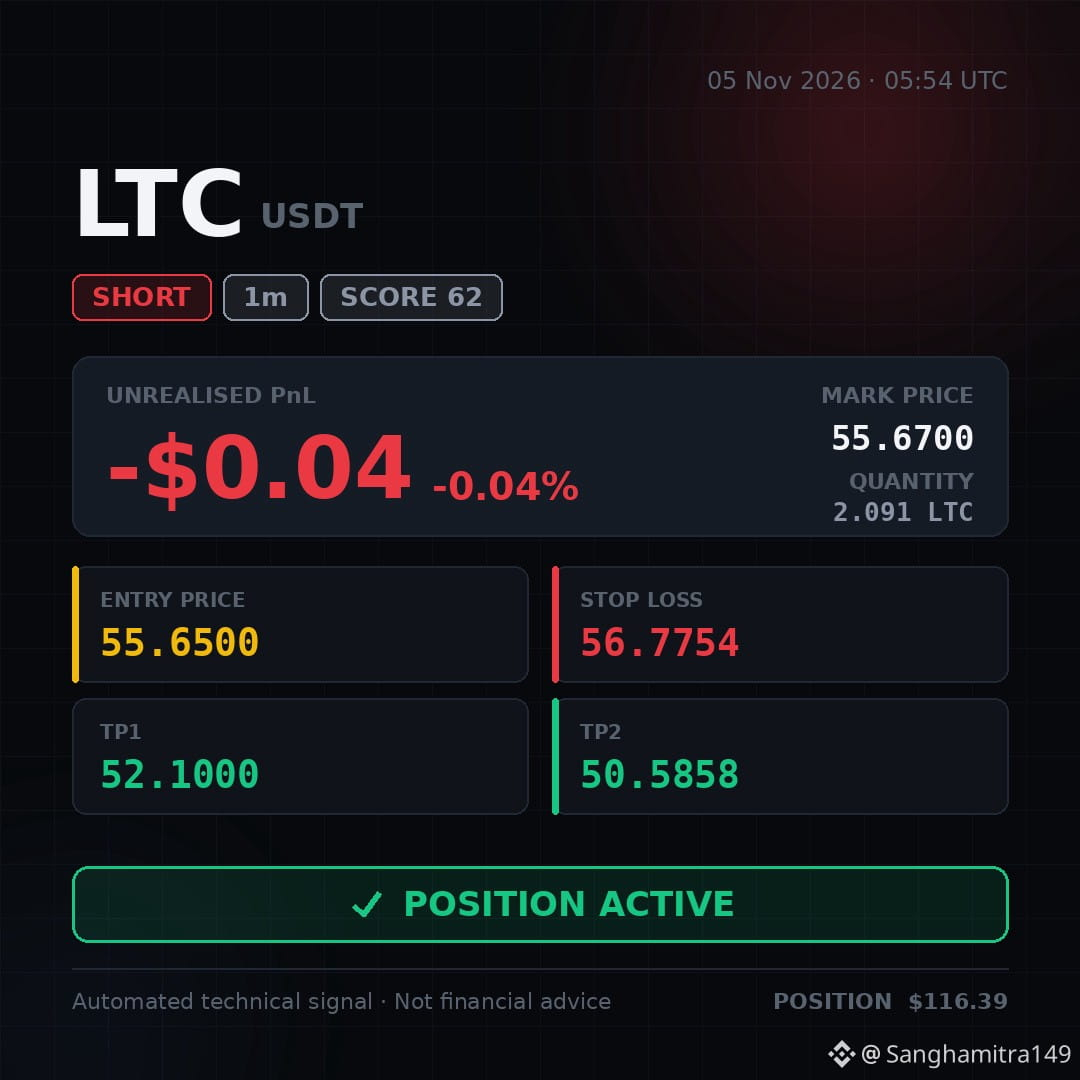
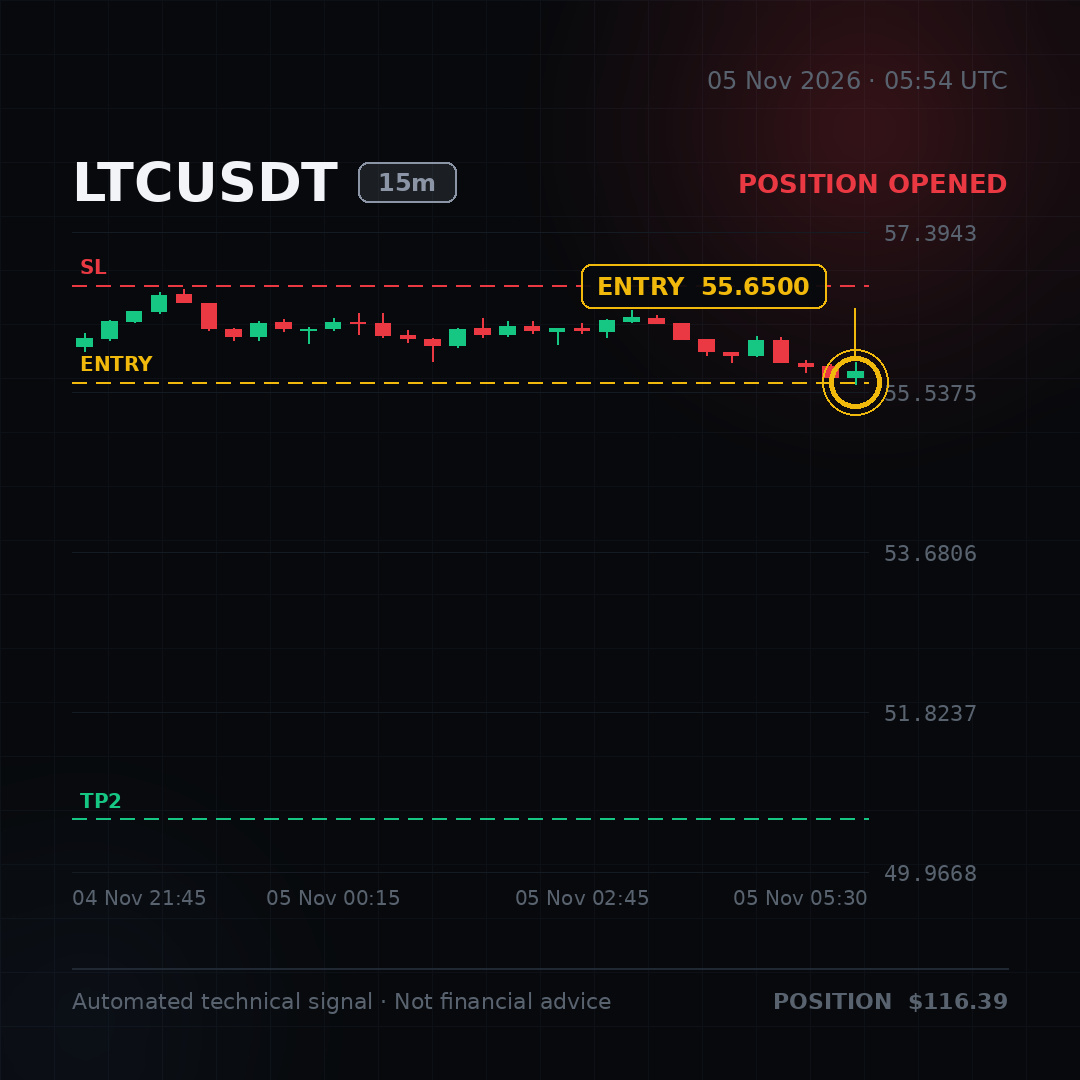
✅ POSITION ACTIVE — I've taken this short. Running at -0.04%.
🚨 #LTC SMC LIQUIDITY SWEEP IGNITES SELL OFF! 🤯📉
I'm shorting this wave now $LTC 👇
Short..... Quick..... Watch the dip..... Soon.....‼️‼️‼️
Entry: 55.6500 – 55.7700
Stop-loss: 56.7754
🟢 TP1: 52.1000
🟢 TP2: 50.5858
Join my trade, let's ride together 👇⬇️⬇️ Short.. With meee...👇⬇️ $LTC
✅ POSITION ACTIVE — I've taken this short. Running at -0.04%.
🚨 #LTC SMC LIQUIDITY SWEEP IGNITES SELL OFF! 🤯📉
I'm shorting this wave now $LTC 👇
Short..... Quick..... Watch the dip..... Soon.....‼️‼️‼️
Entry: 55.6500 – 55.7700
Stop-loss: 56.7754
🟢 TP1: 52.1000
🟢 TP2: 50.5858
Join my trade, let's ride together 👇⬇️⬇️ Short.. With meee...👇⬇️ $LTC
🚨 #LTC SMC LIQUIDITY SWEEP IGNITES SELL OFF! 🤯📉
I'm shorting this wave now $LTC 👇
Short..... Quick..... Watch the dip..... Soon.....‼️‼️‼️
Entry: 55.6500 – 55.7700
Stop-loss: 56.7754
🟢 TP1: 52.1000
🟢 TP2: 50.5858
Join my trade, let's ride together 👇⬇️⬇️ Short.. With meee...👇⬇️ $LTC
7


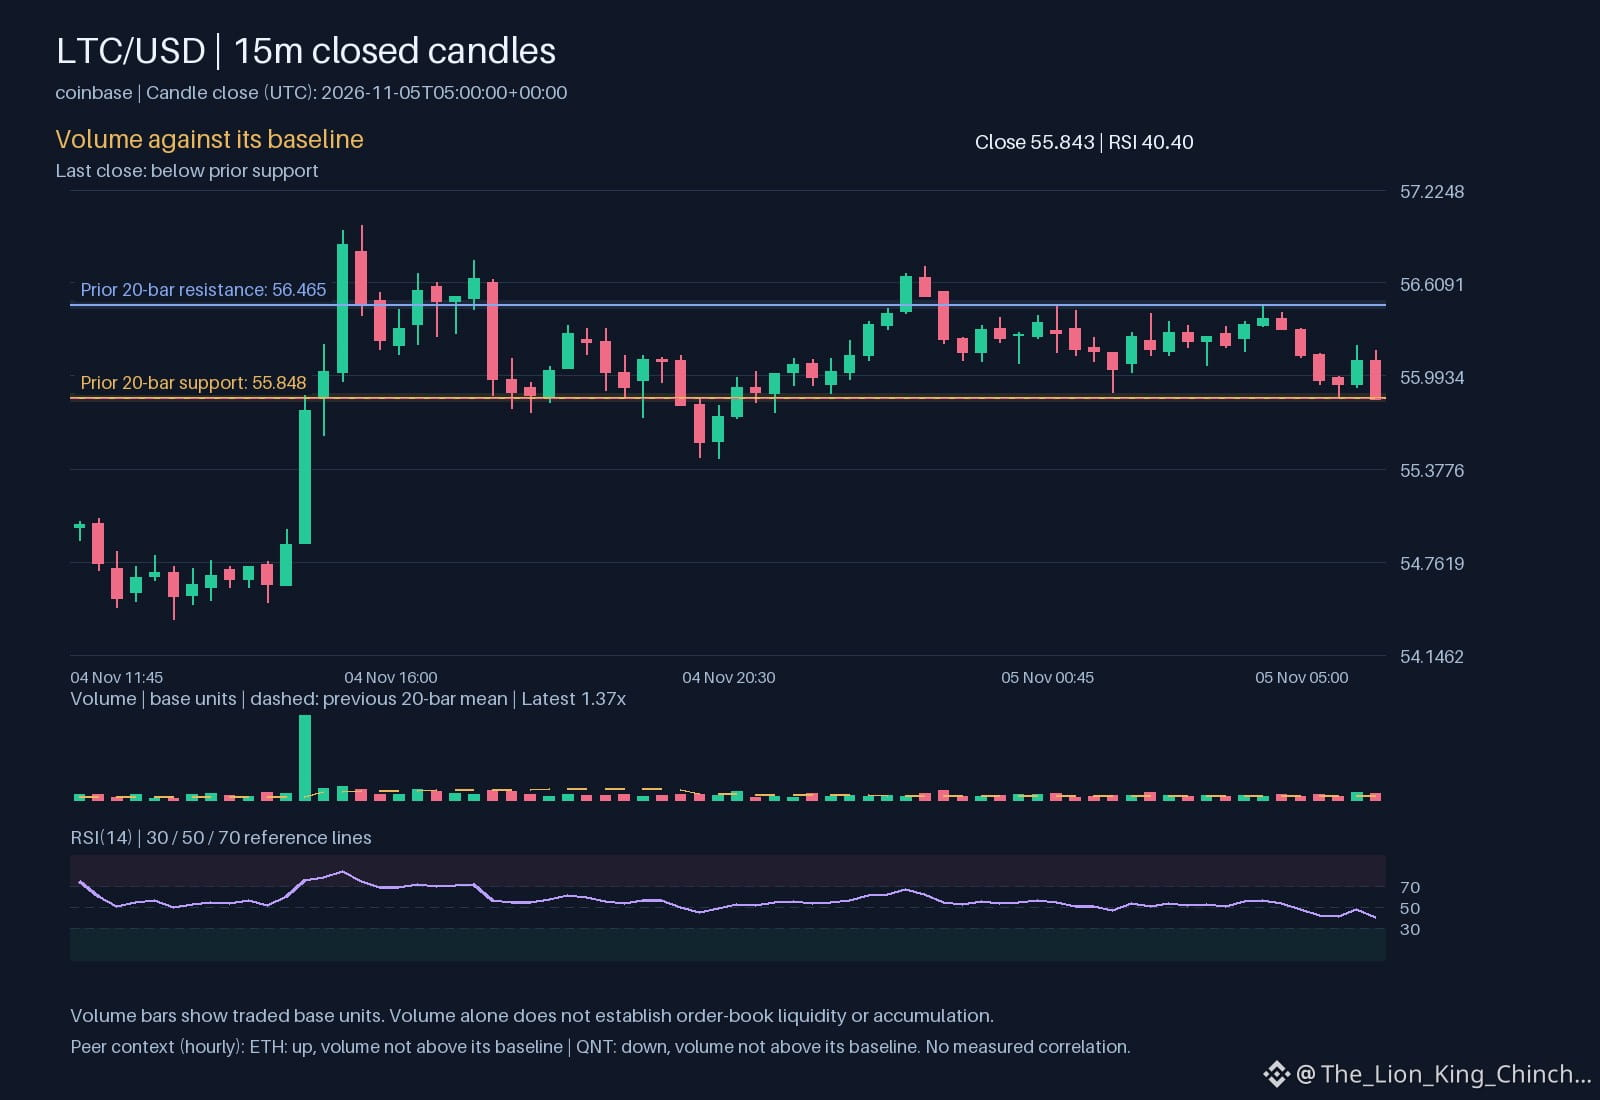
$LTC: LTC Moves Down While Peers Split: What Holds More Weight?
LTC is trading below its recent support level and the hourly direction is down, with volume running above its baseline. This pattern suggests pressure but does not guarantee a sustained decline.
When we look at ETH on the same exchange, the hourly direction is up while its volume stays near normal levels. The upward bias for ETH is not reinforced by strong buying pressure, so the move may lack conviction. In contrast, QNT also shows a down hourly direction, yet its volume does not rise above baseline, indicating weaker participation in the sell side.
The key difference between these assets lies in how volume interacts with direction. For LTC, the combination of a down move and elevated volume points to a more decisive shift, whereas ETH’s up move without volume lift may stall, and QNT’s down move without volume support may reverse.
Understanding this helps separate direction from the quality of the move. A practical step is to monitor the next hourly candle for LTC: if price stays below support while volume remains high, the downside bias strengthens; if volume eases, the move may lose steam. 📊
Probabilistic market research, not a recommendation or guaranteed return.
The comparison to keep in mind: $ETH has hourly direction up and volume not above its baseline; $QNT has hourly direction down and volume not above its baseline. This alone does not establish correlation.
Which matters more in this comparison: direction or how the move holds?
#LTC
$LTC : LTC Moves Down While Peers Split: What Holds More Weight?
LTC is trading below its recent support level and the hourly direction is down, with volume running above its baseline. This pattern suggests pressure but does not guarantee a sustained decline.
When we look at ETH on the same exchange, the hourly direction is up while its volume stays near normal levels. The upward bias for ETH is not reinforced by strong buying pressure, so the move may lack conviction. In contrast, QNT also shows a down hourly direction, yet its volume does not rise above baseline, indicating weaker participation in the sell side.
The key difference between these assets lies in how volume interacts with direction. For LTC, the combination of a down move and elevated volume points to a more decisive shift, whereas ETH’s up move without volume lift may stall, and QNT’s down move without volume support may reverse.
Understanding this helps separate direction from the quality of the move. A practical step is to monitor the next hourly candle for LTC: if price stays below support while volume remains high, the downside bias strengthens; if volume eases, the move may lose steam. 📊
Probabilistic market research, not a recommendation or guaranteed return.
The comparison to keep in mind: $ETH has hourly direction up and volume not above its baseline; $QNT has hourly direction down and volume not above its baseline. This alone does not establish correlation.
Which matters more in this comparison: direction or how the move holds?
#LTC
LTC is trading below its recent support level and the hourly direction is down, with volume running above its baseline. This pattern suggests pressure but does not guarantee a sustained decline.
When we look at ETH on the same exchange, the hourly direction is up while its volume stays near normal levels. The upward bias for ETH is not reinforced by strong buying pressure, so the move may lack conviction. In contrast, QNT also shows a down hourly direction, yet its volume does not rise above baseline, indicating weaker participation in the sell side.
The key difference between these assets lies in how volume interacts with direction. For LTC, the combination of a down move and elevated volume points to a more decisive shift, whereas ETH’s up move without volume lift may stall, and QNT’s down move without volume support may reverse.
Understanding this helps separate direction from the quality of the move. A practical step is to monitor the next hourly candle for LTC: if price stays below support while volume remains high, the downside bias strengthens; if volume eases, the move may lose steam. 📊
Probabilistic market research, not a recommendation or guaranteed return.
The comparison to keep in mind: $ETH has hourly direction up and volume not above its baseline; $QNT has hourly direction down and volume not above its baseline. This alone does not establish correlation.
Which matters more in this comparison: direction or how the move holds?
#LTC
42

·
--
Bullish
$LTC long — Targeting $78 on a $70 reclaim 🚀
LTC is holding the $65 support zone steadily and building momentum. A clean 4H close above the $70 psychological resistance level will confirm the breakout and open the path toward the next major resistance zone.
Entry: 4H close above $70
SL: Below $65
Target 1: $75
Target 2: $78
If $65 breaks down, the setup is invalid — cut your losses.
$LTC
{future}(LTCUSDT)
DYOR. NFA.
#LTC #Litecoin #TradeIdea
$LTC long — Targeting $78 on a $70 reclaim 🚀
LTC is holding the $65 support zone steadily and building momentum. A clean 4H close above the $70 psychological resistance level will confirm the breakout and open the path toward the next major resistance zone.
Entry: 4H close above $70
SL: Below $65
Target 1: $75
Target 2: $78
If $65 breaks down, the setup is invalid — cut your losses.
$LTC
DYOR. NFA.
#LTC #Litecoin #TradeIdea
LTC is holding the $65 support zone steadily and building momentum. A clean 4H close above the $70 psychological resistance level will confirm the breakout and open the path toward the next major resistance zone.
Entry: 4H close above $70
SL: Below $65
Target 1: $75
Target 2: $78
If $65 breaks down, the setup is invalid — cut your losses.
$LTC
DYOR. NFA.
#LTC #Litecoin #TradeIdea
177

·
--
Bullish
$LTC
{future}(LTCUSDT)
LTCUSDT — LONG SETUP
$56.17
Margin: Isolated
Timeframe: 4H
Market idea: Pullback toward the 50 EMA.
Entry zone: $55.50–$56.20
Confirmation: 50 EMA support holds and price closes bullish.
Stop-loss: $54.60
TP1: $57.10
TP2: $58.20
TP3: $59.50
Invalidation: 4H close below $54.60.
#LTC #LTCPricePrediction #LUNA #Xrp🔥🔥 #BTC
$LTC
LTCUSDT — LONG SETUP
$56.17
Margin: Isolated
Timeframe: 4H
Market idea: Pullback toward the 50 EMA.
Entry zone: $55.50–$56.20
Confirmation: 50 EMA support holds and price closes bullish.
Stop-loss: $54.60
TP1: $57.10
TP2: $58.20
TP3: $59.50
Invalidation: 4H close below $54.60.
#LTC #LTCPricePrediction #LUNA #Xrp🔥🔥 #BTC
LTCUSDT — LONG SETUP
$56.17
Margin: Isolated
Timeframe: 4H
Market idea: Pullback toward the 50 EMA.
Entry zone: $55.50–$56.20
Confirmation: 50 EMA support holds and price closes bullish.
Stop-loss: $54.60
TP1: $57.10
TP2: $58.20
TP3: $59.50
Invalidation: 4H close below $54.60.
#LTC #LTCPricePrediction #LUNA #Xrp🔥🔥 #BTC
33
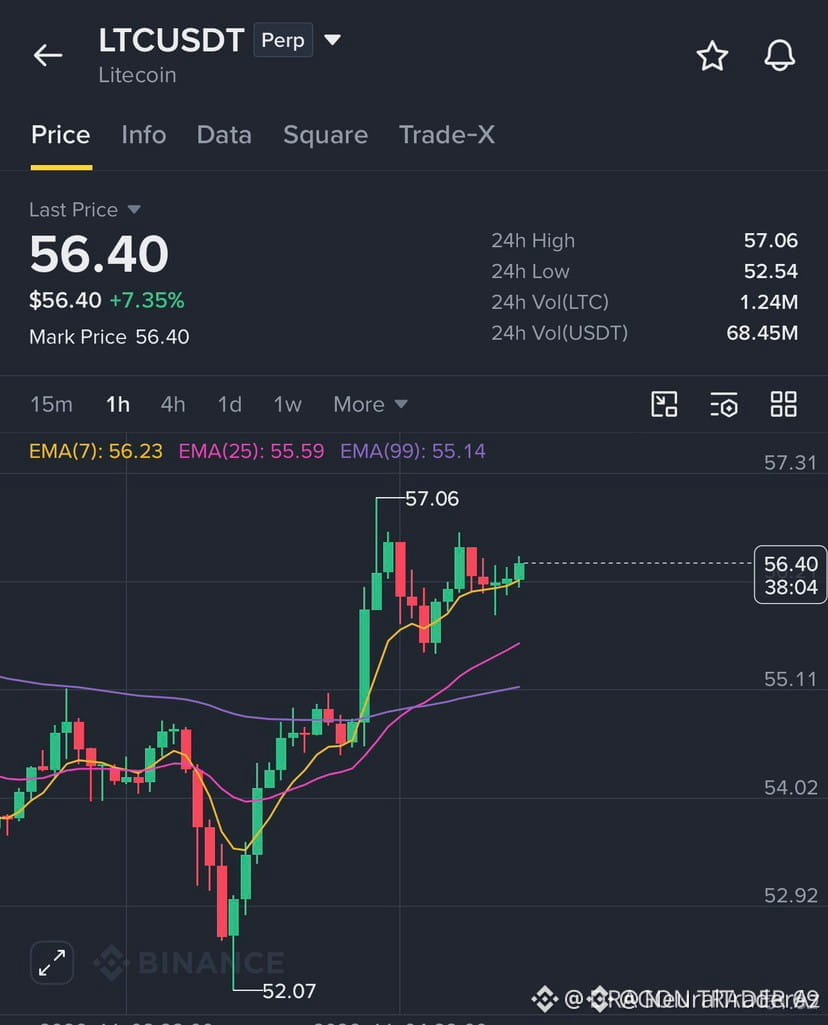
🚀 $LTC EYES $62 BREAKOUT – BULLS IN CONTROL
Entry: $55-$56 ⚡
Target: $62 🚀
Stop Loss: $53 ⚠️
📊 The $55‑$56 zone has acted as a liquidity sink, swallowing sell pressure and forming a robust order block. Smart money is now re‑stacking, and volume spikes confirm the bullish bias. 📌 Buyers are eyeing the $58 and $60 clusters as stepping stones, each acting as a micro‑liquidity pool before the final push to $62. 🌊 Manage each leg meticulously to lock in risk‑adjusted gains.
💬 How are you scaling into this laddered LTC rally? 👇
⚠️ Not financial advice. Always manage your risk. 🛡️
🏷️ #LTC #LongSetup #Breakout #Crypto
🔥 💎
🚀 $LTC EYES $62 BREAKOUT – BULLS IN CONTROL
Entry: $55-$56 ⚡
Target: $62 🚀
Stop Loss: $53 ⚠️
📊 The $55‑$56 zone has acted as a liquidity sink, swallowing sell pressure and forming a robust order block. Smart money is now re‑stacking, and volume spikes confirm the bullish bias. 📌 Buyers are eyeing the $58 and $60 clusters as stepping stones, each acting as a micro‑liquidity pool before the final push to $62. 🌊 Manage each leg meticulously to lock in risk‑adjusted gains.
💬 How are you scaling into this laddered LTC rally? 👇
⚠️ Not financial advice. Always manage your risk. 🛡️
🏷️ #LTC #LongSetup #Breakout #Crypto
🔥 💎
Entry: $55-$56 ⚡
Target: $62 🚀
Stop Loss: $53 ⚠️
📊 The $55‑$56 zone has acted as a liquidity sink, swallowing sell pressure and forming a robust order block. Smart money is now re‑stacking, and volume spikes confirm the bullish bias. 📌 Buyers are eyeing the $58 and $60 clusters as stepping stones, each acting as a micro‑liquidity pool before the final push to $62. 🌊 Manage each leg meticulously to lock in risk‑adjusted gains.
💬 How are you scaling into this laddered LTC rally? 👇
⚠️ Not financial advice. Always manage your risk. 🛡️
🏷️ #LTC #LongSetup #Breakout #Crypto
🔥 💎
5

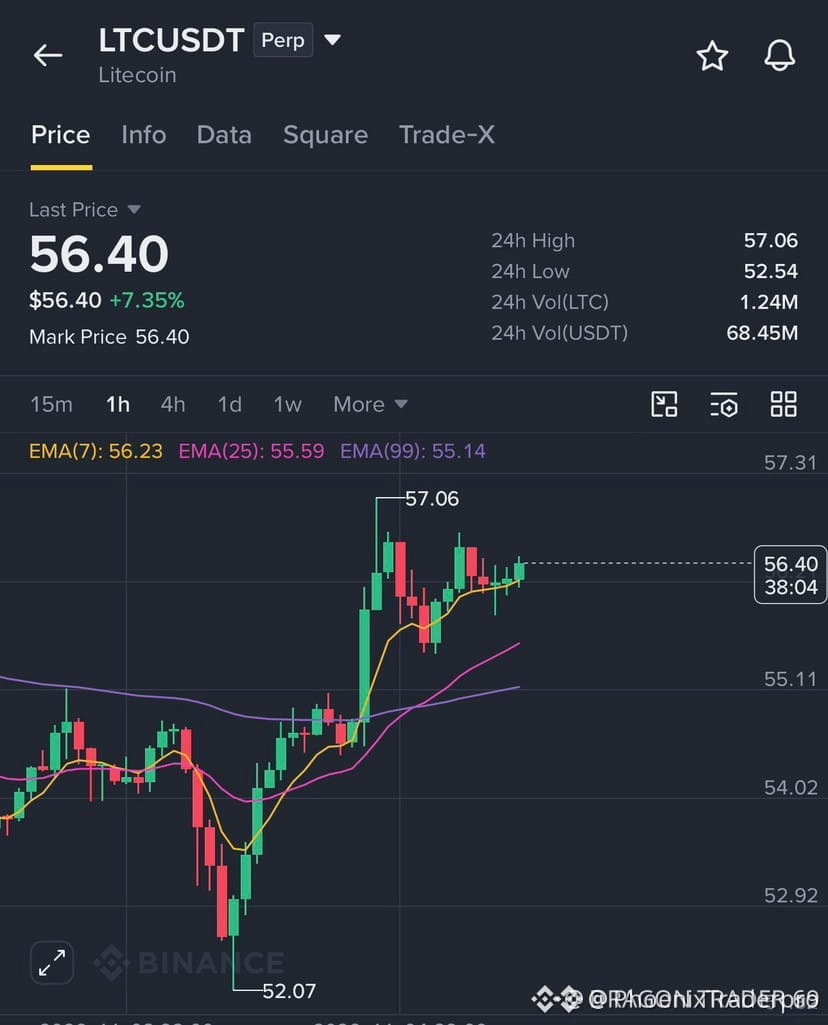
🚀 $LTC CHARGING TOWARD $62 BREAKOUT! 🟢
Entry: 55-56 ⚡
Target: 58/60/62 🎯
Stop Loss: 53 ⚠️
📊 Smart money has been hoarding liquidity around the $55‑$56 block, and the recent volume surge is flushing out the last of the sell wall. ⚡ As buyers lock in the $58 and $60 zones, the order flow flips, setting the stage for a final push to $62. 🌊
💡 Manage each profit tier step‑by‑step and keep the stop tight at $53 to protect against a sudden reversal. 📌 Patience and disciplined scaling will let you capture the full upside. 💬 Who's ready to ride this LTC surge? 👇
⚠️ Not financial advice. Always manage your risk. 🛡️
🏷️ #LTC #LongSetup #Breakout #Crypto
🔥 💎
🚀 $LTC CHARGING TOWARD $62 BREAKOUT! 🟢
Entry: 55-56 ⚡
Target: 58/60/62 🎯
Stop Loss: 53 ⚠️
📊 Smart money has been hoarding liquidity around the $55‑$56 block, and the recent volume surge is flushing out the last of the sell wall. ⚡ As buyers lock in the $58 and $60 zones, the order flow flips, setting the stage for a final push to $62. 🌊
💡 Manage each profit tier step‑by‑step and keep the stop tight at $53 to protect against a sudden reversal. 📌 Patience and disciplined scaling will let you capture the full upside. 💬 Who's ready to ride this LTC surge? 👇
⚠️ Not financial advice. Always manage your risk. 🛡️
🏷️ #LTC #LongSetup #Breakout #Crypto
🔥 💎
Entry: 55-56 ⚡
Target: 58/60/62 🎯
Stop Loss: 53 ⚠️
📊 Smart money has been hoarding liquidity around the $55‑$56 block, and the recent volume surge is flushing out the last of the sell wall. ⚡ As buyers lock in the $58 and $60 zones, the order flow flips, setting the stage for a final push to $62. 🌊
💡 Manage each profit tier step‑by‑step and keep the stop tight at $53 to protect against a sudden reversal. 📌 Patience and disciplined scaling will let you capture the full upside. 💬 Who's ready to ride this LTC surge? 👇
⚠️ Not financial advice. Always manage your risk. 🛡️
🏷️ #LTC #LongSetup #Breakout #Crypto
🔥 💎
7
Log in to explore more content
Join global crypto users on Binance Square
⚡️ Get latest and useful information about crypto.
💬 Trusted by the world’s largest crypto exchange.
👍 Discover real insights from verified creators.
Email / Phone number
Trending Topics
1
#BinanceReopensWithdrawalsForMoreAssets
771,575 views
4,273 Discussing
2
#Binance98PercentReplenished
142,154 views
1,652 Discussing
3
#USStocksSlipandCryptoMarketUnderBroadPressure
507 views
96 Discussing
4
#StrategySTRCResumesIssuanceAfterOver170Days
13,313 views
334 Discussing
5
#ADPUSPrivateEmployersAdd86000JobsInOctober
28,780 views
499 Discussing
6
#KazakhstanReportedlyInvests$100MInCryptoFunds
1,168 views
42 Discussing
7
#SouthKoreaSeeksCryptoTaxDelayUntil2029
16,885 views
219 Discussing
8
#USMidterms-WhatAreMarketsExpecting?
577,198 views
2,817 Discussing
9
#US10YearTreasuryYieldFallsTo4.845%
18,857 views
165 Discussing
10
#ZcashExpectsNU7ToMake$16MSproutZECInaccessible
1,204 views
18 Discussing