Binance Square
#cryptoanalysis

cryptoanalysis

27.7M views
107,190 Discussing
Nurul Hasnat Samir
·
--
Ethereum ($ETH H) Price Analysis: How High or Low Could It Go? 📊 ​Ethereum ($ETH ) is currently sitting at a critical crossroads in the market. Here is a breakdown of potential resistance and support levels based on key technical and macroeconomic factors. ​📈 Bullish Scenario (Upside Targets): ​1️⃣ First Target ($2,760 - $2,800): If ETH manages to break out of its current resistance zone, it could quickly test the $2,760 to $2,800 range in the short term. 2️⃣ Major Target ($3,000+): Continued institutional inflows into Spot ETH ETFs alongside favorable rate cuts by the Federal Reserve could push ETH toward the psychological $3,000 mark. ​📉 Bearish Scenario (Downside Supports): ​1️⃣ Immediate Support ($2,350 - $2,400): In the event of a market pull-back, ETH has strong underlying support sitting between $2,350 and $2,400. 2️⃣ Key Support Zone ($2,200): Broader macroeconomic uncertainty or heavy selling pressure could draw prices down to test the major $2,200 support level. ​💡 Key Market Catalysts: ​Fed Interest Rate Decisions: Central bank monetary policy directly impacts sentiment across risk assets, including crypto. ​Layer-2 & RWA Adoption: Growing utilization of Layer-2 networks and Real-World Asset tokenization continues to build strong long-term value for Ethereum. ​Global Regulatory Updates: Evolving regulatory guidelines remain a key driver of market volatility. ​⚠️ Trading Tip: During volatile market conditions, always utilize Stop-Loss orders and consider adopting a DCA (Dollar-Cost Averaging) strategy on Binance to protect your capital. ​#BinanceSquareFamily #Ethereum #CryptoAnalysis #BinanceP2P #dyor {spot}(ETHUSDT)
Ethereum ($ETH H) Price Analysis: How High or Low Could It Go? 📊
​Ethereum ($ETH ) is currently sitting at a critical crossroads in the market. Here is a breakdown of potential resistance and support levels based on key technical and macroeconomic factors.
​📈 Bullish Scenario (Upside Targets):
​1️⃣ First Target ($2,760 - $2,800): If ETH manages to break out of its current resistance zone, it could quickly test the $2,760 to $2,800 range in the short term.
2️⃣ Major Target ($3,000+): Continued institutional inflows into Spot ETH ETFs alongside favorable rate cuts by the Federal Reserve could push ETH toward the psychological $3,000 mark.
​📉 Bearish Scenario (Downside Supports):
​1️⃣ Immediate Support ($2,350 - $2,400): In the event of a market pull-back, ETH has strong underlying support sitting between $2,350 and $2,400.
2️⃣ Key Support Zone ($2,200): Broader macroeconomic uncertainty or heavy selling pressure could draw prices down to test the major $2,200 support level.
​💡 Key Market Catalysts:
​Fed Interest Rate Decisions: Central bank monetary policy directly impacts sentiment across risk assets, including crypto.
​Layer-2 & RWA Adoption: Growing utilization of Layer-2 networks and Real-World Asset tokenization continues to build strong long-term value for Ethereum.
​Global Regulatory Updates: Evolving regulatory guidelines remain a key driver of market volatility.
​⚠️ Trading Tip:
During volatile market conditions, always utilize Stop-Loss orders and consider adopting a DCA (Dollar-Cost Averaging) strategy on Binance to protect your capital.
#BinanceSquareFamily #Ethereum #CryptoAnalysis
#BinanceP2P #dyor
📊 INSTITUTIONAL METRICS: Critical Liquidity Shift Detected The broader crypto market structure is undergoing a rapid transition. Bitcoin ( $BTC ) is consolidating heavily within the $85,600 – $86,200 liquidity pocket, signaling a major macro move. 🔑 Key Real-Time Levels: Institutional ETF Support: $81,722 (Strong Cost Basis) Macro Annual Open Resistance: $87,498 (Key Target) Derivatives Momentum: Over $1.7B+ in aggregate spot volume shifting away from leverage. 📈 The Analysis: Data reveals this consolidation is structurally healthy. Persistent Spot ETF inflows are actively buying up short-term selling pressure, preventing a deeper macro correction. The real test lies at the $87,498 open marker—a sustained daily close above this level triggers algorithmic trend followers to ramp up spot exposure across alternative Layer-1 networks. Tactical Play: Manage downside parameters tightly relative to the ETF cost floor. Avoid chasing aggressive volatility inside localized ranges. 💬 Your Strategy? Are we sweeping the $81,722 support liquidity first, or breaking straight through to $87,500? Drop your technical thoughts below! 👇 For premium technical setups, live order-book imbalances, and exclusive updates, follow my profile. #bitcoin #CryptoAnalysis #BinanceSquareFamily #Web3 #MacroStrategy
📊 INSTITUTIONAL METRICS: Critical Liquidity Shift Detected

The broader crypto market structure is undergoing a rapid transition. Bitcoin ( $BTC ) is consolidating heavily within the $85,600 – $86,200 liquidity pocket, signaling a major macro move.

🔑 Key Real-Time Levels:

Institutional ETF Support: $81,722 (Strong Cost Basis)

Macro Annual Open Resistance: $87,498 (Key Target)

Derivatives Momentum: Over $1.7B+ in aggregate spot volume shifting away from leverage.

📈 The Analysis:

Data reveals this consolidation is structurally healthy. Persistent Spot ETF inflows are actively buying up short-term selling pressure, preventing a deeper macro correction. The real test lies at the $87,498 open marker—a sustained daily close above this level triggers algorithmic trend followers to ramp up spot exposure across alternative Layer-1 networks.

Tactical Play: Manage downside parameters tightly relative to the ETF cost floor. Avoid chasing aggressive volatility inside localized ranges.

💬 Your Strategy? Are we sweeping the $81,722 support liquidity first, or breaking straight through to $87,500? Drop your technical thoughts below!

👇 For premium technical setups, live order-book imbalances, and exclusive updates, follow my profile.

#bitcoin #CryptoAnalysis #BinanceSquareFamily #Web3 #MacroStrategy
Article
Institutional Insight: Decoding BTC's New Floor & Q3 Macro ShiftsThe global digital asset landscape is undergoing a significant institutional recalibration as Bitcoin (BTC) hovers around the $85,600 to $86,200 liquidity cluster. Leading desk analysts confirm that the current price action marks a structural transition from retail-driven speculation to highly coordinated, macro-driven capital allocation. 📊 MARKET STRUCTURE MONITOR Bitcoin Spot Price (BTC): ~$85,686Institutional ETF Cost Basis: $81,722Macro Annual Target Level: $87,49810-Year U.S. Treasury Yield: 4.96%Federal Reserve Target Rate: 3.75% – 4.00% 🚀 The Catalyst Matrix: Spot Aggression & Strategic Partnerships The ETF Cost-Basis Floor: Institutional flow dynamics reveal that the aggregate cost basis for US Spot ETF participants is deeply anchored at $81,722. This specific liquidity band serves as a critical macroeconomic invalidation line. As long as the spot price holds above this parameter, institutional risk desks remain net-long, effectively turning a major psychological resistance point into structural support. Short-Squeeze Mechanics vs. Genuine Demand: On-chain data engine metrics verify that the recent upside momentum was catalyzed by record single-day Spot ETF inflows ($999M+) colliding with a dense cluster of over-leveraged short contracts. This short squeeze effectively cleared overhead ask liquidity, indicating that systemic spot accumulation is dominating derivative-based suppression. Tokenized Legacy Equity Integration: Adding major structural tailwinds to the broader Web3 ecosystem, the New York Stock Exchange (NYSE) and Blockchain.com have officially announced a joint venture to explore the issuance of blockchain-native tokenized versions of US-listed blue-chip stocks. This integration is heavily driving institutional capital confidence into EVM and alternative Layer-1 settlement layers. ⚠️ Risk Factors & Tactical Allocation Strategy Despite the overwhelmingly bullish long-term structure, high-class trading desks are closely monitoring macroeconomic headwinds. The Federal Reserve's recent adjustment of interest rates to the 3.75%–4.00% target range, paired with the 10-year Treasury yield pressing hard near 4.96%, continues to exert capital competition on non-yielding risk assets. Furthermore, the recent procedural stalling of the CLARITY Act in the Senate means regulatory implementations will remain fragmented through the close of the quarter. Tactical Playbook: Avoid chasing high-beta momentum inside overextended short-term liquidation zones. The premium approach remains systematically compounding positions on structural retests of the exponential moving averages (EMAs) and managing strict downside protection relative to the annual open target of $87,498. 💬 Macro Sentiment Check: With institutional spot inflows continuously offsetting treasury yields, do you anticipate a clean monthly close above the $87,498 annual open? Or will macro legislative delays trigger a sweep of the $81,722 ETF cost-basis liquidity? Share your structured analysis below. 👇 For premium technical setups, real-time order-book depth analysis, and institutional alpha alerts, click to follow my profile. #bitcoin #CryptoAnalysis #Web3 #BinanceSquare #MacroStrategy

Institutional Insight: Decoding BTC's New Floor & Q3 Macro Shifts

The global digital asset landscape is undergoing a significant institutional recalibration as Bitcoin (BTC) hovers around the $85,600 to $86,200 liquidity cluster. Leading desk analysts confirm that the current price action marks a structural transition from retail-driven speculation to highly coordinated, macro-driven capital allocation.
📊 MARKET STRUCTURE MONITOR
Bitcoin Spot Price (BTC): ~$85,686Institutional ETF Cost Basis: $81,722Macro Annual Target Level: $87,49810-Year U.S. Treasury Yield: 4.96%Federal Reserve Target Rate: 3.75% – 4.00%
🚀 The Catalyst Matrix: Spot Aggression & Strategic Partnerships
The ETF Cost-Basis Floor: Institutional flow dynamics reveal that the aggregate cost basis for US Spot ETF participants is deeply anchored at $81,722. This specific liquidity band serves as a critical macroeconomic invalidation line. As long as the spot price holds above this parameter, institutional risk desks remain net-long, effectively turning a major psychological resistance point into structural support.
Short-Squeeze Mechanics vs. Genuine Demand: On-chain data engine metrics verify that the recent upside momentum was catalyzed by record single-day Spot ETF inflows ($999M+) colliding with a dense cluster of over-leveraged short contracts. This short squeeze effectively cleared overhead ask liquidity, indicating that systemic spot accumulation is dominating derivative-based suppression.
Tokenized Legacy Equity Integration: Adding major structural tailwinds to the broader Web3 ecosystem, the New York Stock Exchange (NYSE) and Blockchain.com have officially announced a joint venture to explore the issuance of blockchain-native tokenized versions of US-listed blue-chip stocks. This integration is heavily driving institutional capital confidence into EVM and alternative Layer-1 settlement layers.
⚠️ Risk Factors & Tactical Allocation Strategy
Despite the overwhelmingly bullish long-term structure, high-class trading desks are closely monitoring macroeconomic headwinds. The Federal Reserve's recent adjustment of interest rates to the 3.75%–4.00% target range, paired with the 10-year Treasury yield pressing hard near 4.96%, continues to exert capital competition on non-yielding risk assets.
Furthermore, the recent procedural stalling of the CLARITY Act in the Senate means regulatory implementations will remain fragmented through the close of the quarter.
Tactical Playbook: Avoid chasing high-beta momentum inside overextended short-term liquidation zones. The premium approach remains systematically compounding positions on structural retests of the exponential moving averages (EMAs) and managing strict downside protection relative to the annual open target of $87,498.
💬 Macro Sentiment Check: With institutional spot inflows continuously offsetting treasury yields, do you anticipate a clean monthly close above the $87,498 annual open? Or will macro legislative delays trigger a sweep of the $81,722 ETF cost-basis liquidity? Share your structured analysis below.
👇 For premium technical setups, real-time order-book depth analysis, and institutional alpha alerts, click to follow my profile.
#bitcoin #CryptoAnalysis #Web3 #BinanceSquare #MacroStrategy
🚨 ZEC surges past $1,600 as Europe’s first ZEC ETP launches, driving a 43% weekly gain—triple the broader market’s rise. Volume jumped to ~$1.77B daily, signaling strong institutional interest. This ETP debut could boost accessibility and demand for ZEC in regulated markets. Is this the start of sustained inflows into privacy-focused assets? #ETP $ZEC #TradingSignal #CryptoAnalysis
🚨 ZEC surges past $1,600 as Europe’s first ZEC ETP launches, driving a 43% weekly gain—triple the broader market’s rise. Volume jumped to ~$1.77B daily, signaling strong institutional interest. This ETP debut could boost accessibility and demand for ZEC in regulated markets. Is this the start of sustained inflows into privacy-focused assets? #ETP

$ZEC #TradingSignal #CryptoAnalysis
​Headline: The Big 3 Check-In: What’s Next for $BTC, ETH, and BNB? ​Wondering where the market is headed? If you hold the top three heavyweights, here is the core logic you need to watch right now: ​$BTC (The Anchor): Bitcoin is doing exactly what it was designed to do—acting as the ultimate safe haven and institutional magnet. As long as ETF inflows and macro fundamentals remain steady, BTC will continue to set the pace for the entire market. Watch the major support zones closely! ​$ETH (The Engine): Ethereum’s narrative is all about Layer-2 growth and network cash flow. With its deflationary burn mechanism and staking rewards, Ethereum remains the backbone of Web3. The key catalyst? Continued institutional adoption and scaling upgrades. ​$BNB (The Utility King): BNB isn't just a coin; it’s an ecosystem pass. Driven by BSC network activity, Launchpool farming rewards, and the quarterly auto-burns, BNB consistently proves its resilience. When the Binance ecosystem thrives, BNB flies. 🦅 ​💡 Trader Tip: BTC provides stability, ETH offers technological growth, and BNB brings exclusive ecosystem yields. Diversification across these three is the ultimate cheat code for surviving market volatility. ​Which of the Big 3 are you accumulating the most right now? Let me know in the comments! 👇 ​ #Ethereum #bnb #CryptoAnalysis #BinanceSquare #MarketUpdate {spot}(BTCUSDT) {spot}(BNBUSDT) {spot}(ETHUSDT)
​Headline: The Big 3 Check-In: What’s Next for $BTC , ETH, and BNB?
​Wondering where the market is headed? If you hold the top three heavyweights, here is the core logic you need to watch right now:
$BTC (The Anchor): Bitcoin is doing exactly what it was designed to do—acting as the ultimate safe haven and institutional magnet. As long as ETF inflows and macro fundamentals remain steady, BTC will continue to set the pace for the entire market. Watch the major support zones closely!
$ETH (The Engine): Ethereum’s narrative is all about Layer-2 growth and network cash flow. With its deflationary burn mechanism and staking rewards, Ethereum remains the backbone of Web3. The key catalyst? Continued institutional adoption and scaling upgrades.
$BNB (The Utility King): BNB isn't just a coin; it’s an ecosystem pass. Driven by BSC network activity, Launchpool farming rewards, and the quarterly auto-burns, BNB consistently proves its resilience. When the Binance ecosystem thrives, BNB flies. 🦅

​💡 Trader Tip: BTC provides stability, ETH offers technological growth, and BNB brings exclusive ecosystem yields. Diversification across these three is the ultimate cheat code for surviving market volatility.
​Which of the Big 3 are you accumulating the most right now? Let me know in the comments! 👇
#Ethereum #bnb #CryptoAnalysis #BinanceSquare #MarketUpdate
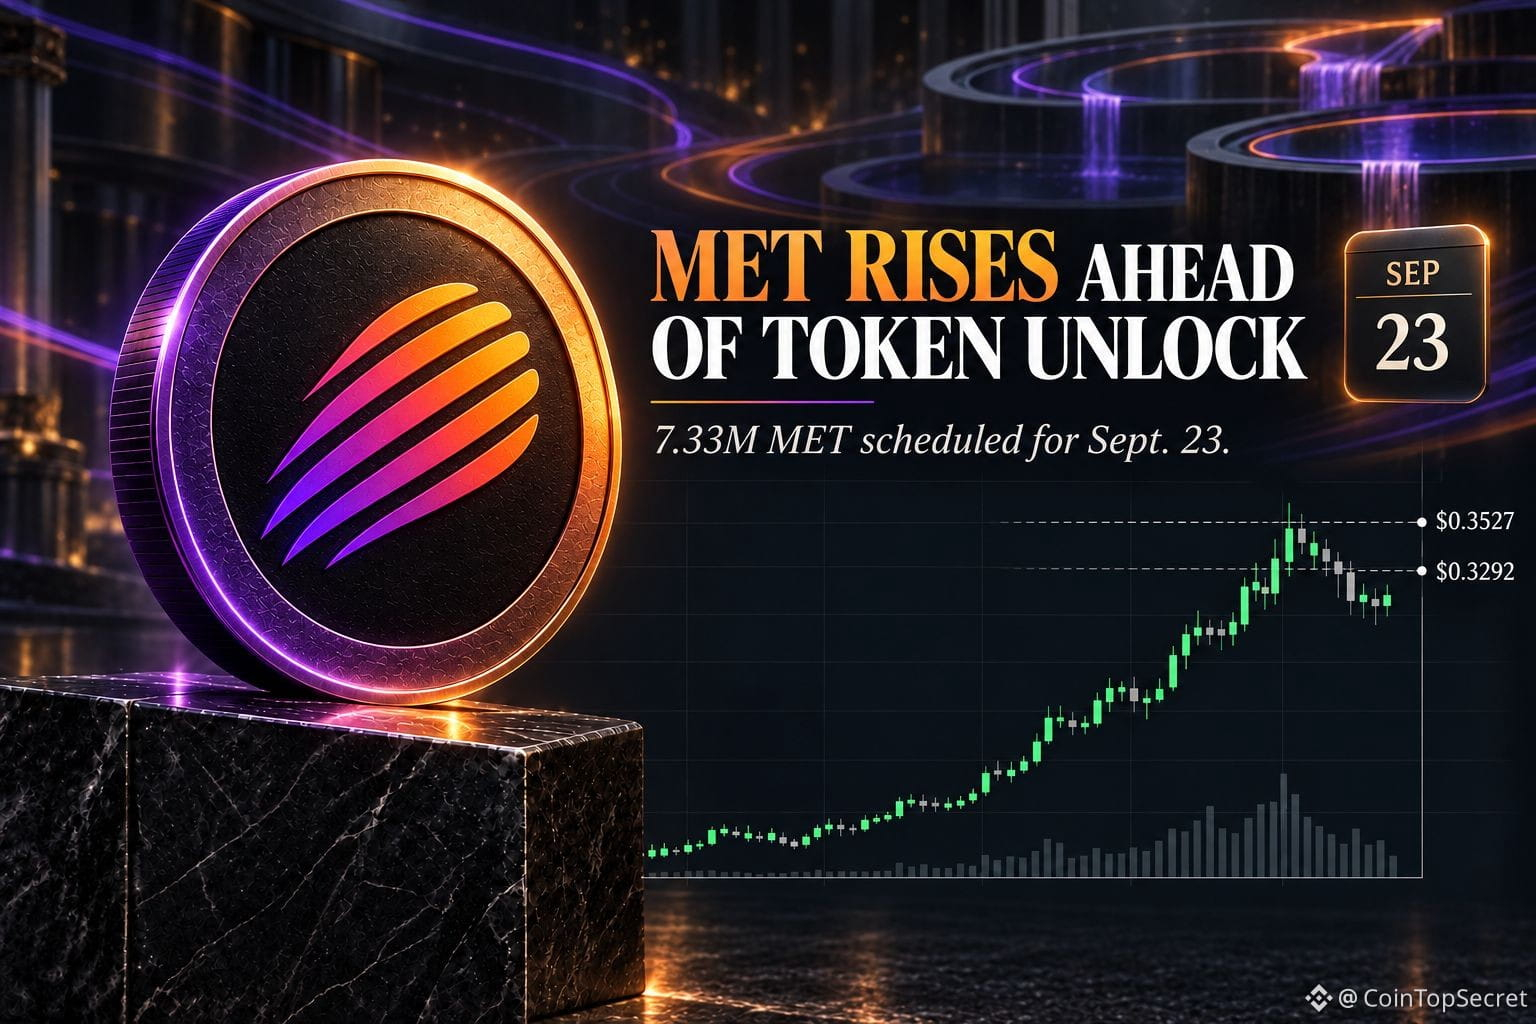
$MET Update 🔎 Can Meteora hold its gains ahead of a token unlock? 💰 Price now: $0.34902 | 24h: +24.85% 📊 Market cap: $192.53M | Rank: #197 📈 24h range: $0.2697–$0.3527 on MET/USDT 📰 What's happening: MET has climbed sharply, with approximately $36.25M in global 24-hour trading volume. The confirmed near-term event is a scheduled September 23 token unlock. There is no verified evidence that the unlock caused today’s rise. 🔥 Key catalyst: Approximately 7.33M MET is scheduled to unlock. An unlock increases available supply; it does not establish that those tokens will be sold. 👀 Next step to watch: 🔴 Bearish case: Below $0.3292, watch $0.3000. 🟢 Bullish case: Above $0.3527, watch the $0.3600 area. 📝 My take: The strong move and approaching unlock make the reaction around the recent high especially useful to watch. Not financial advice, DYOR ⚠️ #Meteora #MET #CryptoAnalysis $MET
$MET Update 🔎 Can Meteora hold its gains ahead of a token unlock?

💰 Price now: $0.34902 | 24h: +24.85%
📊 Market cap: $192.53M | Rank: #197
📈 24h range: $0.2697–$0.3527 on MET/USDT

📰 What's happening: MET has climbed sharply, with approximately $36.25M in global 24-hour trading volume. The confirmed near-term event is a scheduled September 23 token unlock. There is no verified evidence that the unlock caused today’s rise.

🔥 Key catalyst: Approximately 7.33M MET is scheduled to unlock. An unlock increases available supply; it does not establish that those tokens will be sold.

👀 Next step to watch:
🔴 Bearish case: Below $0.3292, watch $0.3000.
🟢 Bullish case: Above $0.3527, watch the $0.3600 area.

📝 My take: The strong move and approaching unlock make the reaction around the recent high especially useful to watch.

Not financial advice, DYOR ⚠️
#Meteora #MET #CryptoAnalysis $MET
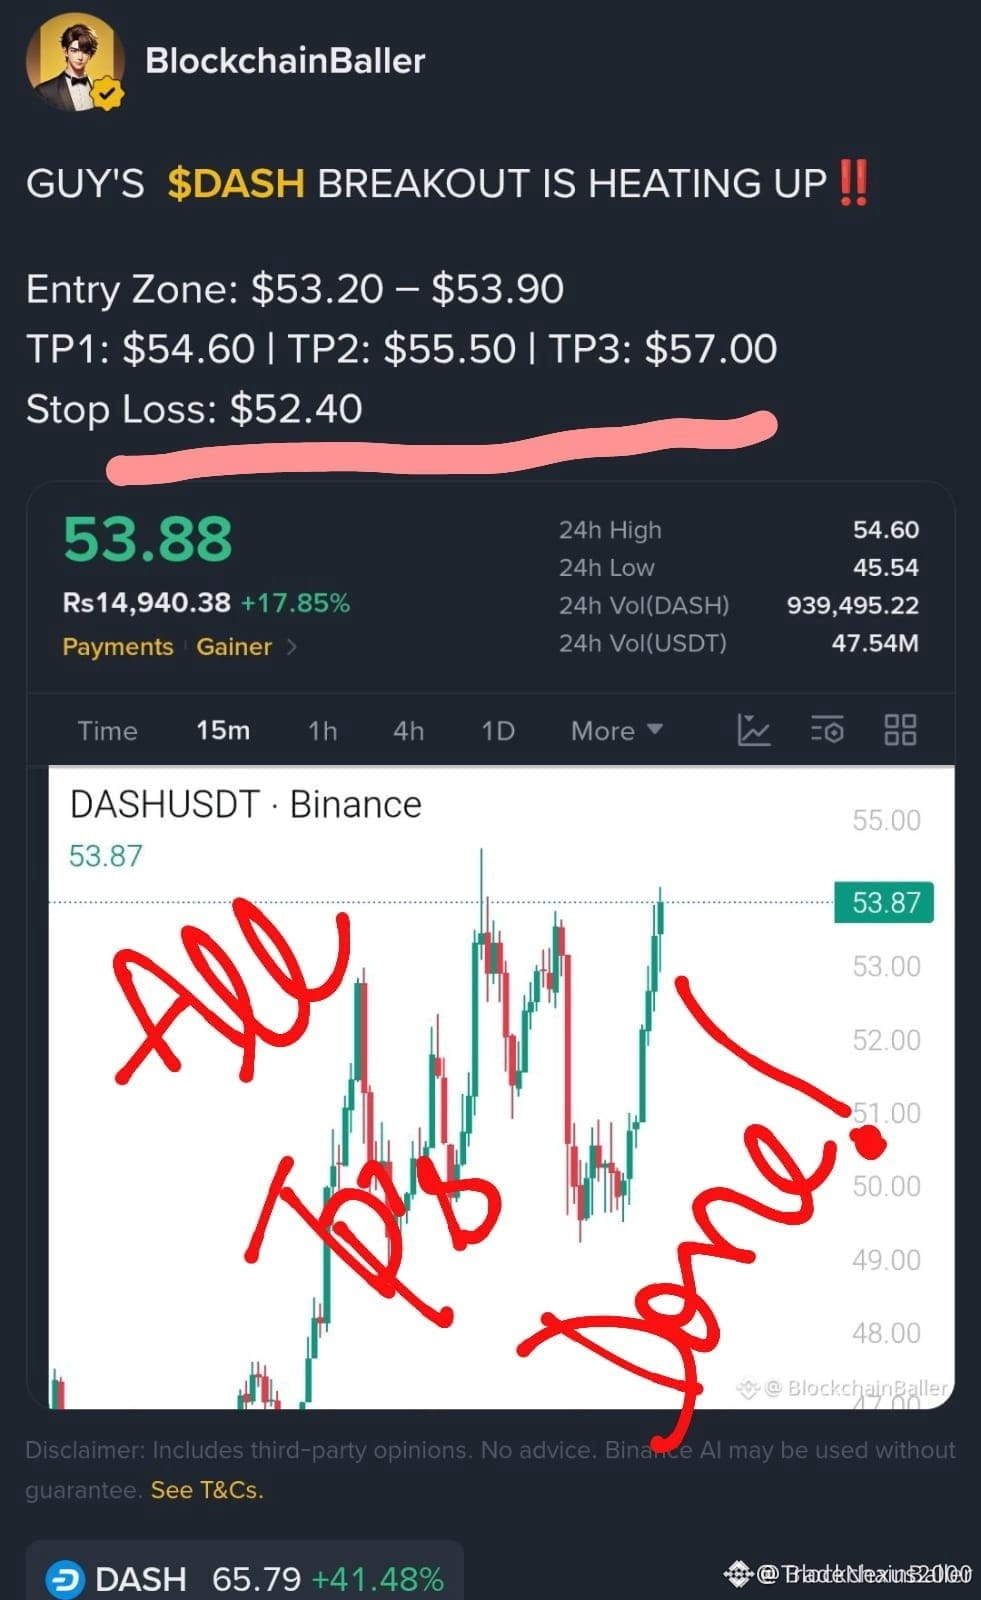
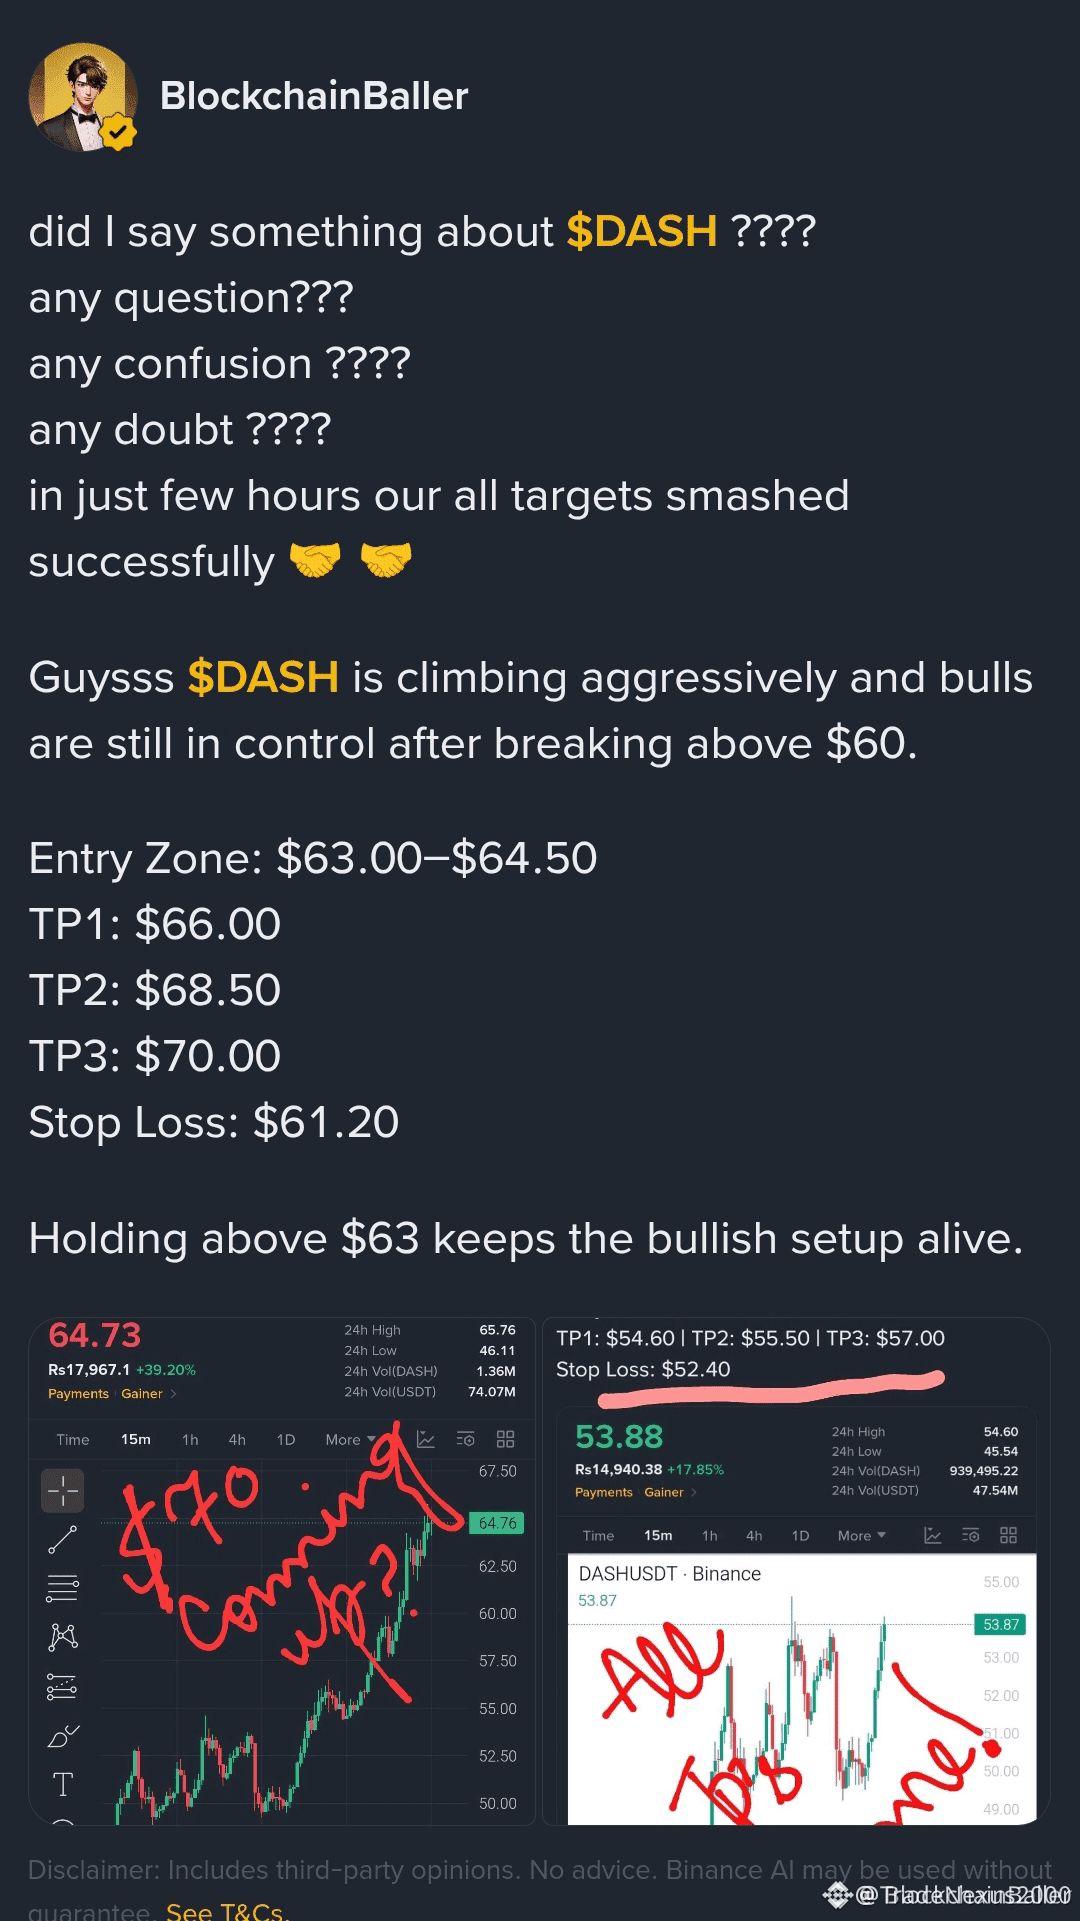
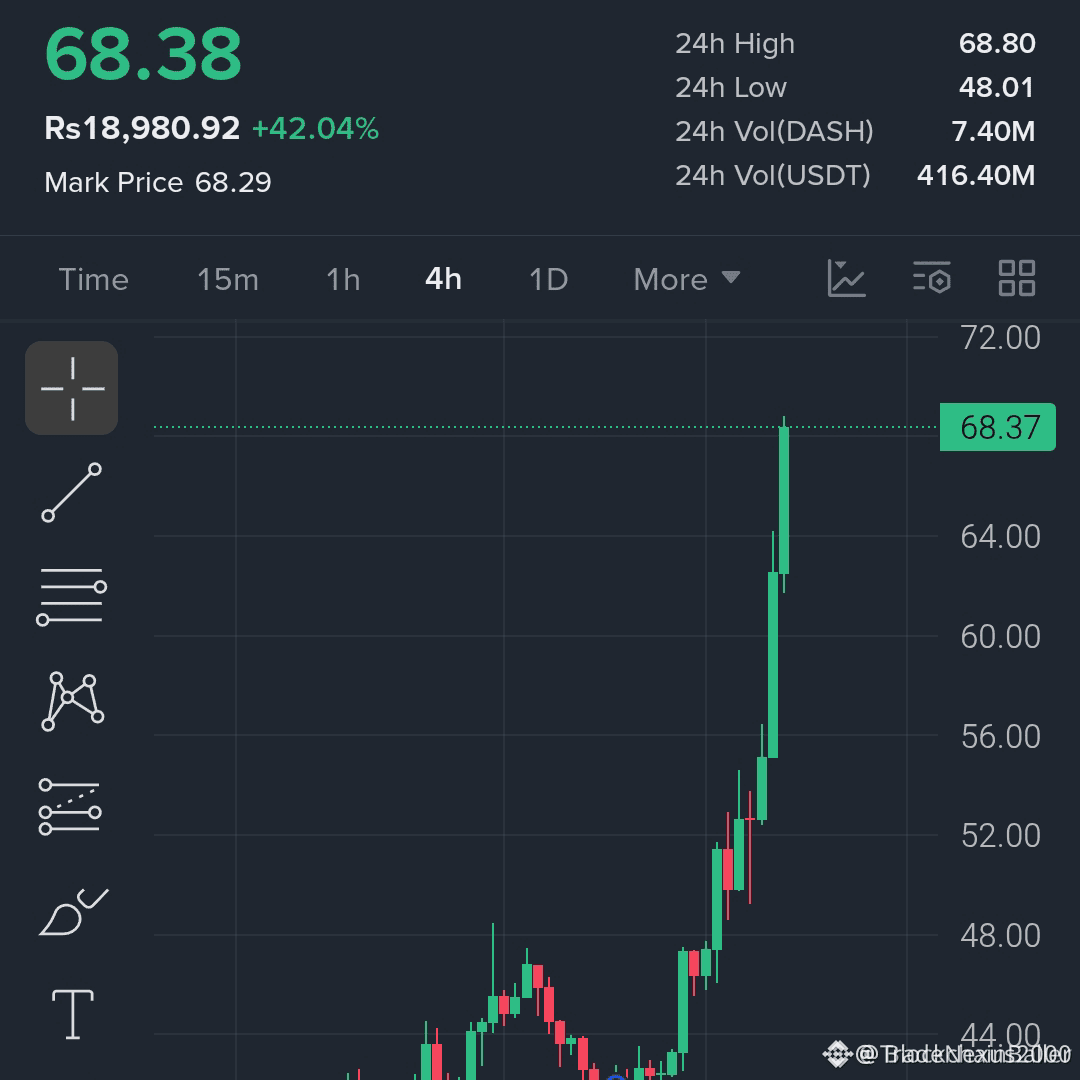
🚨 $DASH IMPULSIVE EXPANSION SMASHES KEY TARGETS AS BULLS TAKE CONTROL! 💥 Target: 70 🚀 Institutional momentum on $DASH has delivered a clean expansion phase, pushing price action through 66.00 and 68.50 with significant buying volume. The rapid rally toward 68.80 signals aggressive order flow clearing overhead liquidity inefficiencies. 📊 With primary structural objectives virtually secured, securing profits and trailing stop parameters is the disciplined play as price approaches the major 70.00 psychological supply block. 💡 Smart money manages exposure near exhaustion zones while retail chases momentum. ⚡ 💬 Are you locking in gains at these key structural levels, or holding out for a full sweep above 70.00? 👇 ⚠️ Not financial advice. Always manage your risk. 🛡️ 🏷️ #DASH #CryptoAnalysis #MarketStructure #TakeProfit 🎯 🦈
🚨 $DASH IMPULSIVE EXPANSION SMASHES KEY TARGETS AS BULLS TAKE CONTROL! 💥

Target: 70 🚀

Institutional momentum on $DASH has delivered a clean expansion phase, pushing price action through 66.00 and 68.50 with significant buying volume. The rapid rally toward 68.80 signals aggressive order flow clearing overhead liquidity inefficiencies. 📊

With primary structural objectives virtually secured, securing profits and trailing stop parameters is the disciplined play as price approaches the major 70.00 psychological supply block. 💡 Smart money manages exposure near exhaustion zones while retail chases momentum. ⚡

💬 Are you locking in gains at these key structural levels, or holding out for a full sweep above 70.00? 👇

⚠️ Not financial advice. Always manage your risk. 🛡️

🏷️ #DASH #CryptoAnalysis #MarketStructure #TakeProfit

🎯 🦈
Article
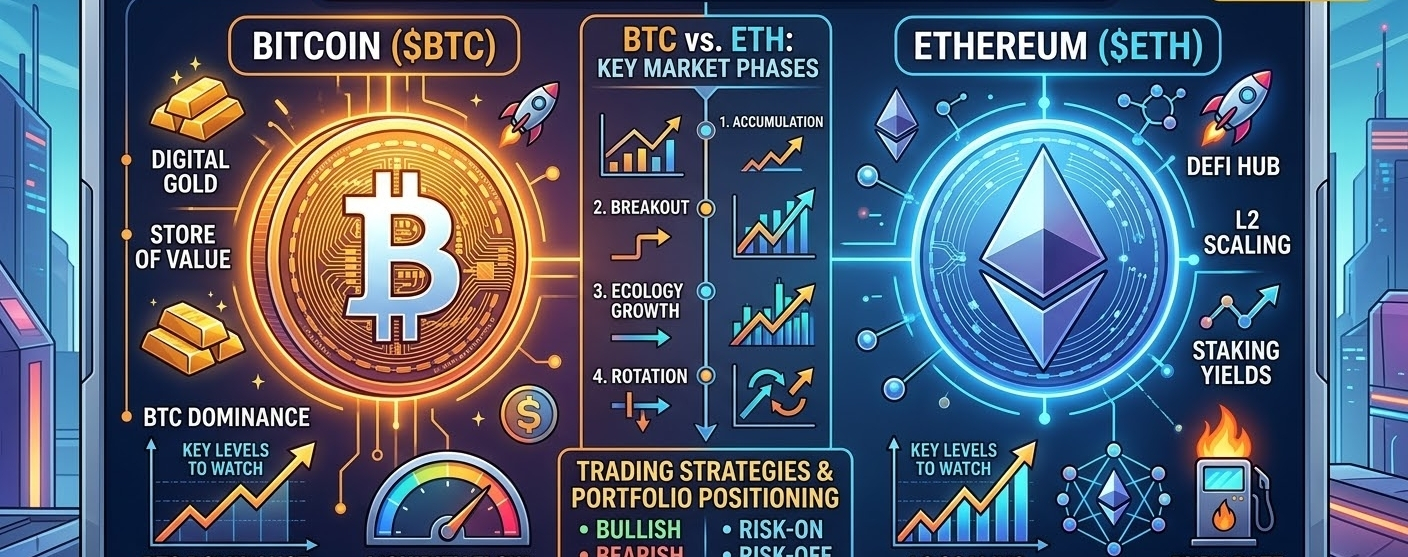
Watchout for the next big move on Btc and EthBTC vs ETH: Which Giant Will Drive the Next Market Move? 🚨📊 {future}(BTCUSDT) {future}(ETHUSDT) *​The crypto market is at a pivotal crossroads, and all eyes remain glued to the two heavyweights: $BTC and $ETH. Whether you are day trading spot pairs or managing long-term spot holdings, understanding the current macro dynamics between Bitcoin and Ethereum is critical for risk management. $BTC ​Here is a breakdown of what is driving price action for BTC/USDT and ETH/USDT, along with key technical levels to watch. ​1. Bitcoin ($BTC): Digital Gold Lead the Liquidity Flow ​Bitcoin continues to set the tempo for the broader market. When BTC consolidates, altcoins tend to find room to breathe; whenBTC experiences sharp volatility, liquidity rapidly pulls back into major pairs. ​Key Drivers: Institutional inflows through spot ETFs, global macroeconomic policy shifts, and systemic liquidity movements. ​Trading Strategy: ​Bullish Scenario: Look for sustained daily closes above immediate resistance to confirm momentum before entering breakout trades. ​Bearish/Correction Scenario: Watch major liquidity pools below recent swing lows for potential high-RR (risk-to-reward) long entries. ​💡 Pro Tip: Keep a close watch on BTC Dominance (BTC.D). High dominance alongside rising price means Bitcoin is absorbing all market capital. ​2. Ethereum ($ETH): Ecosystem Momentum & Network Activity ​Ethereum remains the foundation of DeFi, Layer-2 scaling solutions, and real-world asset (RWA) tokenization. While ETH often lagsBTC during initial market rallies, it historically catches up rapidly once capital rotates down the risk curve. ​Key Drivers: On-chain active addresses, L2 total value locked (TVL), network staking yields, and burn rates via EIP-1559. ​ETH/BTC Ratio: The $ETH / $BTC trading pair is currently testing major historical support. A strong bounce on ETH/BTC traditionally signals the start of an altcoin expansion phase. ​Trading Strategy: Monitor key moving averages (50 EMA & 200 EMA) on the 4-hour and daily charts to capture trend continuation setups. ​3. Strategic Outlook: How to Position Your Portfolio ​Risk-Off / Capital Preservation: Allocate heavier towards $BTC during periods of high macroeconomic uncertainty. ​Risk-On / Growth Phase: Shift partial exposure toward $ETH when Ethereum demonstrates relative strength over Bitcoin on high volume. ​💬 What is your strategy right now? Are you accumulating $BTC, stacking $ETH, or waiting on the sidelines for a clearer market signal? Drop your targets in the comments below! 👇 ​#CryptoAnalysis #BTC🔥🔥🔥🔥🔥 #ETH🔥🔥🔥🔥🔥🔥 #BinanceSquareFamily #Write2Earn ​Disclaimer: This content is for educational and informational purposes only and should not be construed as financial advice. Cryptocurrencies are highly volatile assets. Always conduct your own research (DYOR) and apply strict risk management before opening any position.

Watchout for the next big move on Btc and Eth

BTC vs ETH: Which Giant Will Drive the Next Market Move? 🚨📊
*​The crypto market is at a pivotal crossroads, and all eyes remain glued to the two heavyweights: $BTC and $ETH. Whether you are day trading spot pairs or managing long-term spot holdings, understanding the current macro dynamics between Bitcoin and Ethereum is critical for risk management.
$BTC
​Here is a breakdown of what is driving price action for BTC/USDT and ETH/USDT, along with key technical levels to watch.
​1. Bitcoin ($BTC ): Digital Gold Lead the Liquidity Flow
​Bitcoin continues to set the tempo for the broader market. When BTC consolidates, altcoins tend to find room to breathe; whenBTC experiences sharp volatility, liquidity rapidly pulls back into major pairs.
​Key Drivers: Institutional inflows through spot ETFs, global macroeconomic policy shifts, and systemic liquidity movements.
​Trading Strategy:
​Bullish Scenario: Look for sustained daily closes above immediate resistance to confirm momentum before entering breakout trades.
​Bearish/Correction Scenario: Watch major liquidity pools below recent swing lows for potential high-RR (risk-to-reward) long entries.
​💡 Pro Tip: Keep a close watch on BTC Dominance (BTC.D). High dominance alongside rising price means Bitcoin is absorbing all market capital.
​2. Ethereum ($ETH): Ecosystem Momentum & Network Activity
​Ethereum remains the foundation of DeFi, Layer-2 scaling solutions, and real-world asset (RWA) tokenization. While ETH often lagsBTC during initial market rallies, it historically catches up rapidly once capital rotates down the risk curve.
​Key Drivers: On-chain active addresses, L2 total value locked (TVL), network staking yields, and burn rates via EIP-1559.
​ETH/BTC Ratio: The $ETH / $BTC trading pair is currently testing major historical support. A strong bounce on ETH/BTC traditionally signals the start of an altcoin expansion phase.
​Trading Strategy: Monitor key moving averages (50 EMA & 200 EMA) on the 4-hour and daily charts to capture trend continuation setups.
​3. Strategic Outlook: How to Position Your Portfolio
​Risk-Off / Capital Preservation: Allocate heavier towards $BTC during periods of high macroeconomic uncertainty.
​Risk-On / Growth Phase: Shift partial exposure toward $ETH when Ethereum demonstrates relative strength over Bitcoin on high volume.
​💬 What is your strategy right now?
Are you accumulating $BTC , stacking $ETH, or waiting on the sidelines for a clearer market signal? Drop your targets in the comments below! 👇
#CryptoAnalysis #BTC🔥🔥🔥🔥🔥 #ETH🔥🔥🔥🔥🔥🔥 #BinanceSquareFamily #Write2Earn
​Disclaimer: This content is for educational and informational purposes only and should not be construed as financial advice. Cryptocurrencies are highly volatile assets. Always conduct your own research (DYOR) and apply strict risk management before opening any position.
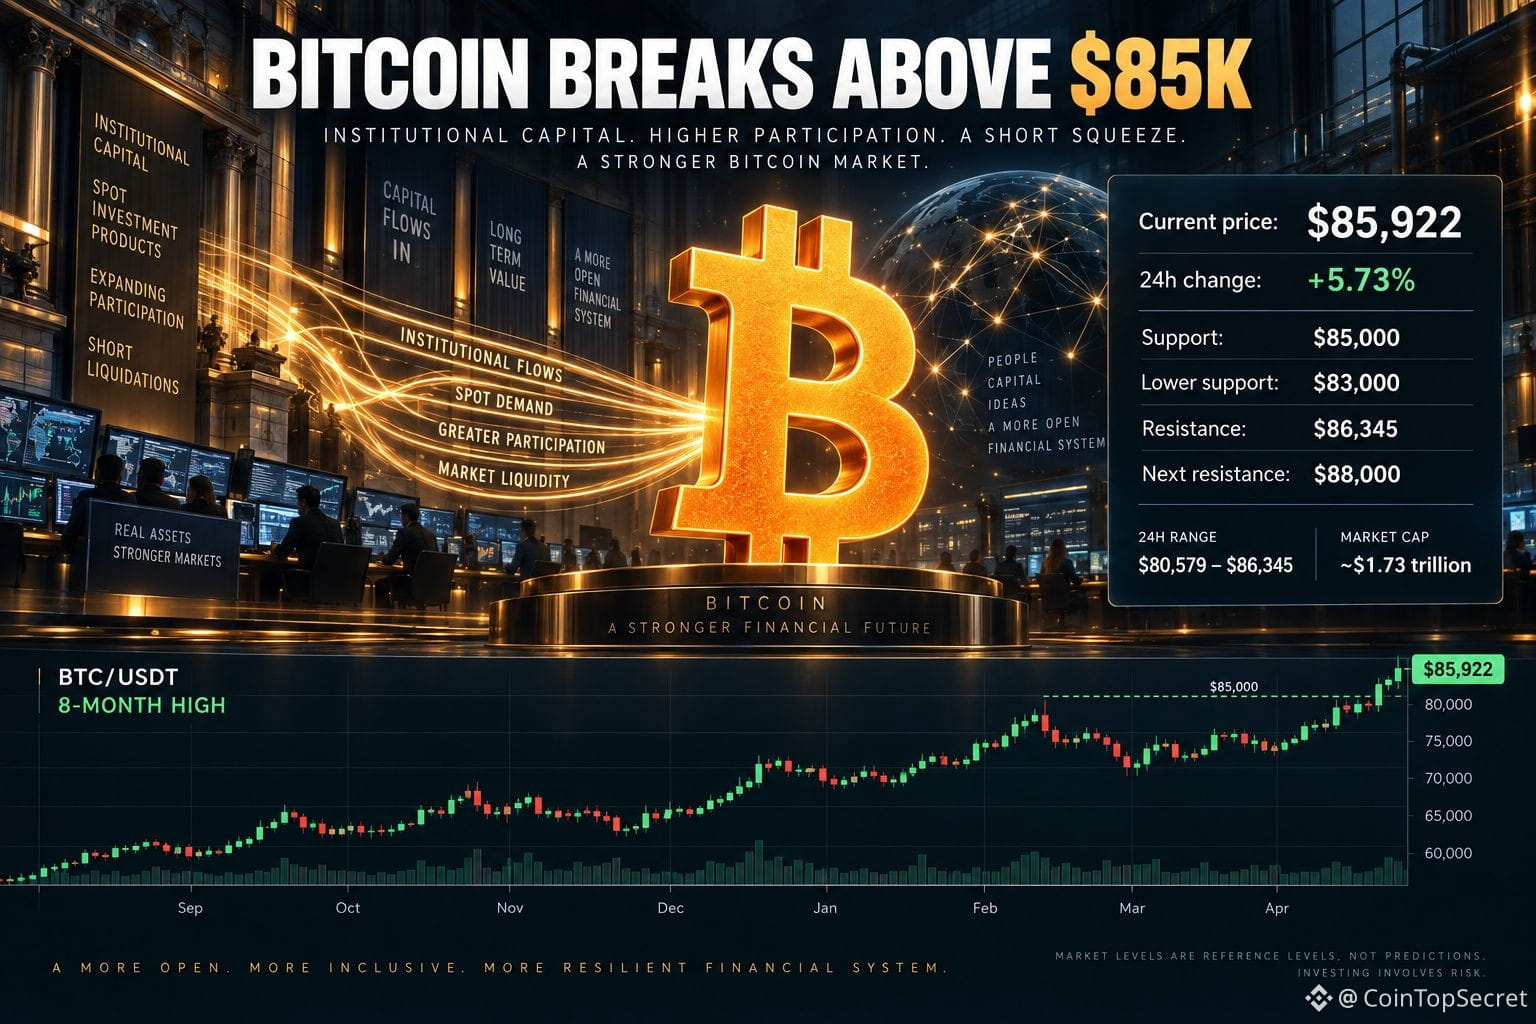
$BTC Update 🔎 Can Bitcoin hold its breakout above $85,000? 💰 Price now: $85,922 | 24h: +5.73% 📊 Market cap: $1.73T | Rank: #1 📈 24h range: $80,579 – $86,345 📰 What's happening: BTC reached an eight-month high as strong spot-ETF inflows and short liquidations accelerated the rally. Improving risk sentiment and favorable U.S. regulatory developments also supported demand. 🔥 Key catalyst: Renewed institutional inflows, combined with a short squeeze, have returned attention to Bitcoin. 👀 Next step to watch: 🔴 Bearish case: Losing $85,000 could expose $83,000. 🟢 Bullish case: Holding $85,000 and clearing $86,345 could open a test of $88,000. 📝 My take: Momentum is strong, but the breakout still needs confirmation above resistance. Not financial advice, DYOR ⚠️ #Bitcoin #BTCBitcoin #CryptoAnalysis #BTC
$BTC Update 🔎 Can Bitcoin hold its breakout above $85,000?

💰 Price now: $85,922 | 24h: +5.73%
📊 Market cap: $1.73T | Rank: #1
📈 24h range: $80,579 – $86,345

📰 What's happening:
BTC reached an eight-month high as strong spot-ETF inflows and short liquidations accelerated the rally. Improving risk sentiment and favorable U.S. regulatory developments also supported demand.

🔥 Key catalyst:
Renewed institutional inflows, combined with a short squeeze, have returned attention to Bitcoin.

👀 Next step to watch:
🔴 Bearish case: Losing $85,000 could expose $83,000.
🟢 Bullish case: Holding $85,000 and clearing $86,345 could open a test of $88,000.

📝 My take:
Momentum is strong, but the breakout still needs confirmation above resistance.

Not financial advice, DYOR ⚠️
#Bitcoin #BTCBitcoin #CryptoAnalysis #BTC
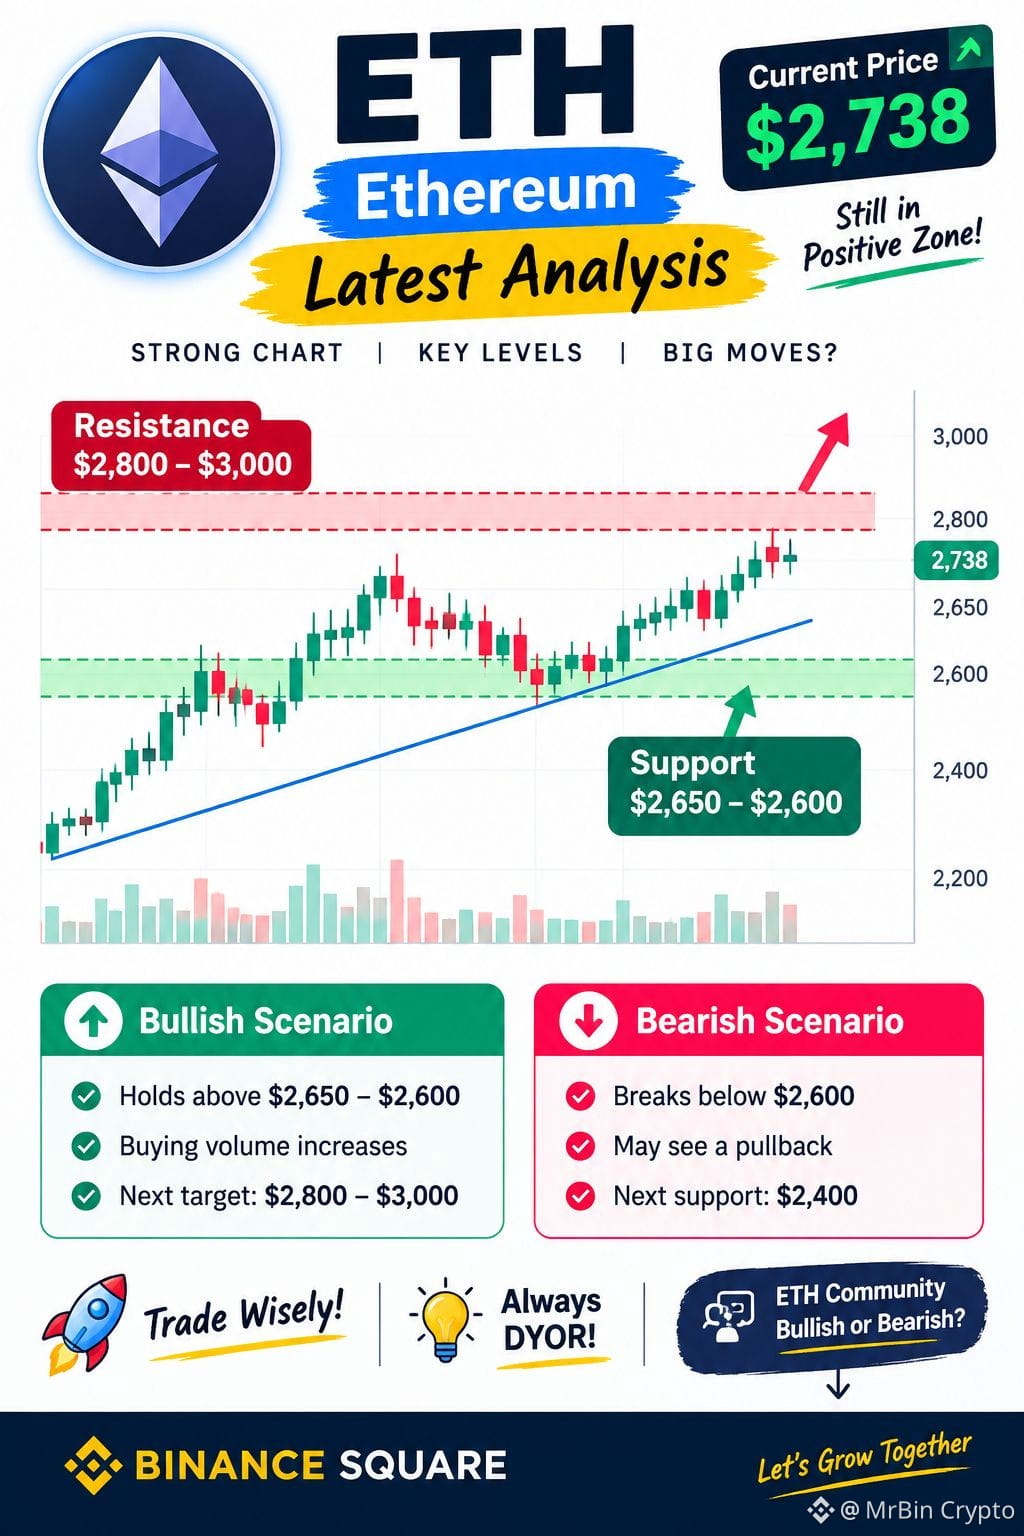
🔥 ETHEREUM (ETH) LATEST ANALYSIS 🔥 💰 Current Price: $2,738 📈 $ETH is showing positive momentum after moving above the $2,600 zone. 🎯 Key Levels to Watch: 🟢 Support: $2,650 – $2,600 🔴 Resistance: $2,800 – $3,000 📊 If $ETH holds above support and buying volume increases, further upside is possible. ⚠️ If the price falls below support, a pullback may occur. 💡 Trade wisely. Always DYOR! 🔍 🚀 ETH Community, are you bullish or bearish? 👇 #ETH #Ethereum #Crypto #BinanceSquare #CryptoAnalysis {spot}(ETHUSDT)
🔥 ETHEREUM (ETH) LATEST ANALYSIS 🔥

💰 Current Price: $2,738

📈 $ETH is showing positive momentum after moving above the $2,600 zone.

🎯 Key Levels to Watch:
🟢 Support: $2,650 – $2,600
🔴 Resistance: $2,800 – $3,000

📊 If $ETH holds above support and buying volume increases, further upside is possible.

⚠️ If the price falls below support, a pullback may occur.

💡 Trade wisely. Always DYOR! 🔍

🚀 ETH Community, are you bullish or bearish? 👇

#ETH #Ethereum #Crypto #BinanceSquare #CryptoAnalysis
Article
RELIEF RALLY OR REAL BULL MARKET? 5 INDICATORS I'M WATCHINGMy market interpretation. Your research. 🚨 CRYPTO IS RALLYING. BUT IS THIS REALLY A NEW BULL MARKET? Bitcoin has recovered. Altcoins are participating. Market sentiment has improved. But I'm asking a different question: What would actually confirm that this is more than just a relief rally? Personally, I don't think a few strong green candles are enough to declare that the market has entered a sustainable bull phase. Here's what I'm watching. This is my personal market interpretation and speculation—not a prediction or financial advice. 📊 1. BITCOIN PRICE STRUCTURE The first thing I'm watching is whether Bitcoin can maintain its recovery. A breakout is interesting. But what happens afterward may be even more important. 🟢 Bullish confirmation I'm looking for: Bitcoin holds its breakout levels during pullbacks and establishes a more constructive price structure. 🔴 Warning sign: Bitcoin quickly falls back below the breakout area, suggesting the recovery may lack follow-through. For me, the objective isn't to guess the next price target. It's to observe whether buyers can defend the levels the market has already reclaimed. 🏦 2. BITCOIN ETF FLOWS Institutional demand is another important piece of the puzzle. However, I don't want to overinterpret a single day of inflows. 🟢 Bullish confirmation I'm looking for: Consistent net inflows across multiple trading sessions. 🔴 Warning sign: Renewed and sustained outflows that indicate weakening demand through these investment products. One positive session can be encouraging. A persistent trend would provide more meaningful evidence. Follow the flows. Don't just follow the headlines. 📈 3. SPOT VOLUME VS. LEVERAGED MOMENTUM Not all buying pressure is created equal. A rally driven by genuine spot demand can have different characteristics from one driven primarily by leveraged derivatives positioning. 🟢 Bullish confirmation I'm looking for: Rising prices accompanied by meaningful spot buying and sustained participation. 🔴 Warning sign: Prices continue climbing while the move appears increasingly dependent on leveraged speculation. Short covering can accelerate a rally. But it isn't necessarily the same as durable, long-term accumulation. I want to understand what is driving the move—not simply celebrate the price increase. 🌐 4. ALTCOIN PARTICIPATION Bitcoin strength is important, but I also want to understand whether the recovery is broadening. Are established cryptocurrencies participating? Or are a handful of speculative tokens accounting for most of the excitement? 🟢 Bullish confirmation I'm looking for: Broader participation across established crypto assets, supported by improving market structure. 🔴 Warning sign: A narrow rally dominated by speculative tokens and temporary narratives. Broad participation would be an interesting development. But even then, I would still evaluate individual assets separately. A rising market does not eliminate the risks of weak projects, excessive valuations, or speculative behavior. 🌍 5. MACRO CONDITIONS Crypto doesn't operate in isolation. Interest-rate expectations, inflation, Treasury yields, the dollar, and global liquidity can all influence risk appetite. 🟢 Bullish confirmation I'm looking for: Macroeconomic developments become less restrictive than expected, potentially improving the environment for risk assets. 🔴 Warning sign: Persistent inflation, rising yields, tighter-than-expected monetary policy, or renewed liquidity concerns. The important point: A crypto rally can occur even when the macro environment remains challenging. But whether that rally can persist is a separate question. 🧠 SO, WHAT WOULD CONVINCE ME THAT THIS IS MORE THAN A RELIEF RALLY? I would want to see several indicators improving together: ✅ Bitcoin maintaining its recovery during pullbacks. ✅ ETF demand persisting beyond isolated inflow sessions. ✅ Meaningful spot buying supporting the advance. ✅ Broader participation across established cryptocurrencies. ✅ Macro conditions becoming less restrictive than expected. No single indicator can guarantee what happens next. And even if all five improve, the market can still experience substantial volatility. Confirmation is about accumulating evidence—not achieving certainty. 🎯 WHAT THIS MEANS FOR MY INVESTMENT STRATEGY I separate two questions. QUESTION 1: Is crypto experiencing improving bullish momentum? My interpretation is that the recovery, improving sentiment, and broader participation are consistent with improving momentum. But I would still want sustained confirmation before treating the move as evidence of a durable bull market. QUESTION 2: Does that mean I should increase my crypto allocation? Not automatically. A short-term rally doesn't, by itself, establish that increasing my allocation would improve my long-term risk-adjusted returns. My approach remains focused on: 1️⃣ Maintaining my intended portfolio allocation instead of allowing a sudden rally to dictate my investment structure. 2️⃣ Separating long-term accumulation from short-term speculative trading. 3️⃣ Monitoring whether institutional demand persists. 4️⃣ Reviewing my portfolio if crypto appreciation causes it to exceed my intended allocation. 5️⃣ Avoiding emotional decisions driven by FOMO or fear. My objective is to preserve a disciplined investment process rather than allowing one asset class to dominate my decisions because of short-term momentum. 💭 MY BOTTOM LINE At this point, I would describe the market as experiencing a: BULLISH RECOVERY WITH CONFIRMATION STILL NEEDED. That's my interpretation—not an established fact about what the market will do next. Short covering and speculative positioning can reverse quickly. Sustained institutional demand, stronger spot participation, and improving market structure would provide more meaningful evidence of a persistent recovery. But no combination of indicators eliminates uncertainty. As a long-term accumulator, I don't need to predict every move. I need to understand the environment I'm accumulating in. I would rather follow evidence and maintain discipline than chase a rally simply because the market looks exciting. 💬 YOUR TURN What would convince you that this crypto recovery is becoming a sustainable bull market? A. Bitcoin holding its breakout levels. B. Sustained Bitcoin ETF inflows. C. Strong spot buying rather than leverage-driven momentum. D. Broader participation across established altcoins. E. Improving macroeconomic conditions. Which indicator matters most to you, and what evidence are you watching? Let's discuss. ⚠️ IMPORTANT DISCLAIMER This article reflects my personal observations, interpretation, and speculation about the cryptocurrency market. It is not a statement of certainty, a guarantee of future performance, or financial advice. The indicators discussed are not infallible and can produce misleading signals. Please conduct your own research and due diligence (DYOR), verify information using reliable sources, evaluate the risks independently, and make investment decisions based on your own financial circumstances and risk tolerance. Never invest solely because of a social media post or another person's market outlook. #Bitcoin #CryptoAnalysis #BitcoinETFs #Macro #BitcoinAccumulation

RELIEF RALLY OR REAL BULL MARKET? 5 INDICATORS I'M WATCHING

My market interpretation. Your research.
🚨 CRYPTO IS RALLYING. BUT IS THIS REALLY A NEW BULL MARKET?
Bitcoin has recovered.
Altcoins are participating.
Market sentiment has improved.
But I'm asking a different question:
What would actually confirm that this is more than just a relief rally?
Personally, I don't think a few strong green candles are enough to declare that the market has entered a sustainable bull phase.
Here's what I'm watching.
This is my personal market interpretation and speculation—not a prediction or financial advice.
📊 1. BITCOIN PRICE STRUCTURE
The first thing I'm watching is whether Bitcoin can maintain its recovery.
A breakout is interesting.
But what happens afterward may be even more important.
🟢 Bullish confirmation I'm looking for:
Bitcoin holds its breakout levels during pullbacks and establishes a more constructive price structure.
🔴 Warning sign:
Bitcoin quickly falls back below the breakout area, suggesting the recovery may lack follow-through.
For me, the objective isn't to guess the next price target.
It's to observe whether buyers can defend the levels the market has already reclaimed.
🏦 2. BITCOIN ETF FLOWS
Institutional demand is another important piece of the puzzle.
However, I don't want to overinterpret a single day of inflows.
🟢 Bullish confirmation I'm looking for:
Consistent net inflows across multiple trading sessions.
🔴 Warning sign:
Renewed and sustained outflows that indicate weakening demand through these investment products.
One positive session can be encouraging.
A persistent trend would provide more meaningful evidence.
Follow the flows. Don't just follow the headlines.
📈 3. SPOT VOLUME VS. LEVERAGED MOMENTUM
Not all buying pressure is created equal.
A rally driven by genuine spot demand can have different characteristics from one driven primarily by leveraged derivatives positioning.
🟢 Bullish confirmation I'm looking for:
Rising prices accompanied by meaningful spot buying and sustained participation.
🔴 Warning sign:
Prices continue climbing while the move appears increasingly dependent on leveraged speculation.
Short covering can accelerate a rally.
But it isn't necessarily the same as durable, long-term accumulation.
I want to understand what is driving the move—not simply celebrate the price increase.
🌐 4. ALTCOIN PARTICIPATION
Bitcoin strength is important, but I also want to understand whether the recovery is broadening.
Are established cryptocurrencies participating?
Or are a handful of speculative tokens accounting for most of the excitement?
🟢 Bullish confirmation I'm looking for:
Broader participation across established crypto assets, supported by improving market structure.
🔴 Warning sign:
A narrow rally dominated by speculative tokens and temporary narratives.
Broad participation would be an interesting development.
But even then, I would still evaluate individual assets separately.
A rising market does not eliminate the risks of weak projects, excessive valuations, or speculative behavior.
🌍 5. MACRO CONDITIONS
Crypto doesn't operate in isolation.
Interest-rate expectations, inflation, Treasury yields, the dollar, and global liquidity can all influence risk appetite.
🟢 Bullish confirmation I'm looking for:
Macroeconomic developments become less restrictive than expected, potentially improving the environment for risk assets.
🔴 Warning sign:
Persistent inflation, rising yields, tighter-than-expected monetary policy, or renewed liquidity concerns.
The important point:
A crypto rally can occur even when the macro environment remains challenging.
But whether that rally can persist is a separate question.
🧠 SO, WHAT WOULD CONVINCE ME THAT THIS IS MORE THAN A RELIEF RALLY?
I would want to see several indicators improving together:
✅ Bitcoin maintaining its recovery during pullbacks.
✅ ETF demand persisting beyond isolated inflow sessions.
✅ Meaningful spot buying supporting the advance.
✅ Broader participation across established cryptocurrencies.
✅ Macro conditions becoming less restrictive than expected.
No single indicator can guarantee what happens next.
And even if all five improve, the market can still experience substantial volatility.
Confirmation is about accumulating evidence—not achieving certainty.
🎯 WHAT THIS MEANS FOR MY INVESTMENT STRATEGY
I separate two questions.
QUESTION 1: Is crypto experiencing improving bullish momentum?
My interpretation is that the recovery, improving sentiment, and broader participation are consistent with improving momentum.
But I would still want sustained confirmation before treating the move as evidence of a durable bull market.
QUESTION 2: Does that mean I should increase my crypto allocation?
Not automatically.
A short-term rally doesn't, by itself, establish that increasing my allocation would improve my long-term risk-adjusted returns.
My approach remains focused on:
1️⃣ Maintaining my intended portfolio allocation instead of allowing a sudden rally to dictate my investment structure.
2️⃣ Separating long-term accumulation from short-term speculative trading.
3️⃣ Monitoring whether institutional demand persists.
4️⃣ Reviewing my portfolio if crypto appreciation causes it to exceed my intended allocation.
5️⃣ Avoiding emotional decisions driven by FOMO or fear.
My objective is to preserve a disciplined investment process rather than allowing one asset class to dominate my decisions because of short-term momentum.
💭 MY BOTTOM LINE
At this point, I would describe the market as experiencing a:
BULLISH RECOVERY WITH CONFIRMATION STILL NEEDED.
That's my interpretation—not an established fact about what the market will do next.
Short covering and speculative positioning can reverse quickly.
Sustained institutional demand, stronger spot participation, and improving market structure would provide more meaningful evidence of a persistent recovery.
But no combination of indicators eliminates uncertainty.
As a long-term accumulator, I don't need to predict every move.
I need to understand the environment I'm accumulating in.
I would rather follow evidence and maintain discipline than chase a rally simply because the market looks exciting.
💬 YOUR TURN
What would convince you that this crypto recovery is becoming a sustainable bull market?
A. Bitcoin holding its breakout levels.
B. Sustained Bitcoin ETF inflows.
C. Strong spot buying rather than leverage-driven momentum.
D. Broader participation across established altcoins.
E. Improving macroeconomic conditions.
Which indicator matters most to you, and what evidence are you watching?
Let's discuss.
⚠️ IMPORTANT DISCLAIMER
This article reflects my personal observations, interpretation, and speculation about the cryptocurrency market.
It is not a statement of certainty, a guarantee of future performance, or financial advice.
The indicators discussed are not infallible and can produce misleading signals.
Please conduct your own research and due diligence (DYOR), verify information using reliable sources, evaluate the risks independently, and make investment decisions based on your own financial circumstances and risk tolerance.
Never invest solely because of a social media post or another person's market outlook.
#Bitcoin #CryptoAnalysis #BitcoinETFs #Macro #BitcoinAccumulation

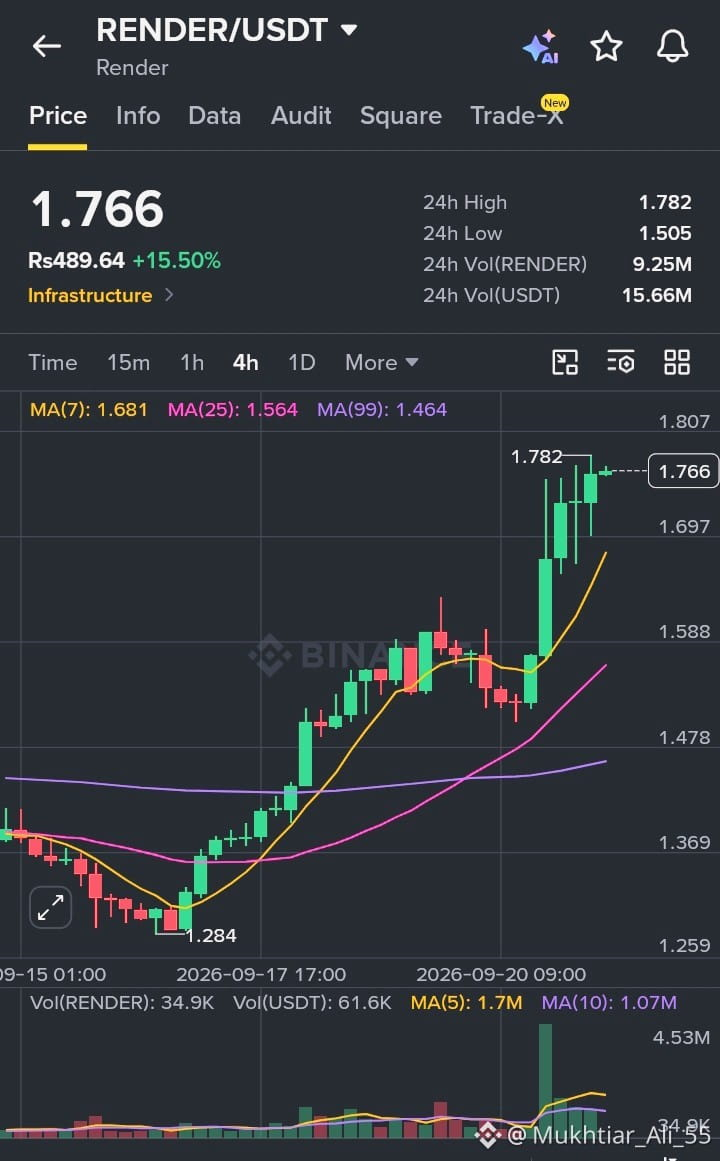
🚨 RENDER ($RENDER ) BREAKS OUT WITH POWERFUL MOMENTUM — WHAT THE CHART IS SAYING 📈🔥 $RENDER | RENDER/USDT 💰 Price: 1.766 📈 24H Change: +15.50% 📊 24H High: 1.782 📉 24H Low: 1.505 💵 24H Volume (USDT): 15.66M ⚠️ Market Breakdown (4H Timeframe): Render has triggered a strong bullish expansion after a prolonged accumulation phase near local lows 🧨 🔻 Price staged a clean reversal from the 1.284 bottom, surging sharply to hit the 1.782 local high 🔻 Consecutive strong green expansion candles reflect aggressive buying pressure and market demand 🔻 Small upper wicks near 1.782 indicate minor resistance as buyers consolidate control below key levels 🧲 📈 Moving Averages Tell the Story: 📌 MA(7): 1.681 📌 MA(25): 1.564 📌 MA(99): 1.464 ✅ Price is trading comfortably above all key moving averages ✅ Clear bullish fan alignment across short, mid, and long-term MAs ✅ Strong upward slope confirms buyers are fully driving the trend 🐂 📊 Volume Insight: 🟢 Massive volume spike on the breakout candle (MA 5/10 surging upward) 💥 Confirms strong accumulation and institutional participation on the rally ⚠️ Volatility remains high — hold above key short-term MAs maintains momentum 🧠 What This Means: This is a high-volume momentum expansion ❌ This is a clear trend continuation move breaking out of lower range structures 🔹 Short-term trend: Bullish 🔹 Momentum: Strong 🔹 Market emotion: High Optimism / FOMO 🚀 🎯 Key Levels to Watch: 🟢 Support: 1.564 – 1.681 zone 🔴 Resistance: 1.782 – 1.807 zone 📌 Holding above 1.681 keeps the parabolic push intact 📌 A clean breakout above 1.782 opens the path toward 1.807+ ⬆️ 💡 Final Take: 🧨 RENDER is displaying exceptional bullish strength 🧘 Avoid chasing tops blindly; wait for structural retests 🛡️ Always execute disciplined risk management Markets punish impatience — and reward discipline 💎 #RENDER #RenderNetwork #CryptoAnalysis #BinanceSquare #TradingSignals $RENDER {spot}(RENDERUSDT)

🚨 RENDER ($RENDER ) BREAKS OUT WITH POWERFUL MOMENTUM — WHAT THE CHART IS SAYING 📈🔥

$RENDER | RENDER/USDT
💰 Price: 1.766
📈 24H Change: +15.50%
📊 24H High: 1.782
📉 24H Low: 1.505
💵 24H Volume (USDT): 15.66M

⚠️ Market Breakdown (4H Timeframe):
Render has triggered a strong bullish expansion after a prolonged accumulation phase near local lows 🧨

🔻 Price staged a clean reversal from the 1.284 bottom, surging sharply to hit the 1.782 local high
🔻 Consecutive strong green expansion candles reflect aggressive buying pressure and market demand
🔻 Small upper wicks near 1.782 indicate minor resistance as buyers consolidate control below key levels 🧲

📈 Moving Averages Tell the Story:
📌 MA(7): 1.681
📌 MA(25): 1.564
📌 MA(99): 1.464
✅ Price is trading comfortably above all key moving averages
✅ Clear bullish fan alignment across short, mid, and long-term MAs
✅ Strong upward slope confirms buyers are fully driving the trend 🐂

📊 Volume Insight:
🟢 Massive volume spike on the breakout candle (MA 5/10 surging upward)
💥 Confirms strong accumulation and institutional participation on the rally
⚠️ Volatility remains high — hold above key short-term MAs maintains momentum

🧠 What This Means:
This is a high-volume momentum expansion ❌
This is a clear trend continuation move breaking out of lower range structures

🔹 Short-term trend: Bullish
🔹 Momentum: Strong
🔹 Market emotion: High Optimism / FOMO 🚀

🎯 Key Levels to Watch:
🟢 Support: 1.564 – 1.681 zone
🔴 Resistance: 1.782 – 1.807 zone
📌 Holding above 1.681 keeps the parabolic push intact
📌 A clean breakout above 1.782 opens the path toward 1.807+ ⬆️

💡 Final Take:
🧨 RENDER is displaying exceptional bullish strength
🧘 Avoid chasing tops blindly; wait for structural retests
🛡️ Always execute disciplined risk management
Markets punish impatience — and reward discipline 💎

#RENDER #RenderNetwork #CryptoAnalysis #BinanceSquare #TradingSignals

$RENDER
📊 BNB & NEAR — Market Analysis Today 🟡 $BNB : BNB around $774 trade kar raha hai, with recent momentum supported by stronger spot demand and BNB Chain activity. Key focus remains on whether momentum can hold above recent levels. 🔵 $NEAR : NEAR recently made a strong move but has entered short-term consolidation. The $3.42–$3.50 area is an important support zone, while $3.75–$3.80 remains a key resistance area. 👀 Key Focus: BNB momentum + NEAR support and volume. ⚠️ Analysis only — not financial advice or a buy signal. #bnb #Near #crypto #Binance #CryptoAnalysis {future}(BNBUSDT) {future}(NEARUSDT)
📊 BNB & NEAR — Market Analysis Today
🟡 $BNB : BNB around $774 trade kar raha hai, with recent momentum supported by stronger spot demand and BNB Chain activity. Key focus remains on whether momentum can hold above recent levels.
🔵 $NEAR : NEAR recently made a strong move but has entered short-term consolidation. The $3.42–$3.50 area is an important support zone, while $3.75–$3.80 remains a key resistance area.
👀 Key Focus: BNB momentum + NEAR support and volume.
⚠️ Analysis only — not financial advice or a buy signal.
#bnb #Near #crypto #Binance #CryptoAnalysis
BNB Up or Down on September 21?

BNB Up or Down on September 21?

99%Up1%Down
Volume $23,888.61
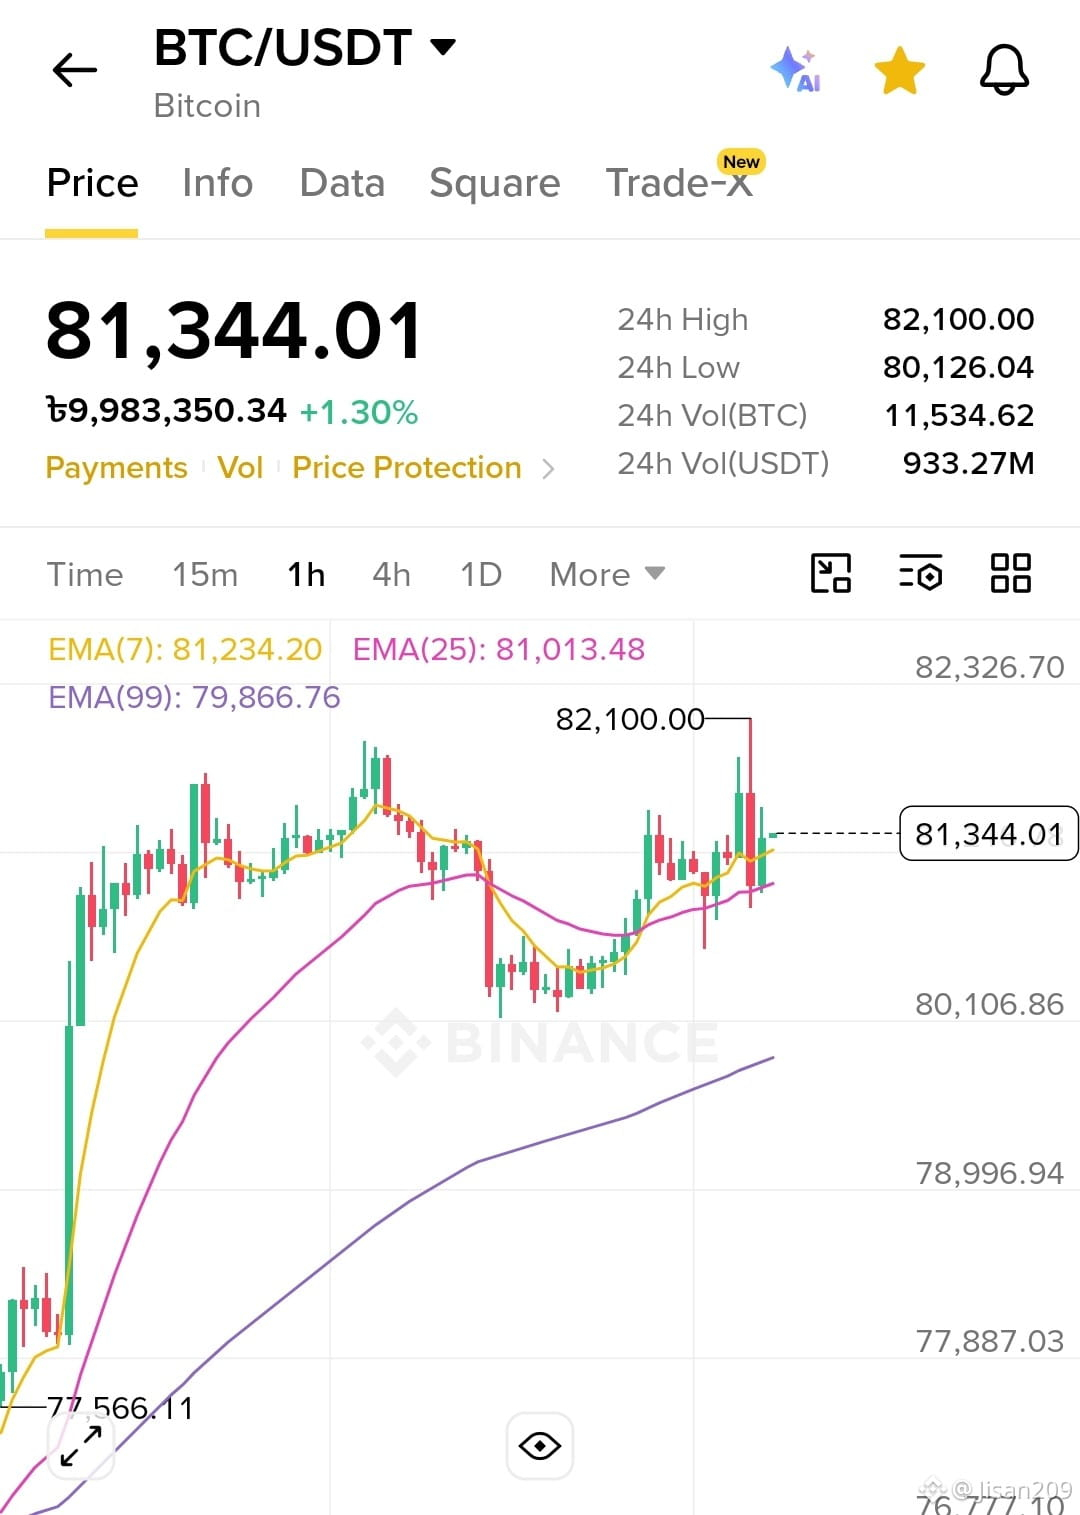
🚀 $BTC / USDT 1-Hour Chart Update: Key Levels to Watch! 📊 Bitcoin just had a sharp rejection after testing the $82,100 resistance zone and is currently consolidating around $81,340. Here is what the technicals are telling us right now: 🔹 Current Price: $81,344 🔹 Key Resistance: $82,100 (Recent 24h High) 🔹 Immediate Support: $81,000 – $81,200 (Confluence of EMA 7 & EMA 25) 🔹 Major Trend Support: $79,860 (EMA 99) 📈 Technical Outlook: Bullish Scenario: Price is still holding well above the 25 EMA ($81,013) and 99 EMA ($79,866). If bulls successfully defend the $81,000 zone, we could see another retest towards $82,500+. Bearish Scenario: If $BTC closes a 1H candle below $81,000, we might see a quick pullback towards the strong support level at $80,100 – $79,800. 💡 Trader Tip: Wait for confirmation! Don't FOMO at the top. Let the 1H candle close above support before taking long setups. Always use tight stop losses and manage risk! What are your thoughts on Bitcoin's next move? Drop your targets below! 👇 #Write2Earn #Bitcoin #BTC #CryptoAnalysis #BinanceSquare {future}(BTCUSDT)
🚀 $BTC / USDT 1-Hour Chart Update: Key Levels to Watch! 📊

Bitcoin just had a sharp rejection after testing the $82,100 resistance zone and is currently consolidating around $81,340.

Here is what the technicals are telling us right now:

🔹 Current Price: $81,344
🔹 Key Resistance: $82,100 (Recent 24h High)
🔹 Immediate Support: $81,000 – $81,200 (Confluence of EMA 7 & EMA 25)
🔹 Major Trend Support: $79,860 (EMA 99)

📈 Technical Outlook:

Bullish Scenario: Price is still holding well above the 25 EMA ($81,013) and 99 EMA ($79,866). If bulls successfully defend the $81,000 zone, we could see another retest towards $82,500+.
Bearish Scenario: If $BTC closes a 1H candle below $81,000, we might see a quick pullback towards the strong support level at $80,100 – $79,800.
💡 Trader Tip: Wait for confirmation! Don't FOMO at the top. Let the 1H candle close above support before taking long setups. Always use tight stop losses and manage risk!

What are your thoughts on Bitcoin's next move? Drop your targets below! 👇

#Write2Earn #Bitcoin #BTC #CryptoAnalysis #BinanceSquare
📈 $ETH Testing the Gates: Will the Range Breakout Hold This Time? 💎 Ethereum ($ETH ) is showcasing crucial structural strength on the daily timeframe, aggressively challenging the major consolidation ceiling around the $2,601.54 zone. After multiple rejection cycles, the bulls are pushing for a decisive structural shift. Here is the professional technical breakdown you need to monitor right now: 🚀 1. The Breakout Catalyst ETH has successfully built a solid liquidity floor above the $2,371.27 baseline support level. The current daily candle is squeezing tightly against the multi-week range resistance. 🎯 2. Immediate Targets & Invalidation Bullish Confirmation: A clean daily candle body close above $2,605 flips this distribution zone into solid demand, opening the macro pathway straight toward the $2,850 – $3,000 targets. Risk Shield: If the buying volume fades, look for a standard retest of the lower liquidity block at $2,371. Any daily close below this support invalidates the immediate bullish continuation setup. Single-asset concentration during range wicks carries volatility risks—keep your exposure balanced and leverage strictly monitored. 💬 TRADERS BIAS: Is this the real Q4 mega breakout for Ethereum, or are market makers setting up another brutal liquidity sweep for over-leveraged longs? Drop your technical targets and stop-loss levels below! 👇 #CryptoAnalysis #Ethereum #TradingSignals #TechnicalAnalysis #Write2Earn {spot}(ETHUSDT)
📈 $ETH Testing the Gates: Will the Range Breakout Hold This Time? 💎

Ethereum ($ETH ) is showcasing crucial structural strength on the daily timeframe, aggressively challenging the major consolidation ceiling around the $2,601.54 zone. After multiple rejection cycles, the bulls are pushing for a decisive structural shift.

Here is the professional technical breakdown you need to monitor right now:

🚀 1. The Breakout Catalyst
ETH has successfully built a solid liquidity floor above the $2,371.27 baseline support level. The current daily candle is squeezing tightly against the multi-week range resistance.

🎯 2. Immediate Targets & Invalidation

Bullish Confirmation: A clean daily candle body close above $2,605 flips this distribution zone into solid demand, opening the macro pathway straight toward the $2,850 – $3,000 targets.

Risk Shield: If the buying volume fades, look for a standard retest of the lower liquidity block at $2,371. Any daily close below this support invalidates the immediate bullish continuation setup. Single-asset concentration during range wicks carries volatility risks—keep your exposure balanced and leverage strictly monitored.

💬 TRADERS BIAS:
Is this the real Q4 mega breakout for Ethereum, or are market makers setting up another brutal liquidity sweep for over-leveraged longs?

Drop your technical targets and stop-loss levels below! 👇

#CryptoAnalysis #Ethereum #TradingSignals #TechnicalAnalysis #Write2Earn
Article
Market Shakeout or Buying Opportunity? Key Levels to Watch Now! 🚀The crypto market is showing mixed momentum today. While short-term volatility is keeping traders on edge, key technical levels on major assets are setting up high-reward trade setups! 👇 ​📊 Quick Market Breakdown: ​1️⃣ $BTC (Bitcoin): Currently hovering near the $81,200 to $81,700 zone, Bitcoin is clinging to its bullish structure right on the daily pivot. However, short-term momentum indicators are flashing caution. Watch for a clean volume-backed breakout above the $81,700 resistance before opening leverage, or look for strong bounce signals if a corrective pullback occurs. ​2️⃣ $ETH (Ethereum): Ethereum is facing a critical test around $2,450. The $2,438 Fibonacci level is acting as a crucial weekly support. If $ETH holds above this line, the short-term outlook remains constructive with a potential upside target near $2,920 (roughly 19% higher). A weekly close below $2,438 could expose support levels closer to $2,220. ​3️⃣ $SOL (Solana): Retail volume and liquidity remain solid. Look for range-bound trade opportunities near established support zones with tight stop-losses, as broader altcoin price action will heavily depend on BTC andETH finding their footing. ​⚠️ Trading Strategy & Risk Reminder: ​Risk Management First: Always stick to strict stop-loss rules—never risk more than 1–2% of your portfolio per trade during choppy market conditions.​Volume Confirmation: Wait for key level breakouts to be backed by solid volume before entering. 💬 What's your stance right now? Are you buying the dip, going short, or holding cash? Drop your predictions below! 👇 ​#Write2Earn #CryptoAnalysis #BinanceSquare $BTC ETHSOL

Market Shakeout or Buying Opportunity? Key Levels to Watch Now! 🚀

The crypto market is showing mixed momentum today. While short-term volatility is keeping traders on edge, key technical levels on major assets are setting up high-reward trade setups! 👇
​📊 Quick Market Breakdown:
​1️⃣ $BTC (Bitcoin):
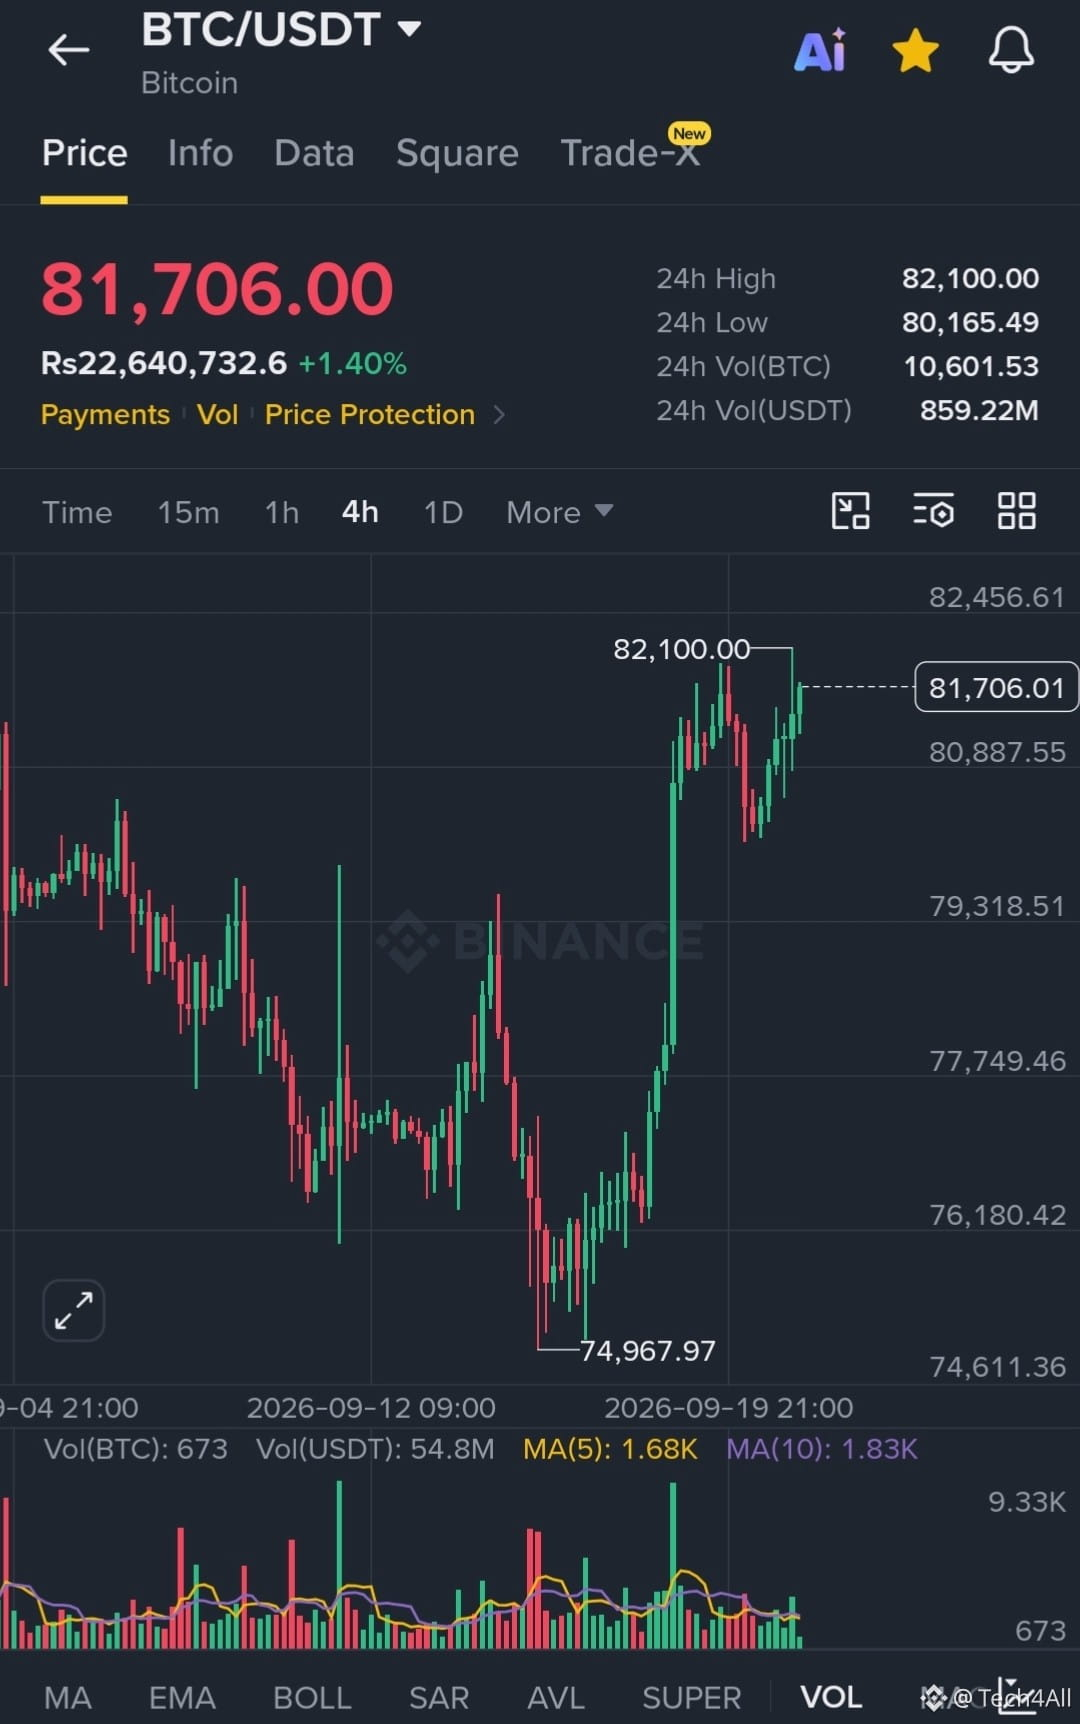
Currently hovering near the $81,200 to $81,700 zone, Bitcoin is clinging to its bullish structure right on the daily pivot. However, short-term momentum indicators are flashing caution. Watch for a clean volume-backed breakout above the $81,700 resistance before opening leverage, or look for strong bounce signals if a corrective pullback occurs.
​2️⃣ $ETH (Ethereum):
Ethereum is facing a critical test around $2,450. The $2,438 Fibonacci level is acting as a crucial weekly support. If $ETH holds above this line, the short-term outlook remains constructive with a potential upside target near $2,920 (roughly 19% higher). A weekly close below $2,438 could expose support levels closer to $2,220.
​3️⃣ $SOL (Solana):
Retail volume and liquidity remain solid. Look for range-bound trade opportunities near established support zones with tight stop-losses, as broader altcoin price action will heavily depend on BTC andETH finding their footing.
​⚠️ Trading Strategy & Risk Reminder:
​Risk Management First: Always stick to strict stop-loss rules—never risk more than 1–2% of your portfolio per trade during choppy market conditions.​Volume Confirmation: Wait for key level breakouts to be backed by solid volume before entering.
💬 What's your stance right now? Are you buying the dip, going short, or holding cash? Drop your predictions below! 👇
#Write2Earn #CryptoAnalysis #BinanceSquare $BTC ETHSOL
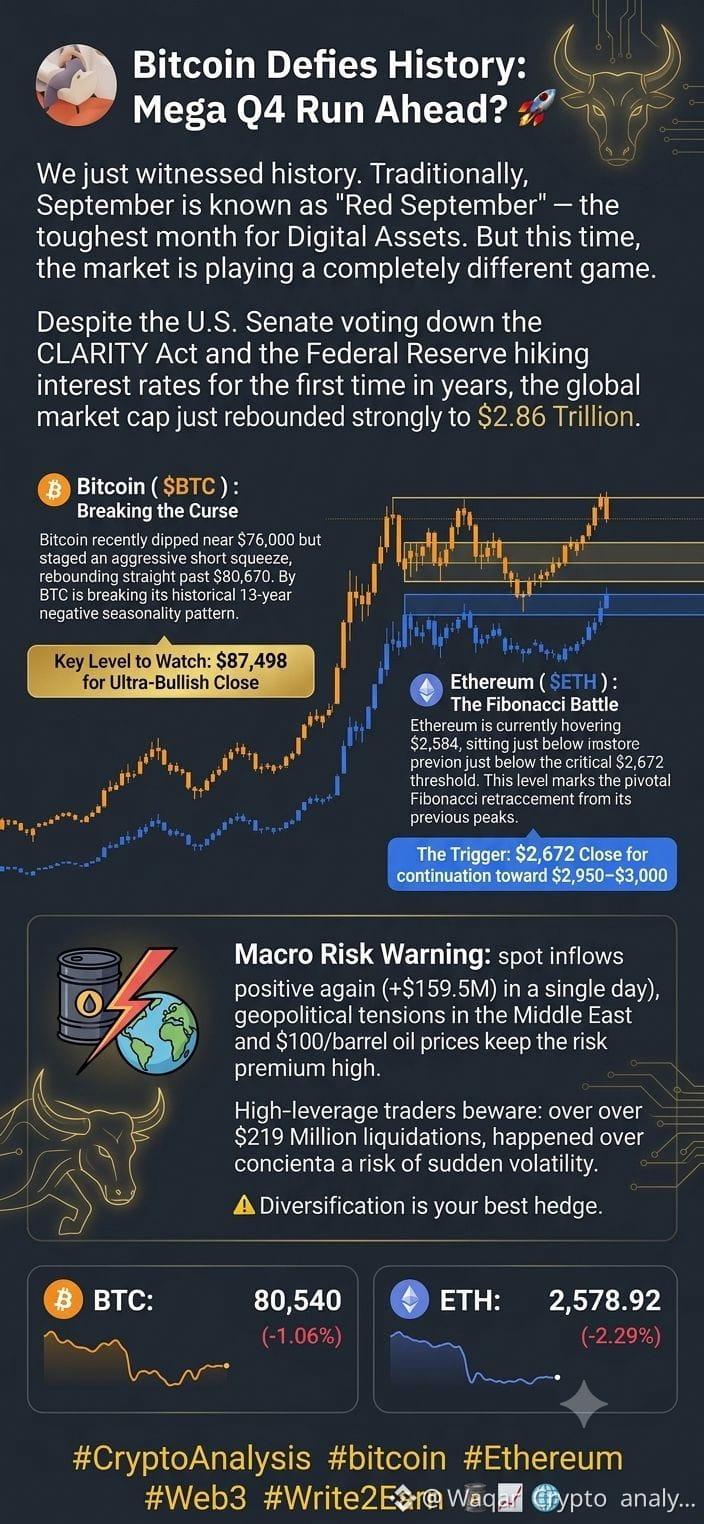
Bitcoin Defies History: Mega Q4 Run Ahead? 🚀 We just witnessed history. Traditionally, September is known as "Red September"—the toughest month for Digital Assets. But this time, the market is playing a completely different game. Despite the U.S. Senate voting down the CLARITY Act and the Federal Reserve hiking interest rates for the first time in three years, the global crypto market cap just rebounded strongly to $2.86 Trillion. Here is the institutional-grade breakdown of the current market structure you need to know today: 📈 1. Bitcoin ( $BTC ): Breaking the Curse Bitcoin recently dipped near $76,000 but staged an aggressive short squeeze, rebounding straight past $80,670. By gaining over 3% so far this month, BTC is breaking its historical 13-year negative seasonality pattern. Key Level to Watch: We need a clean weekly close above $87,498 to completely erase early yearly losses and flip the macro trend into ultra-bullish territory. 💎 2. Ethereum ( $ETH ): The Fibonacci Battle Ethereum is currently hovering around $2,584, sitting just below the critical $2,672 threshold. This level marks the pivotal Fibonacci retracement from its previous peaks. The Trigger: If ETH manages a weekly candle close above $2,672, the doors open straight for a massive continuation toward the $2,950 – $3,000 range. ⚠️ 3. Macro Risk Warning & Liquidity Shifts While the spot ETF inflows have turned positive again (+$159.5M in a single day), geopolitical tensions in the Middle East and $100/barrel oil prices keep the risk premium high. High-leverage traders beware: over $219 Million in liquidations happened over the weekend, mostly punishing shorts. High concentration in single assets right now carries a risk of sudden volatility—diversification remains your best hedge. 💬 LET'S TALK: Are you buying this breakout, or do you think the macro pressure will drag us back down? Which altcoins are on your radar for October? Drop your targets in the comments below! 👇 #CryptoAnalysis #bitcoin #Ethereum #Web3 #Write2Earn {spot}(BTCUSDT) {spot}(ETHUSDT)
Bitcoin Defies History: Mega Q4 Run Ahead? 🚀

We just witnessed history. Traditionally, September is known as "Red September"—the toughest month for Digital Assets. But this time, the market is playing a completely different game.

Despite the U.S. Senate voting down the CLARITY Act and the Federal Reserve hiking interest rates for the first time in three years, the global crypto market cap just rebounded strongly to $2.86 Trillion.

Here is the institutional-grade breakdown of the current market structure you need to know today:

📈 1. Bitcoin ( $BTC ): Breaking the Curse
Bitcoin recently dipped near $76,000 but staged an aggressive short squeeze, rebounding straight past $80,670. By gaining over 3% so far this month, BTC is breaking its historical 13-year negative seasonality pattern.

Key Level to Watch: We need a clean weekly close above $87,498 to completely erase early yearly losses and flip the macro trend into ultra-bullish territory.

💎 2. Ethereum ( $ETH ): The Fibonacci Battle
Ethereum is currently hovering around $2,584, sitting just below the critical $2,672 threshold. This level marks the pivotal Fibonacci retracement from its previous peaks.

The Trigger: If ETH manages a weekly candle close above $2,672, the doors open straight for a massive continuation toward the $2,950 – $3,000 range.

⚠️ 3. Macro Risk Warning & Liquidity Shifts
While the spot ETF inflows have turned positive again (+$159.5M in a single day), geopolitical tensions in the Middle East and $100/barrel oil prices keep the risk premium high. High-leverage traders beware: over $219 Million in liquidations happened over the weekend, mostly punishing shorts. High concentration in single assets right now carries a risk of sudden volatility—diversification remains your best hedge.

💬 LET'S TALK:
Are you buying this breakout, or do you think the macro pressure will drag us back down? Which altcoins are on your radar for October?

Drop your targets in the comments below! 👇

#CryptoAnalysis #bitcoin #Ethereum #Web3 #Write2Earn

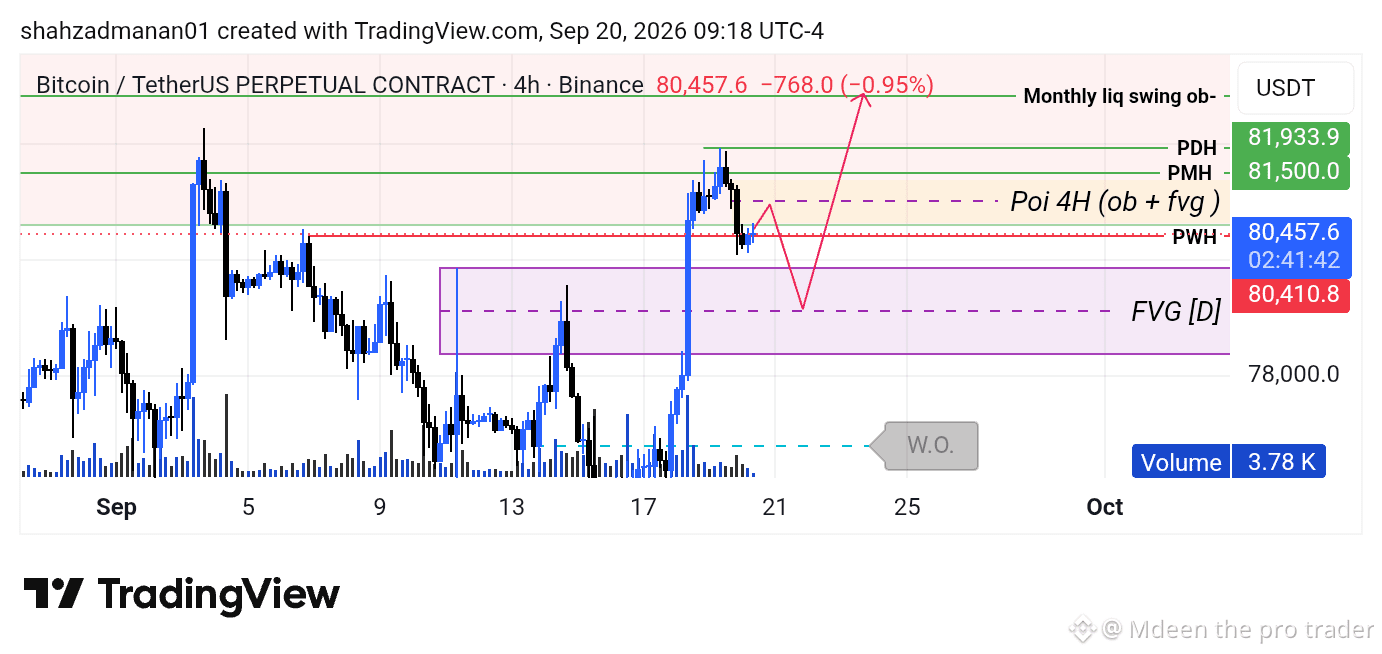
🚨 $BTC /USDT 4H ANALYSIS — LIQUIDITY HUNT INCOMING? 📊 Bitcoin is currently trading around $80,457 on the 4H timeframe. Price has shown strong bullish displacement from the lower levels, but now it's approaching key liquidity zones where smart money may look for a retracement before the next major move. 🔍 KEY LEVELS TO WATCH: 🟢 Bullish POI (4H OB + FVG): $80,800 – $81,200 🔴 Daily FVG / Discount Zone: $78,200 – $79,500 🎯 Upside Liquidity Targets: • PMH: $81,500 • PDH: $81,934 • Monthly Liquidity Swing OB: $82,500+ 📈 MY EXPECTED SCENARIO: 1️⃣ Price may retrace into the 4H POI (OB + FVG). 2️⃣ If bullish reaction + MSS appears, a continuation toward PMH and PDH becomes possible. 3️⃣ A deeper pullback into the Daily FVG could offer a better discount entry for buyers. ⚠️ TRADING PLAN: Don't chase the pump. Wait for: ✅ Liquidity sweep ✅ Market Structure Shift (MSS) ✅ Bullish FVG / Order Block reaction ✅ Volume confirmation No confirmation = NO TRADE. This is a technical analysis scenario, not financial advice. Always manage risk. 💬 Are you expecting BTC to sweep lower liquidity before moving toward $82K? #BTC☀️ #Bitcoin #BTCUSDTAnalysis T #CryptoAnalysis #ICT #SmartMoneyConceptsCrypto s #TradingView #BinanceSquare #CryptoTrading #FVG #OrderBlock
🚨 $BTC /USDT 4H ANALYSIS — LIQUIDITY HUNT INCOMING? 📊

Bitcoin is currently trading around $80,457 on the 4H timeframe.

Price has shown strong bullish displacement from the lower levels, but now it's approaching key liquidity zones where smart money may look for a retracement before the next major move.

🔍 KEY LEVELS TO WATCH:

🟢 Bullish POI (4H OB + FVG): $80,800 – $81,200

🔴 Daily FVG / Discount Zone: $78,200 – $79,500

🎯 Upside Liquidity Targets: • PMH: $81,500 • PDH: $81,934 • Monthly Liquidity Swing OB: $82,500+

📈 MY EXPECTED SCENARIO:

1️⃣ Price may retrace into the 4H POI (OB + FVG).

2️⃣ If bullish reaction + MSS appears, a continuation toward PMH and PDH becomes possible.

3️⃣ A deeper pullback into the Daily FVG could offer a better discount entry for buyers.

⚠️ TRADING PLAN:

Don't chase the pump.

Wait for: ✅ Liquidity sweep ✅ Market Structure Shift (MSS) ✅ Bullish FVG / Order Block reaction ✅ Volume confirmation

No confirmation = NO TRADE.

This is a technical analysis scenario, not financial advice. Always manage risk.

💬 Are you expecting BTC to sweep lower liquidity before moving toward $82K?

#BTC☀️ #Bitcoin #BTCUSDTAnalysis T #CryptoAnalysis #ICT #SmartMoneyConceptsCrypto s #TradingView #BinanceSquare #CryptoTrading #FVG #OrderBlock
🚨 $BTC /USDT Technical Analysis 🚨 Bitcoin is currently showing a strong uptrend. 📈 🔹 Resistance: $110K 🔹 Next Target: $120K 🔹 Strong Support: $100K 🔹 Major Support: $95K If BTC gives a strong close above $110K, then momentum towards the $120K zone can continue. But if the $100K support breaks, the chance of a short-term correction may increase. 📊 What to Watch: ✅ $110K breakout & daily close ✅ $100K support hold ✅ Market volume ✅ US economic data & Fed decisions #BTC #bitcoin #CryptoAnalysis #BİNANCESQUARE {spot}(BTCUSDT)
🚨 $BTC /USDT Technical Analysis 🚨
Bitcoin is currently showing a strong uptrend. 📈
🔹 Resistance: $110K
🔹 Next Target: $120K
🔹 Strong Support: $100K
🔹 Major Support: $95K
If BTC gives a strong close above $110K, then momentum towards the $120K zone can continue.
But if the $100K support breaks, the chance of a short-term correction may increase.
📊 What to Watch: ✅ $110K breakout & daily close
✅ $100K support hold
✅ Market volume
✅ US economic data & Fed decisions
#BTC #bitcoin #CryptoAnalysis #BİNANCESQUARE
Log in to explore more content
Join global crypto users on Binance Square
⚡️ Get latest and useful information about crypto.
💬 Trusted by the world’s largest crypto exchange.
👍 Discover real insights from verified creators.
Email / Phone number