
#ethereum
ethereum
104.6M views
264,091 Discussing
Hot
Latest

·
--
🚨 ETHEREUM JUST HIT A SECURITY ROADBLOCK — ITS NEXT BIG UPGRADE IS DELAYED!
Ethereum's developers have paused the Glamsterdam upgrade process after security researchers identified compatibility risks.
Here's what happened:
- Four reports identified deployed smart contracts that could be affected.
- The issues involve proposed changes to gas pricing and state costs.
- Developers are reviewing the problems before continuing the hard-fork process.
- The Hoodi testnet activation has been postponed, with no new date announced.
Key takeaway: Ethereum is prioritizing security over speed. Glamsterdam remains in development, not live on mainnet.
#Ethereum #ETH #Crypto
Not financial advice. DYOR.
🚨 ETHEREUM JUST HIT A SECURITY ROADBLOCK — ITS NEXT BIG UPGRADE IS DELAYED!
Ethereum's developers have paused the Glamsterdam upgrade process after security researchers identified compatibility risks.
Here's what happened:
- Four reports identified deployed smart contracts that could be affected.
- The issues involve proposed changes to gas pricing and state costs.
- Developers are reviewing the problems before continuing the hard-fork process.
- The Hoodi testnet activation has been postponed, with no new date announced.
Key takeaway: Ethereum is prioritizing security over speed. Glamsterdam remains in development, not live on mainnet.
#Ethereum #ETH #Crypto
Not financial advice. DYOR.
Ethereum's developers have paused the Glamsterdam upgrade process after security researchers identified compatibility risks.
Here's what happened:
- Four reports identified deployed smart contracts that could be affected.
- The issues involve proposed changes to gas pricing and state costs.
- Developers are reviewing the problems before continuing the hard-fork process.
- The Hoodi testnet activation has been postponed, with no new date announced.
Key takeaway: Ethereum is prioritizing security over speed. Glamsterdam remains in development, not live on mainnet.
#Ethereum #ETH #Crypto
Not financial advice. DYOR.

3
3.2k


·
--
$ETH LEVELS I’M WATCHING! PAY CLOSE ATTENTION
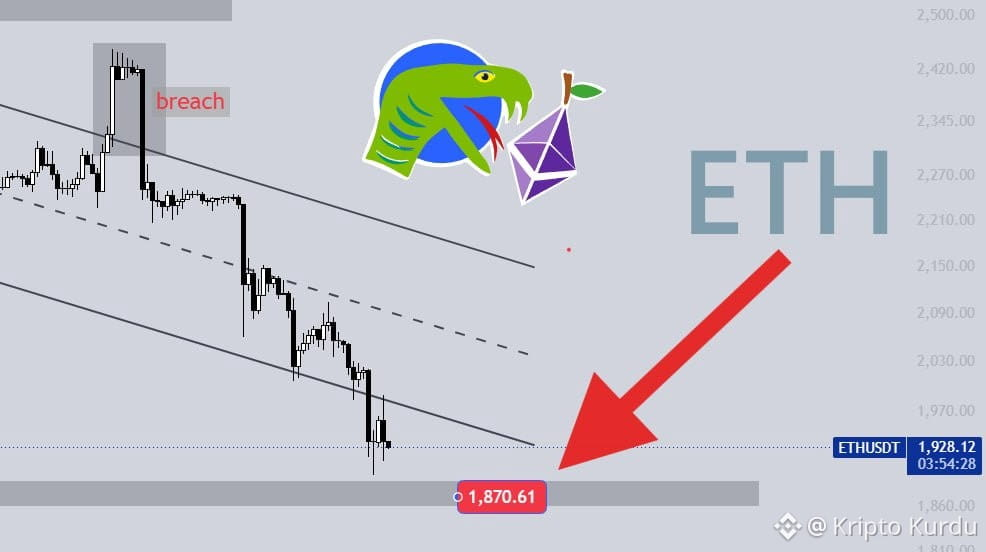
#Ethereum broke out of the channel we identified and pulled back. After rebounding from the lower band, it returned to its downward trend.
Here’s what I expect next: It won’t be able to break out of this channel quickly and will likely trade within a range. Since the channel is downward-sloping, each low could be lower than the previous one.
Additionally, the first support zone is the $1,870 level shown in the chart. I expect a drop to this level initially.
However, if the lower band is broken to the upside, we could see a move above the channel. Therefore, mark these areas on your chart and set separate alerts for each one!
$ETH LEVELS I’M WATCHING! PAY CLOSE ATTENTION
#Ethereum broke out of the channel we identified and pulled back. After rebounding from the lower band, it returned to its downward trend.
Here’s what I expect next: It won’t be able to break out of this channel quickly and will likely trade within a range. Since the channel is downward-sloping, each low could be lower than the previous one.
Additionally, the first support zone is the $1,870 level shown in the chart. I expect a drop to this level initially.
However, if the lower band is broken to the upside, we could see a move above the channel. Therefore, mark these areas on your chart and set separate alerts for each one!
#Ethereum broke out of the channel we identified and pulled back. After rebounding from the lower band, it returned to its downward trend.
Here’s what I expect next: It won’t be able to break out of this channel quickly and will likely trade within a range. Since the channel is downward-sloping, each low could be lower than the previous one.
Additionally, the first support zone is the $1,870 level shown in the chart. I expect a drop to this level initially.
However, if the lower band is broken to the upside, we could see a move above the channel. Therefore, mark these areas on your chart and set separate alerts for each one!
11
3.6k

·
--
Bearish
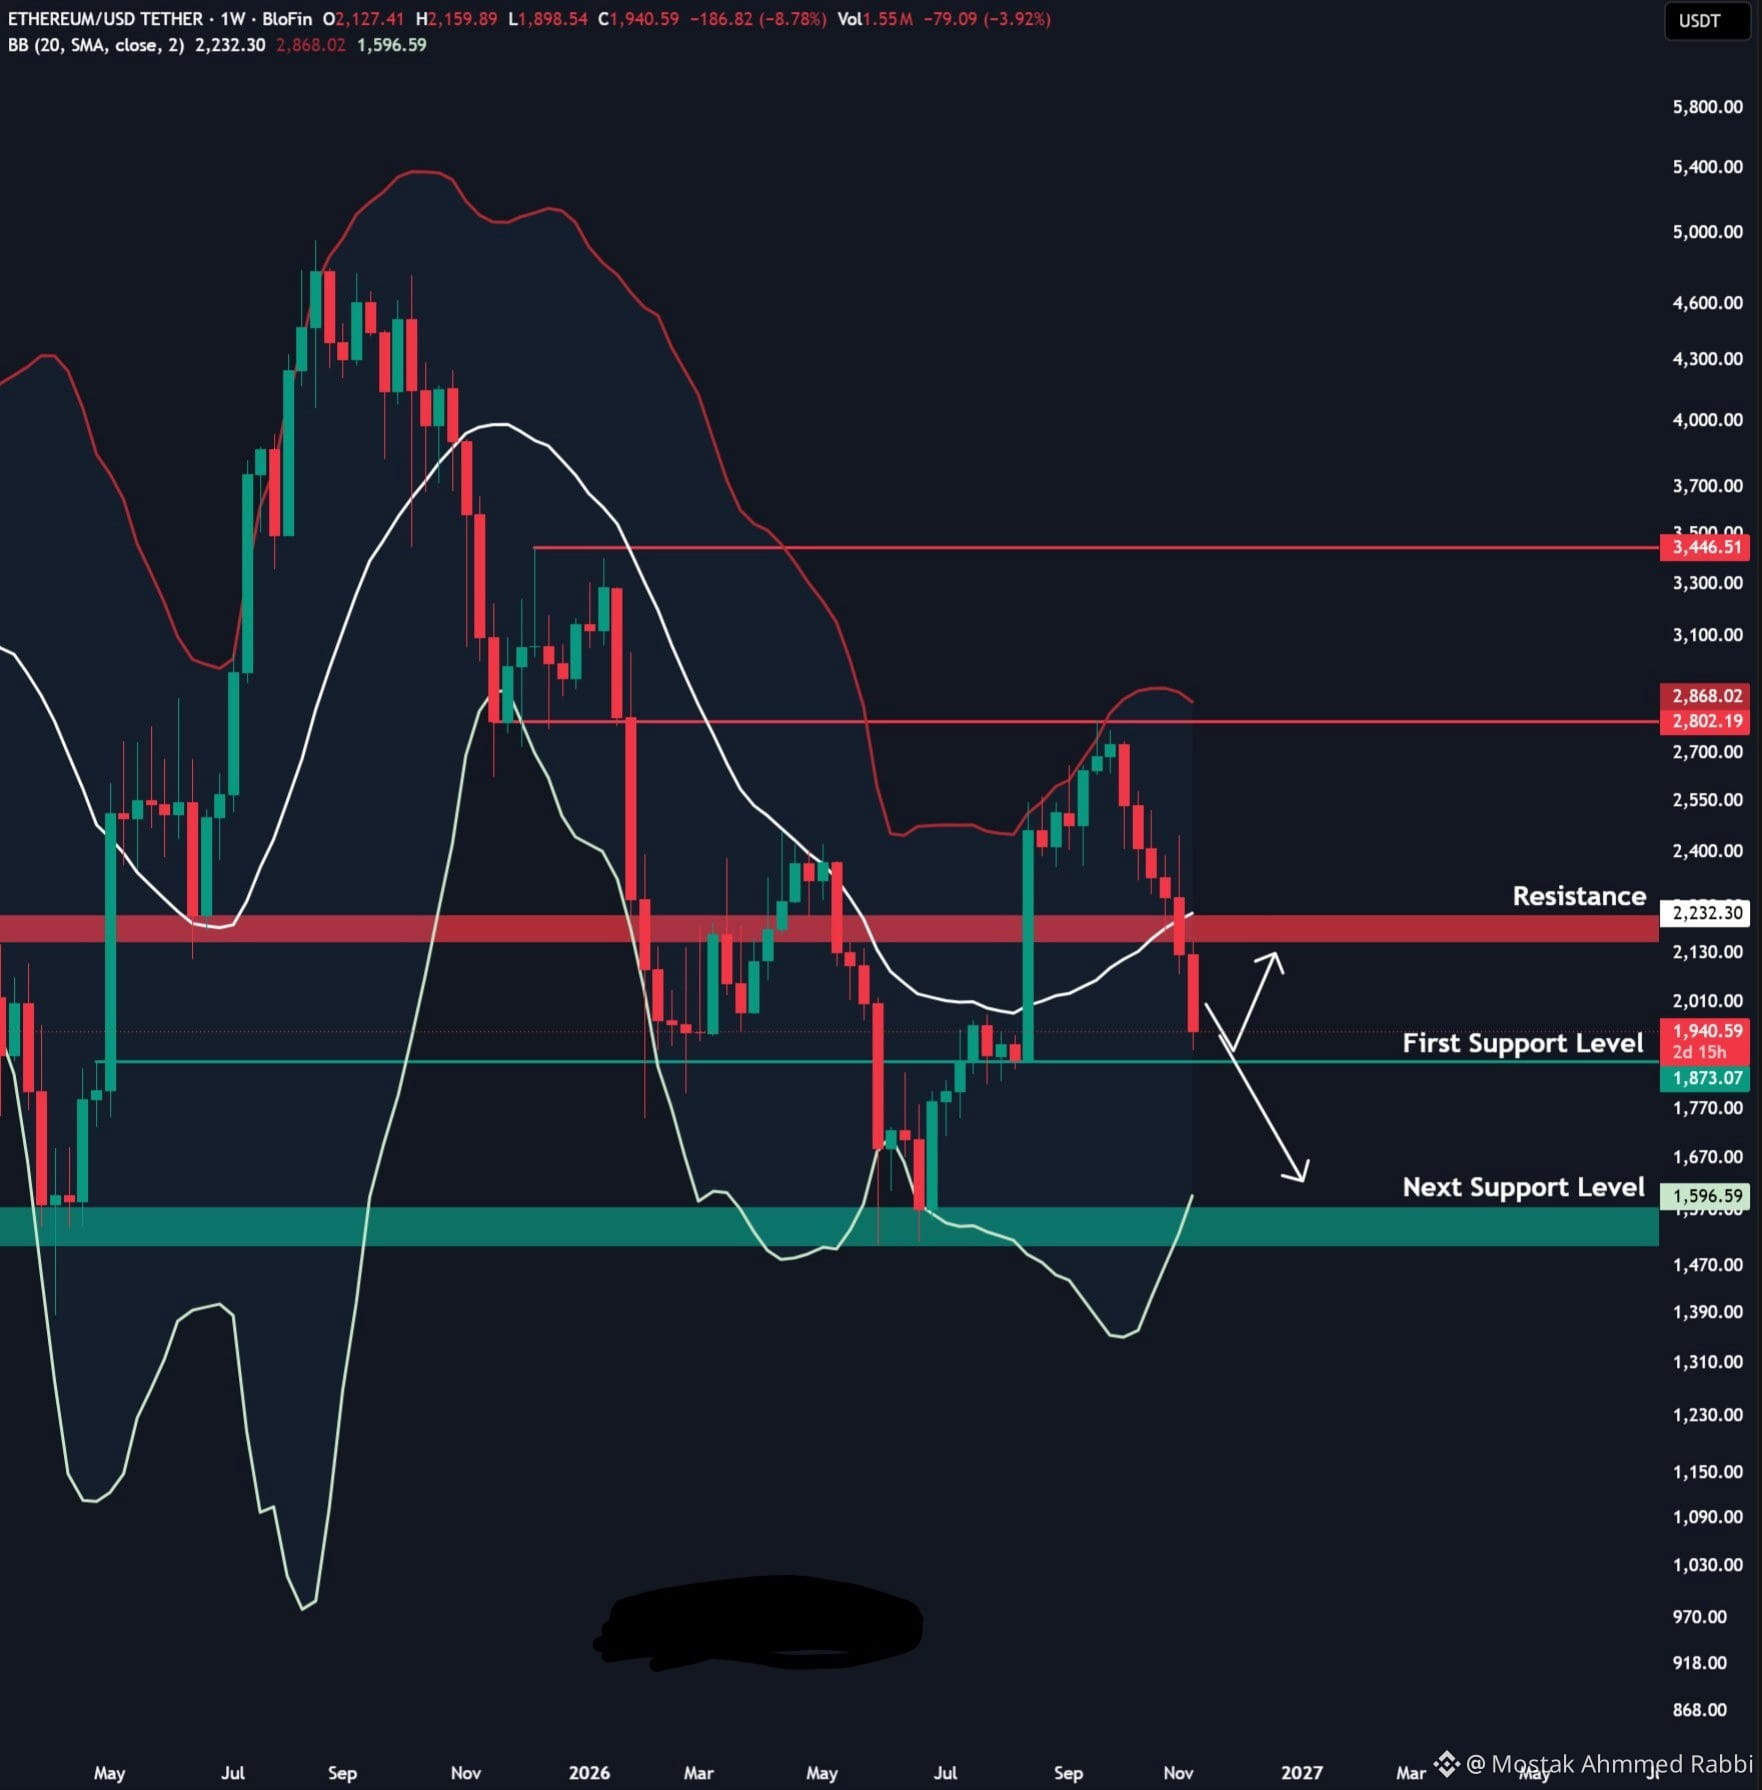
$ETH is back to the same level where the August pump started.
Now, ETH is at its last major support zone around $1,850-$1,950, and losing this could drop Ethereum to cycle lows.
#Ethereum
$ETH is back to the same level where the August pump started.
Now, ETH is at its last major support zone around $1,850-$1,950, and losing this could drop Ethereum to cycle lows.
#Ethereum
Now, ETH is at its last major support zone around $1,850-$1,950, and losing this could drop Ethereum to cycle lows.
#Ethereum
Shaokahn Miguel:
Tudo depende do BTC , eu arrisco Eth em 1450 a 1500.
1
1
1.1k

·
--
Partly True
🚨 ETHEREUM FOUNDATION SELLS ANOTHER 1,000 ETH!
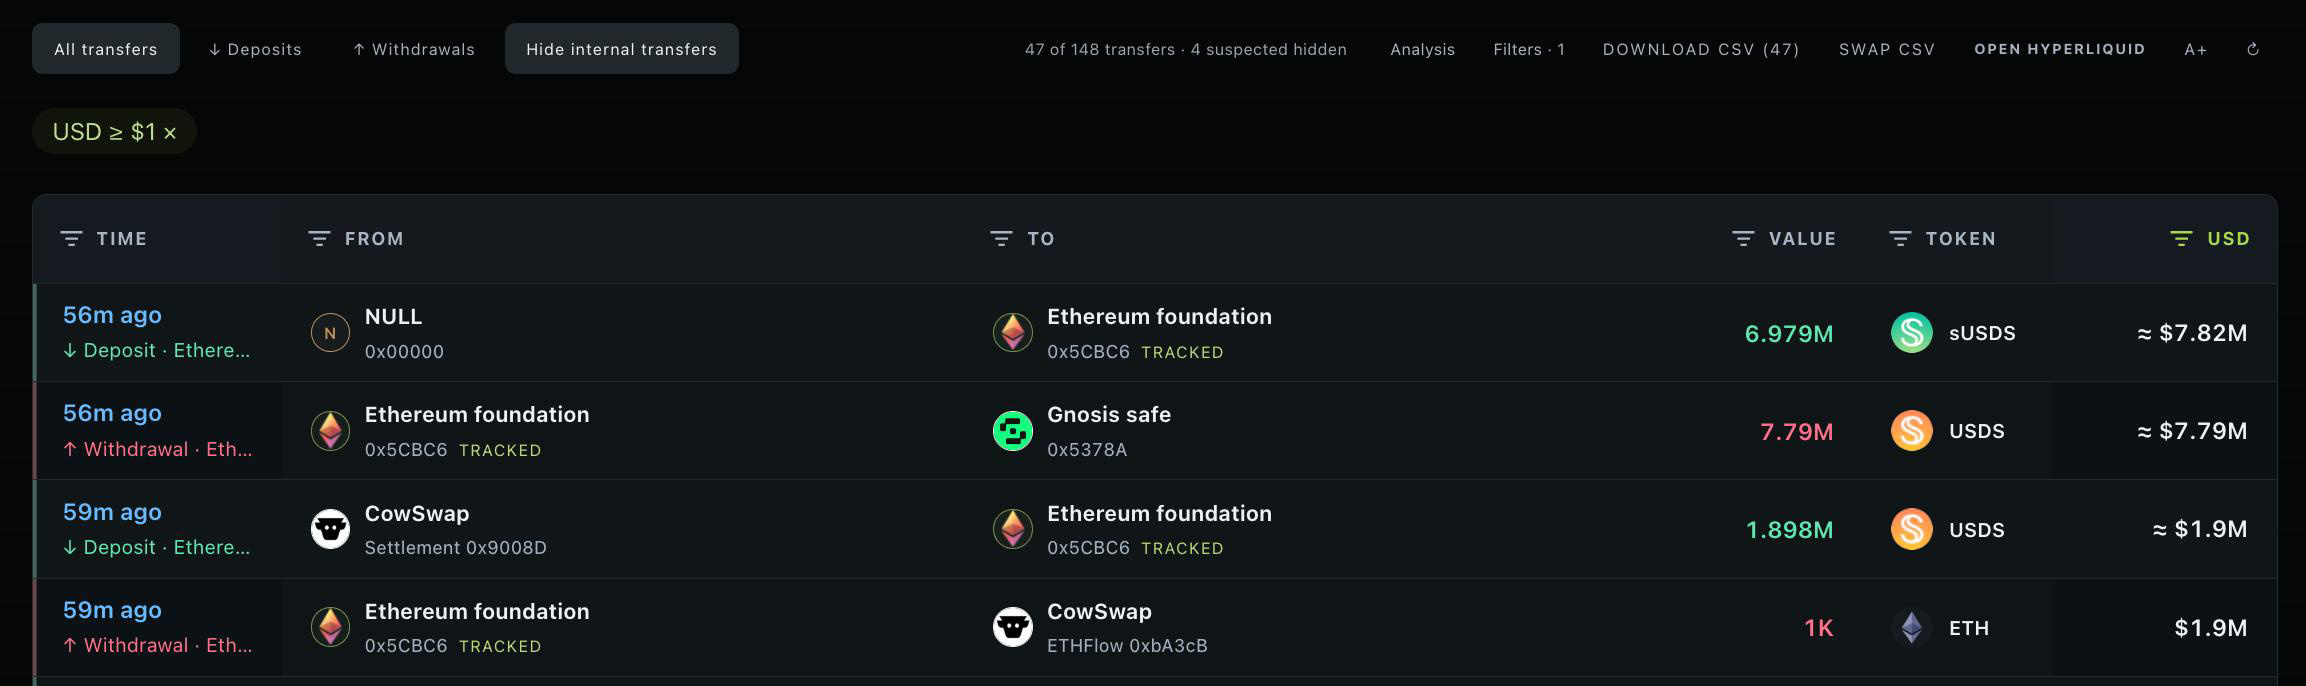
The Ethereum Foundation just swapped 1,000 $ETH (~$1.90M) for USDS through CoWSwap.
Over the past 4 days, the foundation has sold a total of 5,000 ETH for approximately 9.92M USDS.
It also transferred 7.79M USDS to a multisig Safe wallet within the past hour.
Is the foundation preparing for more treasury spending?
Follow me for more latest updates
#Ethereum $ETH
{future}(ETHUSDT)
🚨 ETHEREUM FOUNDATION SELLS ANOTHER 1,000 ETH!
The Ethereum Foundation just swapped 1,000 $ETH (~$1.90M) for USDS through CoWSwap.
Over the past 4 days, the foundation has sold a total of 5,000 ETH for approximately 9.92M USDS.
It also transferred 7.79M USDS to a multisig Safe wallet within the past hour.
Is the foundation preparing for more treasury spending?
Follow me for more latest updates
#Ethereum $ETH
The Ethereum Foundation just swapped 1,000 $ETH (~$1.90M) for USDS through CoWSwap.
Over the past 4 days, the foundation has sold a total of 5,000 ETH for approximately 9.92M USDS.
It also transferred 7.79M USDS to a multisig Safe wallet within the past hour.
Is the foundation preparing for more treasury spending?
Follow me for more latest updates
#Ethereum $ETH
3
1.2k
·
--
🚨 ANOTHER $2.7M IN ETH MOVED INTO TORNADO CASH!
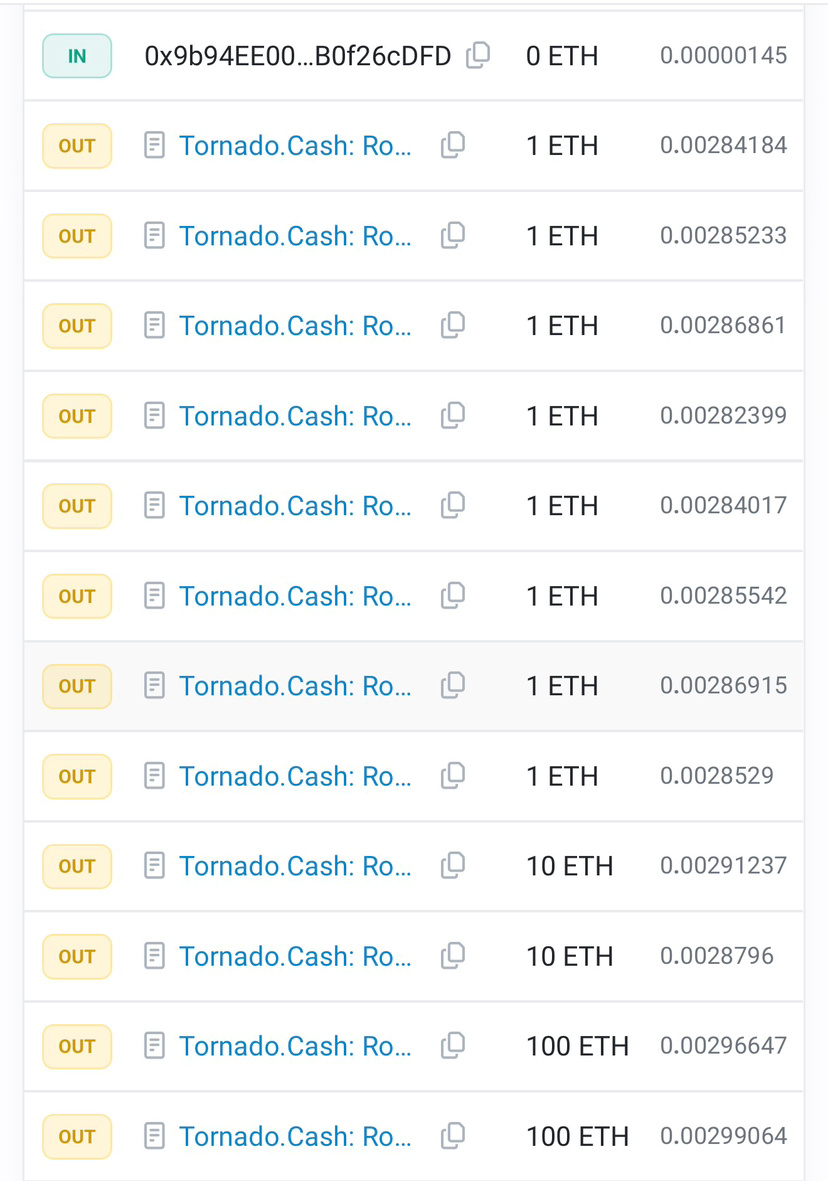
A wallet linked to a suspected threat actor has reportedly continued moving funds through Tornado Cash.
Latest on-chain activity:
• 1,529 $ETH (~$2.98M) transferred to a new wallet
• Approximately $2.7M subsequently deposited into Tornado Cash
• Similar fund movements have reportedly continued for weeks
The transfers raise further questions about the destination of the funds, although Tornado Cash deposits alone do not prove money laundering.
Will investigators be able to trace where the remaining funds go?
Follow me for more latest updates
#Ethereum $ETH
{future}(ETHUSDT)
🚨 ANOTHER $2.7M IN ETH MOVED INTO TORNADO CASH!
A wallet linked to a suspected threat actor has reportedly continued moving funds through Tornado Cash.
Latest on-chain activity:
• 1,529 $ETH (~$2.98M) transferred to a new wallet
• Approximately $2.7M subsequently deposited into Tornado Cash
• Similar fund movements have reportedly continued for weeks
The transfers raise further questions about the destination of the funds, although Tornado Cash deposits alone do not prove money laundering.
Will investigators be able to trace where the remaining funds go?
Follow me for more latest updates
#Ethereum $ETH
A wallet linked to a suspected threat actor has reportedly continued moving funds through Tornado Cash.
Latest on-chain activity:
• 1,529 $ETH (~$2.98M) transferred to a new wallet
• Approximately $2.7M subsequently deposited into Tornado Cash
• Similar fund movements have reportedly continued for weeks
The transfers raise further questions about the destination of the funds, although Tornado Cash deposits alone do not prove money laundering.
Will investigators be able to trace where the remaining funds go?
Follow me for more latest updates
#Ethereum $ETH
3
2.1k

·
--
Bearish
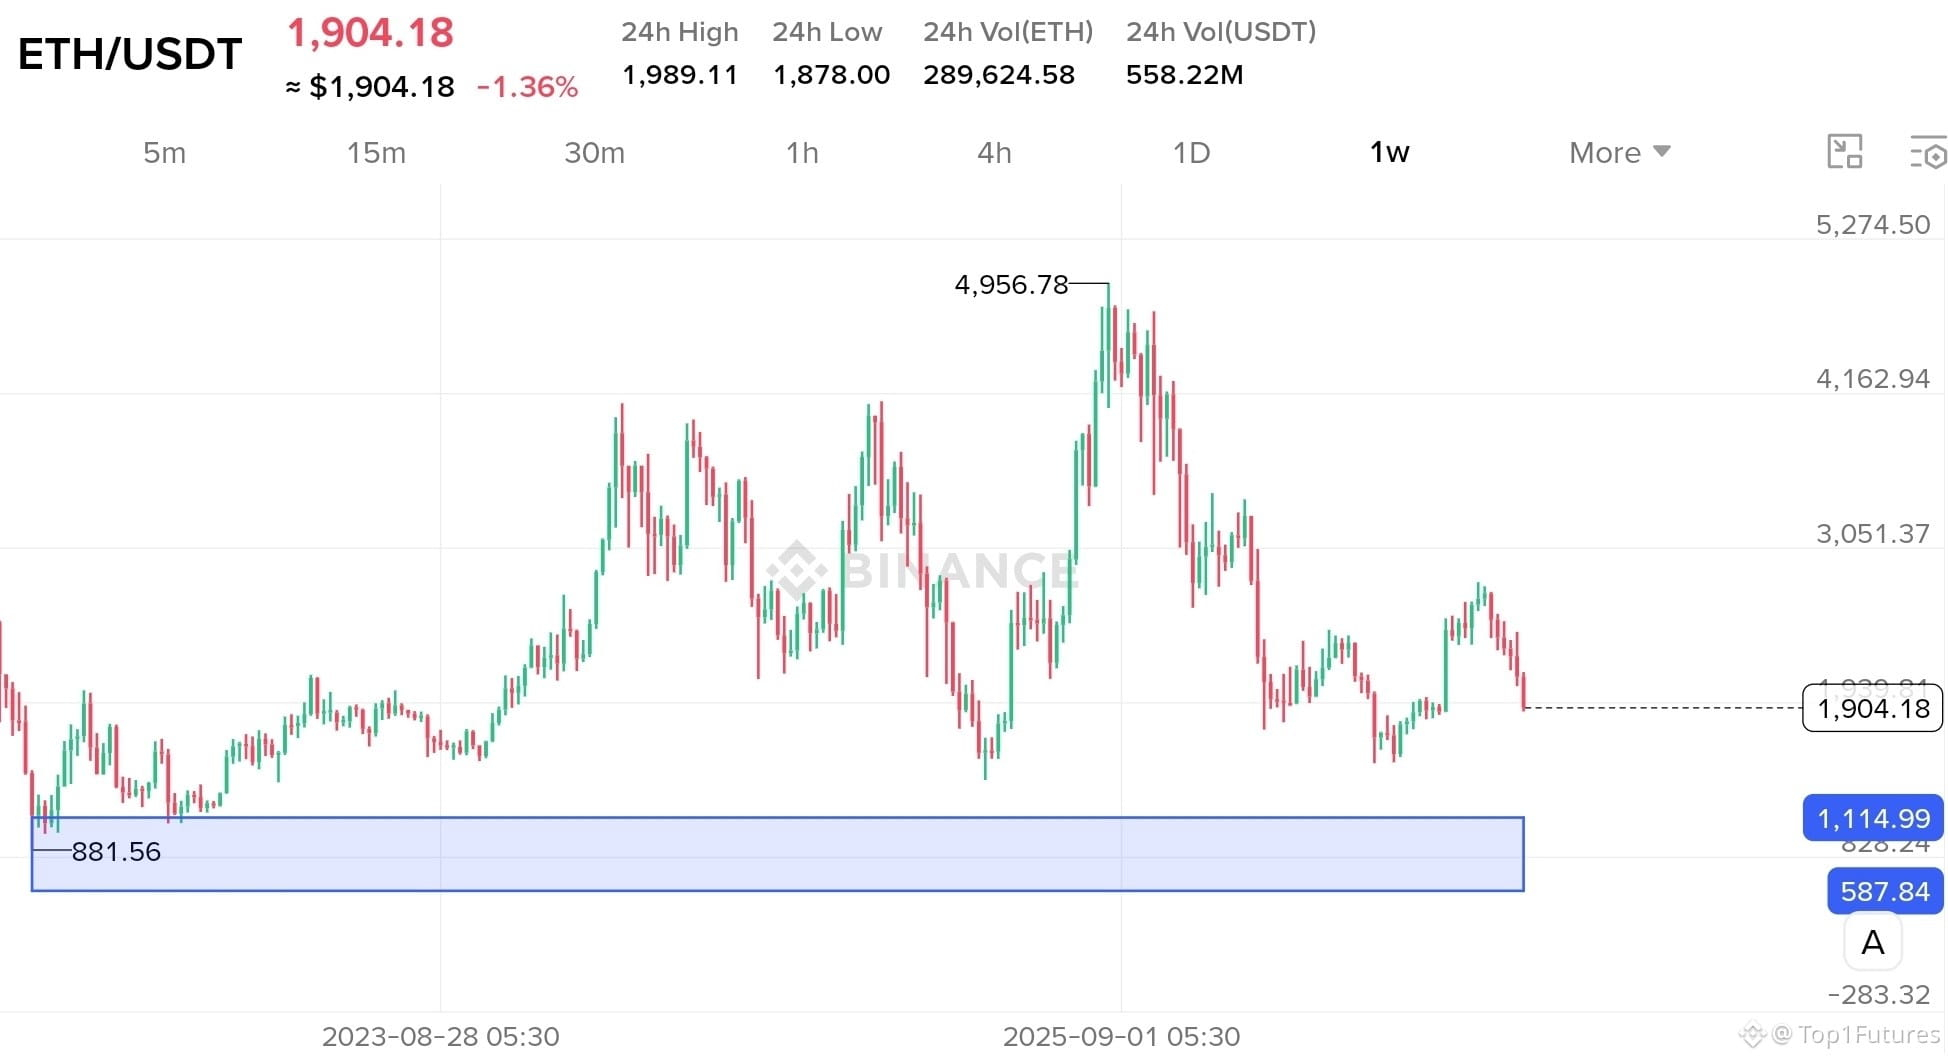
Honestly, I'm not interested in chasing $ETH at these prices...⚠️👀
#Ethereum is still trading much higher than my preferred buying area, so I'm happy to wait instead of rushing into a position.
Looking at the weekly chart, I have my eyes on the $1,100–$600 demand zone. If the current weakness continues, ETH could slowly move towards this area in the coming months. 📉
We might see some temporary bounces along the way, but I wouldn't be surprised if another deeper correction happens before a proper recovery.
My plan is simple: patience first, buying later. 🎯
No FOMO, I'll wait for my price!
Honestly, I'm not interested in chasing $ETH at these prices...⚠️👀
#Ethereum is still trading much higher than my preferred buying area, so I'm happy to wait instead of rushing into a position.
Looking at the weekly chart, I have my eyes on the $1,100–$600 demand zone. If the current weakness continues, ETH could slowly move towards this area in the coming months. 📉
We might see some temporary bounces along the way, but I wouldn't be surprised if another deeper correction happens before a proper recovery.
My plan is simple: patience first, buying later. 🎯
No FOMO, I'll wait for my price!
#Ethereum is still trading much higher than my preferred buying area, so I'm happy to wait instead of rushing into a position.
Looking at the weekly chart, I have my eyes on the $1,100–$600 demand zone. If the current weakness continues, ETH could slowly move towards this area in the coming months. 📉
We might see some temporary bounces along the way, but I wouldn't be surprised if another deeper correction happens before a proper recovery.
My plan is simple: patience first, buying later. 🎯
No FOMO, I'll wait for my price!
1
203

·
--
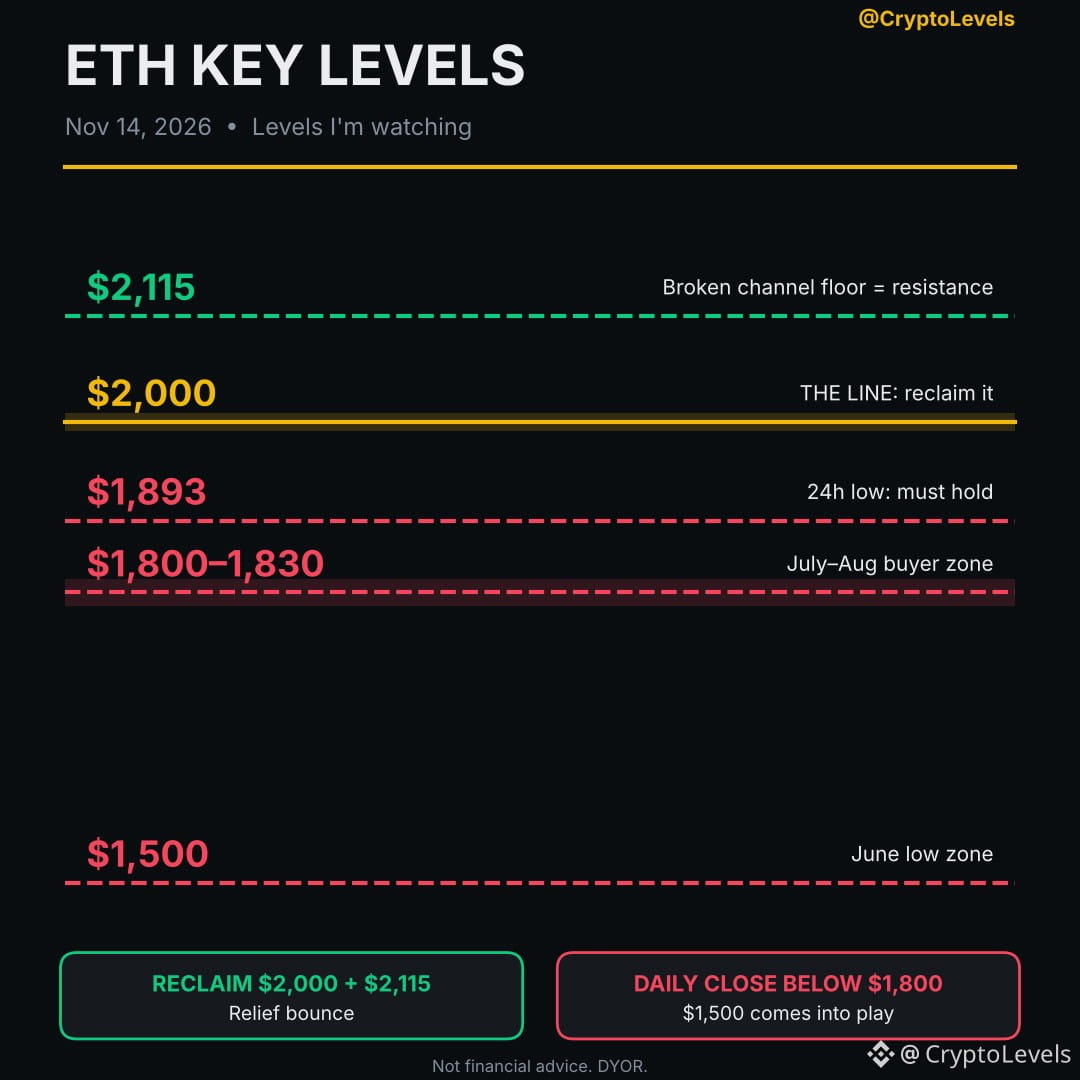
$ETH just lost $2,000. Now what?
$ETH ~$1,940 (-5% in 24h), down ~31% from the late-Sept high near $2,800.
📊 The data
• ~90% of $287M liquidations were longs
• US spot ETH ETFs: $524M out in 5 straight sessions
• RSI under 30: oversold, but oversold ≠ bottom
• Channel broken after holding since mid-September
🎯 Levels
• $2,115: old channel floor, now resistance
• $2,000: the line to reclaim
• $1,893: 24h low, must hold
• $1,800–1,830: July–Aug buyer zone
• Daily close below $1,800 → $1,500 comes into play
Bounces are normal in oversold markets. Bounces that hold above $2,115 are what change the trend.
Levels in the chart 👇
Where's your line: $1,800 or $2,000?
Not financial advice. DYOR.
$ETH H #Ethereum
$ETH just lost $2,000. Now what?
$ETH ~$1,940 (-5% in 24h), down ~31% from the late-Sept high near $2,800.
📊 The data
• ~90% of $287M liquidations were longs
• US spot ETH ETFs: $524M out in 5 straight sessions
• RSI under 30: oversold, but oversold ≠ bottom
• Channel broken after holding since mid-September
🎯 Levels
• $2,115: old channel floor, now resistance
• $2,000: the line to reclaim
• $1,893: 24h low, must hold
• $1,800–1,830: July–Aug buyer zone
• Daily close below $1,800 → $1,500 comes into play
Bounces are normal in oversold markets. Bounces that hold above $2,115 are what change the trend.
Levels in the chart 👇
Where's your line: $1,800 or $2,000?
Not financial advice. DYOR.
$ETH H #Ethereum
$ETH ~$1,940 (-5% in 24h), down ~31% from the late-Sept high near $2,800.
📊 The data
• ~90% of $287M liquidations were longs
• US spot ETH ETFs: $524M out in 5 straight sessions
• RSI under 30: oversold, but oversold ≠ bottom
• Channel broken after holding since mid-September
🎯 Levels
• $2,115: old channel floor, now resistance
• $2,000: the line to reclaim
• $1,893: 24h low, must hold
• $1,800–1,830: July–Aug buyer zone
• Daily close below $1,800 → $1,500 comes into play
Bounces are normal in oversold markets. Bounces that hold above $2,115 are what change the trend.
Levels in the chart 👇
Where's your line: $1,800 or $2,000?
Not financial advice. DYOR.
$ETH H #Ethereum
140


·
--

Article
$1.23 Billion Wiped Out in 24 Hours: Can Bitcoin Hold the Line at Its 200-Week Average?The crypto market just took a heavy hit. Over the past 24 hours, forced liquidations surged to $1.23 billion—nearly double the previous day’s wipeout—dragging the total crypto market cap down 5.75% to $2.33 trillion.
According to Coinglass data, bullish traders bore the brunt of the sell-off, with long positions accounting for 82.7% ($1.02 billion) of the total flush. In total, 163,631 traders were liquidated (up from 112,947 the day before). While roughly $1 billion of the damage happened in the first 12 hours, liquidation pressure has started to cool down, dropping to $233.07 million over the past 12 hours and $41.01 million in the last four.
(Interestingly, despite longs taking the beating, the largest single liquidation order was actually a $17.81 million $ETH short on Binance, closed at $1,979.21.)
Bitcoin ($BTC) Tests a Critical Weekly Level
Bitcoin accounted for more than half of the market wipeout with $637.24 million in liquidations—and a massive 90.8% of those were long bets.
Currently trading around **\(67,623** (down 3.70\% in 24 hours),\)BTC has slipped just below its 200-week Simple Moving Average (SMA) at $67,922. This is the exact same level that caught Bitcoin’s drop back in July and sparked its August rally. All eyes are now on Sunday’s weekly close.
Key $BTC Levels to Watch:
• Immediate Support ($66,000 – $67,000): A strong historical zone that previously acted as tough resistance between June and August.
• Major Demand Zone ($62,300): Buyers stepped in to defend this level twice earlier this year (late February and pre-August breakout). If this breaks, we could see a sweep toward $58,000.
• Upside Resistance ($75,000): The first major hurdle bulls need to reclaim if $BTC bounces.
Ethereum ($ETH) Loses Key Support
Ethereum saw $256.52 million in liquidations over the last 24 hours, with 76.3% coming from long positions.
Trading down 3.37% at **\(1,903.78**,\)ETH has slipped below a key Fibonacci support level at $1,920.51. If sellers keep control, the next major support zone sits down at $1,832.78.
What’s Next for the Market?
Bullish traders have absorbed the majority of liquidations for two straight days, leaving long positions heavily exposed heading into a crucial stretch of macro and institutional events:
1. Sunday’s Weekly Close: Will $BTC reclaim the $67,922 200-week SMA before the weekly candle closes?
2. November 30 (MSCI Index Drop): MSCI is set to remove Strategy—the largest corporate Bitcoin holder—from its benchmark indexes, which could trigger passive outflows.
3. December 9 (FOMC Meeting): The Federal Reserve’s upcoming interest rate decision will set the tone for risk assets heading into year-end.
What’s your game plan right now? Are you buying this dip at the 200-week moving average, or waiting for Sunday’s close before making a move? Drop your thoughts below! 👇
{spot}(BTCUSDT)
{spot}(ETHUSDT)
#Ethereum #CryptoNews #MarketUpdate #BTC #ETH
$1.23 Billion Wiped Out in 24 Hours: Can Bitcoin Hold the Line at Its 200-Week Average?
The crypto market just took a heavy hit. Over the past 24 hours, forced liquidations surged to $1.23 billion—nearly double the previous day’s wipeout—dragging the total crypto market cap down 5.75% to $2.33 trillion.
According to Coinglass data, bullish traders bore the brunt of the sell-off, with long positions accounting for 82.7% ($1.02 billion) of the total flush. In total, 163,631 traders were liquidated (up from 112,947 the day before). While roughly $1 billion of the damage happened in the first 12 hours, liquidation pressure has started to cool down, dropping to $233.07 million over the past 12 hours and $41.01 million in the last four.
(Interestingly, despite longs taking the beating, the largest single liquidation order was actually a $17.81 million $ETH short on Binance, closed at $1,979.21.)
Bitcoin ($BTC ) Tests a Critical Weekly Level
Bitcoin accounted for more than half of the market wipeout with $637.24 million in liquidations—and a massive 90.8% of those were long bets.
Currently trading around **\(67,623** (down 3.70\% in 24 hours),\)BTC has slipped just below its 200-week Simple Moving Average (SMA) at $67,922. This is the exact same level that caught Bitcoin’s drop back in July and sparked its August rally. All eyes are now on Sunday’s weekly close.
Key $BTC Levels to Watch:
• Immediate Support ($66,000 – $67,000): A strong historical zone that previously acted as tough resistance between June and August.
• Major Demand Zone ($62,300): Buyers stepped in to defend this level twice earlier this year (late February and pre-August breakout). If this breaks, we could see a sweep toward $58,000.
• Upside Resistance ($75,000): The first major hurdle bulls need to reclaim if $BTC bounces.
Ethereum ($ETH ) Loses Key Support
Ethereum saw $256.52 million in liquidations over the last 24 hours, with 76.3% coming from long positions.
Trading down 3.37% at **\(1,903.78**,\)ETH has slipped below a key Fibonacci support level at $1,920.51. If sellers keep control, the next major support zone sits down at $1,832.78.
What’s Next for the Market?
Bullish traders have absorbed the majority of liquidations for two straight days, leaving long positions heavily exposed heading into a crucial stretch of macro and institutional events:
1. Sunday’s Weekly Close: Will $BTC reclaim the $67,922 200-week SMA before the weekly candle closes?
2. November 30 (MSCI Index Drop): MSCI is set to remove Strategy—the largest corporate Bitcoin holder—from its benchmark indexes, which could trigger passive outflows.
3. December 9 (FOMC Meeting): The Federal Reserve’s upcoming interest rate decision will set the tone for risk assets heading into year-end.
What’s your game plan right now? Are you buying this dip at the 200-week moving average, or waiting for Sunday’s close before making a move? Drop your thoughts below! 👇
#Ethereum #CryptoNews #MarketUpdate #BTC #ETH
According to Coinglass data, bullish traders bore the brunt of the sell-off, with long positions accounting for 82.7% ($1.02 billion) of the total flush. In total, 163,631 traders were liquidated (up from 112,947 the day before). While roughly $1 billion of the damage happened in the first 12 hours, liquidation pressure has started to cool down, dropping to $233.07 million over the past 12 hours and $41.01 million in the last four.
(Interestingly, despite longs taking the beating, the largest single liquidation order was actually a $17.81 million $ETH short on Binance, closed at $1,979.21.)
Bitcoin ($BTC ) Tests a Critical Weekly Level
Bitcoin accounted for more than half of the market wipeout with $637.24 million in liquidations—and a massive 90.8% of those were long bets.
Currently trading around **\(67,623** (down 3.70\% in 24 hours),\)BTC has slipped just below its 200-week Simple Moving Average (SMA) at $67,922. This is the exact same level that caught Bitcoin’s drop back in July and sparked its August rally. All eyes are now on Sunday’s weekly close.
Key $BTC Levels to Watch:
• Immediate Support ($66,000 – $67,000): A strong historical zone that previously acted as tough resistance between June and August.
• Major Demand Zone ($62,300): Buyers stepped in to defend this level twice earlier this year (late February and pre-August breakout). If this breaks, we could see a sweep toward $58,000.
• Upside Resistance ($75,000): The first major hurdle bulls need to reclaim if $BTC bounces.
Ethereum ($ETH ) Loses Key Support
Ethereum saw $256.52 million in liquidations over the last 24 hours, with 76.3% coming from long positions.
Trading down 3.37% at **\(1,903.78**,\)ETH has slipped below a key Fibonacci support level at $1,920.51. If sellers keep control, the next major support zone sits down at $1,832.78.
What’s Next for the Market?
Bullish traders have absorbed the majority of liquidations for two straight days, leaving long positions heavily exposed heading into a crucial stretch of macro and institutional events:
1. Sunday’s Weekly Close: Will $BTC reclaim the $67,922 200-week SMA before the weekly candle closes?
2. November 30 (MSCI Index Drop): MSCI is set to remove Strategy—the largest corporate Bitcoin holder—from its benchmark indexes, which could trigger passive outflows.
3. December 9 (FOMC Meeting): The Federal Reserve’s upcoming interest rate decision will set the tone for risk assets heading into year-end.
What’s your game plan right now? Are you buying this dip at the 200-week moving average, or waiting for Sunday’s close before making a move? Drop your thoughts below! 👇
#Ethereum #CryptoNews #MarketUpdate #BTC #ETH
1
202

$ETH slips below $2,000: Crucial support test or deeper correction ahead? 📊
Ethereum ($ETH ) broke below the
psychological $2,000 mark today, trading around $1,920 – $1,950. Selling pressure is fueled by continued ETH ETF outflows ($700M in November alone) and reports of a Foundation-linked wallet selling 2,000 ETH.
Key Levels to Watch:
🔹 Support: $1,900 – $1,940. Bulls must defend this zone to prevent a steeper leg down.
🔹 Resistance: $2,050 – $2,100. Reclaiming $2,000 is the first step toward a relief bounce.
🔹 Catalyst: The upcoming Glamsterdam network upgrade later this quarter could help shift sentiment.
Not financial advice (DYOR). Manage your risk!
Are you buying $ETH under $2,000, or waiting for lower prices? 👇
If this breakdown helped you navigate the chart, feel free to buy me a coffee via the "Tip" button below! Happy trading ☕️🚀
#ETH #Ethereum #BinanceSquare
{future}(ETHUSDT)
$ETH slips below $2,000: Crucial support test or deeper correction ahead? 📊
Ethereum ($ETH ) broke below the
psychological $2,000 mark today, trading around $1,920 – $1,950. Selling pressure is fueled by continued ETH ETF outflows ($700M in November alone) and reports of a Foundation-linked wallet selling 2,000 ETH.
Key Levels to Watch:
🔹 Support: $1,900 – $1,940. Bulls must defend this zone to prevent a steeper leg down.
🔹 Resistance: $2,050 – $2,100. Reclaiming $2,000 is the first step toward a relief bounce.
🔹 Catalyst: The upcoming Glamsterdam network upgrade later this quarter could help shift sentiment.
Not financial advice (DYOR). Manage your risk!
Are you buying $ETH under $2,000, or waiting for lower prices? 👇
If this breakdown helped you navigate the chart, feel free to buy me a coffee via the "Tip" button below! Happy trading ☕️🚀
#ETH #Ethereum #BinanceSquare
Ethereum ($ETH ) broke below the
psychological $2,000 mark today, trading around $1,920 – $1,950. Selling pressure is fueled by continued ETH ETF outflows ($700M in November alone) and reports of a Foundation-linked wallet selling 2,000 ETH.
Key Levels to Watch:
🔹 Support: $1,900 – $1,940. Bulls must defend this zone to prevent a steeper leg down.
🔹 Resistance: $2,050 – $2,100. Reclaiming $2,000 is the first step toward a relief bounce.
🔹 Catalyst: The upcoming Glamsterdam network upgrade later this quarter could help shift sentiment.
Not financial advice (DYOR). Manage your risk!
Are you buying $ETH under $2,000, or waiting for lower prices? 👇
If this breakdown helped you navigate the chart, feel free to buy me a coffee via the "Tip" button below! Happy trading ☕️🚀
#ETH #Ethereum #BinanceSquare
71


ETH, BNB and XRP Market Pulse: Oversold Conditions Meet a Cautious Market
The latest Binance spot data shows Ethereum trading near $1,908.87, BNB near $617.53, and XRP near $0.9908. All three assets are under visible short term pressure, but the deeper story is not simply that prices are falling. The market is testing conviction, liquidity, and the ability of each ecosystem to attract demand when sentiment is fragile.
Ethereum is down 2.46% over the latest 24 hour spot session, moving below its 7 day, 25 day, and 99 day moving averages. ETH has also declined 14.73% over seven days and 21.17% over 30 days. The daily RSI reading is 13.27, which signals an oversold condition. That does not guarantee an immediate recovery, but it does show how aggressive the recent selling has been. ETH remains the central settlement layer for a large part of decentralized finance, stablecoin activity, tokenization, and onchain development. For traders, the key question is whether fresh demand can return as selling pressure cools. The MACD remains bearish and the SuperTrend is still pointing down, so the market needs stronger confirmation before any shift in momentum can be treated as durable.
BNB is trading around $617.53 and is down 3.54% during the latest 24 hour spot session. Its seven day decline stands at 10.98%, while the 30 day move is down 15.47%. BNB’s daily RSI is 12.53, placing it in oversold territory as well. The asset is currently below its major moving averages, while the MACD and SuperTrend continue to reflect bearish momentum. Even so, BNB’s relevance is tied to activity across the BNB Chain ecosystem and Binance product utility. This creates a different type of market profile compared with ETH. Its performance can be influenced by broader crypto sentiment, ecosystem participation, onchain demand, and platform related utility. The short term structure remains weak, but oversold conditions mean volatility can increase quickly if demand returns.
XRP is trading near $0.9908, down 2.74% over the latest 24 hour spot session. It has fallen 15.97% over seven days and 25.59% over 30 days, making it the weakest performer of the three across those measured periods. XRP’s daily RSI sits at 7.93, an extremely oversold reading that reflects a sharp imbalance between sellers and buyers. Yet oversold does not automatically mean a trend reversal. XRP remains below its 7 day, 25 day, and 99 day moving averages, with a bearish MACD structure and a downward SuperTrend. Its market identity remains closely connected to payments focused blockchain infrastructure and liquidity driven use cases. The next phase will depend on whether trading participation strengthens and whether sellers begin to lose control near current levels.
Across ETH, BNB, and XRP, the common theme is clear: the market is under pressure, capital flow is negative, and technical momentum remains bearish. ETH recorded daily capital outflow of 7.55%, BNB showed 5.15% outflow, and XRP showed 10.27% outflow. These figures suggest that caution remains active across major altcoins.
However, the current setup is also a reminder that markets often become most emotionally challenging when indicators are deeply oversold. A strong recovery would require improving volume, reduced selling pressure, and a return above important trend measures. Without those confirmations, volatility and downside risk can remain elevated.
Smart market participants focus on risk control, liquidity, volume behavior, and confirmation rather than emotion. In crypto, patience can be just as important as momentum.
#Ethereum #BNB #XRP #CryptoMarket #Altcoins
$ETH
{spot}(ETHUSDT)
$BNB
{spot}(BNBUSDT)
$XRP
{spot}(XRPUSDT)
ETH, BNB and XRP Market Pulse: Oversold Conditions Meet a Cautious Market
The latest Binance spot data shows Ethereum trading near $1,908.87, BNB near $617.53, and XRP near $0.9908. All three assets are under visible short term pressure, but the deeper story is not simply that prices are falling. The market is testing conviction, liquidity, and the ability of each ecosystem to attract demand when sentiment is fragile.
Ethereum is down 2.46% over the latest 24 hour spot session, moving below its 7 day, 25 day, and 99 day moving averages. ETH has also declined 14.73% over seven days and 21.17% over 30 days. The daily RSI reading is 13.27, which signals an oversold condition. That does not guarantee an immediate recovery, but it does show how aggressive the recent selling has been. ETH remains the central settlement layer for a large part of decentralized finance, stablecoin activity, tokenization, and onchain development. For traders, the key question is whether fresh demand can return as selling pressure cools. The MACD remains bearish and the SuperTrend is still pointing down, so the market needs stronger confirmation before any shift in momentum can be treated as durable.
BNB is trading around $617.53 and is down 3.54% during the latest 24 hour spot session. Its seven day decline stands at 10.98%, while the 30 day move is down 15.47%. BNB’s daily RSI is 12.53, placing it in oversold territory as well. The asset is currently below its major moving averages, while the MACD and SuperTrend continue to reflect bearish momentum. Even so, BNB’s relevance is tied to activity across the BNB Chain ecosystem and Binance product utility. This creates a different type of market profile compared with ETH. Its performance can be influenced by broader crypto sentiment, ecosystem participation, onchain demand, and platform related utility. The short term structure remains weak, but oversold conditions mean volatility can increase quickly if demand returns.
XRP is trading near $0.9908, down 2.74% over the latest 24 hour spot session. It has fallen 15.97% over seven days and 25.59% over 30 days, making it the weakest performer of the three across those measured periods. XRP’s daily RSI sits at 7.93, an extremely oversold reading that reflects a sharp imbalance between sellers and buyers. Yet oversold does not automatically mean a trend reversal. XRP remains below its 7 day, 25 day, and 99 day moving averages, with a bearish MACD structure and a downward SuperTrend. Its market identity remains closely connected to payments focused blockchain infrastructure and liquidity driven use cases. The next phase will depend on whether trading participation strengthens and whether sellers begin to lose control near current levels.
Across ETH, BNB, and XRP, the common theme is clear: the market is under pressure, capital flow is negative, and technical momentum remains bearish. ETH recorded daily capital outflow of 7.55%, BNB showed 5.15% outflow, and XRP showed 10.27% outflow. These figures suggest that caution remains active across major altcoins.
However, the current setup is also a reminder that markets often become most emotionally challenging when indicators are deeply oversold. A strong recovery would require improving volume, reduced selling pressure, and a return above important trend measures. Without those confirmations, volatility and downside risk can remain elevated.
Smart market participants focus on risk control, liquidity, volume behavior, and confirmation rather than emotion. In crypto, patience can be just as important as momentum.
#Ethereum #BNB #XRP #CryptoMarket #Altcoins
$ETH
$BNB
$XRP
Ethereum is down 2.46% over the latest 24 hour spot session, moving below its 7 day, 25 day, and 99 day moving averages. ETH has also declined 14.73% over seven days and 21.17% over 30 days. The daily RSI reading is 13.27, which signals an oversold condition. That does not guarantee an immediate recovery, but it does show how aggressive the recent selling has been. ETH remains the central settlement layer for a large part of decentralized finance, stablecoin activity, tokenization, and onchain development. For traders, the key question is whether fresh demand can return as selling pressure cools. The MACD remains bearish and the SuperTrend is still pointing down, so the market needs stronger confirmation before any shift in momentum can be treated as durable.
BNB is trading around $617.53 and is down 3.54% during the latest 24 hour spot session. Its seven day decline stands at 10.98%, while the 30 day move is down 15.47%. BNB’s daily RSI is 12.53, placing it in oversold territory as well. The asset is currently below its major moving averages, while the MACD and SuperTrend continue to reflect bearish momentum. Even so, BNB’s relevance is tied to activity across the BNB Chain ecosystem and Binance product utility. This creates a different type of market profile compared with ETH. Its performance can be influenced by broader crypto sentiment, ecosystem participation, onchain demand, and platform related utility. The short term structure remains weak, but oversold conditions mean volatility can increase quickly if demand returns.
XRP is trading near $0.9908, down 2.74% over the latest 24 hour spot session. It has fallen 15.97% over seven days and 25.59% over 30 days, making it the weakest performer of the three across those measured periods. XRP’s daily RSI sits at 7.93, an extremely oversold reading that reflects a sharp imbalance between sellers and buyers. Yet oversold does not automatically mean a trend reversal. XRP remains below its 7 day, 25 day, and 99 day moving averages, with a bearish MACD structure and a downward SuperTrend. Its market identity remains closely connected to payments focused blockchain infrastructure and liquidity driven use cases. The next phase will depend on whether trading participation strengthens and whether sellers begin to lose control near current levels.
Across ETH, BNB, and XRP, the common theme is clear: the market is under pressure, capital flow is negative, and technical momentum remains bearish. ETH recorded daily capital outflow of 7.55%, BNB showed 5.15% outflow, and XRP showed 10.27% outflow. These figures suggest that caution remains active across major altcoins.
However, the current setup is also a reminder that markets often become most emotionally challenging when indicators are deeply oversold. A strong recovery would require improving volume, reduced selling pressure, and a return above important trend measures. Without those confirmations, volatility and downside risk can remain elevated.
Smart market participants focus on risk control, liquidity, volume behavior, and confirmation rather than emotion. In crypto, patience can be just as important as momentum.
#Ethereum #BNB #XRP #CryptoMarket #Altcoins
$ETH
$BNB
$XRP
1
10

·
--
$ETH BELOW $2,000! Is Ethereum Heading for Another Drop?
Ethereum is facing serious selling pressure as $ETH falls below the important psychological $2,000 level.
What's Happening?
ETH is trading around $1,900.
Ethereum has dropped nearly 4% in 24 hours.
Heavy futures liquidations are adding pressure.
Ethereum Foundation-linked sales have attracted market attention.
Institutional ETF outflows have weighed on sentiment.
🔍 Key Levels to Watch:
Support: $1,898
Next Support: $1,832
Important Resistance: $2,000
My Market View:
If ETH manages to hold its current support and buying volume increases, a recovery toward $2,000 could become possible.
However, losing support could bring further downside pressure.
What's Your Prediction?
Will Ethereum reclaim $2,000, or are we going to see another correction?
Share your thoughts! DYOR
#Ethereum #ETH #CryptoNews #ALTCOİNS #BinanceSquare
$ETH BELOW $2,000! Is Ethereum Heading for Another Drop?
Ethereum is facing serious selling pressure as $ETH falls below the important psychological $2,000 level.
What's Happening?
ETH is trading around $1,900.
Ethereum has dropped nearly 4% in 24 hours.
Heavy futures liquidations are adding pressure.
Ethereum Foundation-linked sales have attracted market attention.
Institutional ETF outflows have weighed on sentiment.
🔍 Key Levels to Watch:
Support: $1,898
Next Support: $1,832
Important Resistance: $2,000
My Market View:
If ETH manages to hold its current support and buying volume increases, a recovery toward $2,000 could become possible.
However, losing support could bring further downside pressure.
What's Your Prediction?
Will Ethereum reclaim $2,000, or are we going to see another correction?
Share your thoughts! DYOR
#Ethereum #ETH #CryptoNews #ALTCOİNS #BinanceSquare
Ethereum is facing serious selling pressure as $ETH falls below the important psychological $2,000 level.
What's Happening?
ETH is trading around $1,900.
Ethereum has dropped nearly 4% in 24 hours.
Heavy futures liquidations are adding pressure.
Ethereum Foundation-linked sales have attracted market attention.
Institutional ETF outflows have weighed on sentiment.
🔍 Key Levels to Watch:
Support: $1,898
Next Support: $1,832
Important Resistance: $2,000
My Market View:
If ETH manages to hold its current support and buying volume increases, a recovery toward $2,000 could become possible.
However, losing support could bring further downside pressure.
What's Your Prediction?
Will Ethereum reclaim $2,000, or are we going to see another correction?
Share your thoughts! DYOR
#Ethereum #ETH #CryptoNews #ALTCOİNS #BinanceSquare

123

·
--
Bullish
🚀 Ethereum ($ETH ): More Than Just a Cryptocurrency!
Ethereum remains one of the most important projects in the crypto ecosystem, powering DeFi, NFTs, smart contracts, and thousands of decentralized applications.
Here’s why $ETH deserves attention:
🔹 Strong Ecosystem: Thousands of projects are built on Ethereum.
🔹 Real Utility: ETH is used for transaction fees and interacting with decentralized applications.
🔹 Institutional Interest: Ethereum continues to attract attention from major financial players.
🔹 Long-Term Potential: Its role in DeFi, tokenization, and Web3 makes it an important asset to watch.
📊 My Take: I believe Ethereum's ecosystem growth is worth watching. Instead of chasing every short-term price movement, I prefer understanding the fundamentals and monitoring key market levels.
What do you think about $ETH?
Are you accumulating, holding, or waiting for a better entry?
#Ethereum #ETH #Crypto #Binance #SpotTradin
🚀 Ethereum ($ETH ): More Than Just a Cryptocurrency!
Ethereum remains one of the most important projects in the crypto ecosystem, powering DeFi, NFTs, smart contracts, and thousands of decentralized applications.
Here’s why $ETH deserves attention:
🔹 Strong Ecosystem: Thousands of projects are built on Ethereum.
🔹 Real Utility: ETH is used for transaction fees and interacting with decentralized applications.
🔹 Institutional Interest: Ethereum continues to attract attention from major financial players.
🔹 Long-Term Potential: Its role in DeFi, tokenization, and Web3 makes it an important asset to watch.
📊 My Take: I believe Ethereum's ecosystem growth is worth watching. Instead of chasing every short-term price movement, I prefer understanding the fundamentals and monitoring key market levels.
What do you think about $ETH ?
Are you accumulating, holding, or waiting for a better entry?
#Ethereum #ETH #Crypto #Binance #SpotTradin
Ethereum remains one of the most important projects in the crypto ecosystem, powering DeFi, NFTs, smart contracts, and thousands of decentralized applications.
Here’s why $ETH deserves attention:
🔹 Strong Ecosystem: Thousands of projects are built on Ethereum.
🔹 Real Utility: ETH is used for transaction fees and interacting with decentralized applications.
🔹 Institutional Interest: Ethereum continues to attract attention from major financial players.
🔹 Long-Term Potential: Its role in DeFi, tokenization, and Web3 makes it an important asset to watch.
📊 My Take: I believe Ethereum's ecosystem growth is worth watching. Instead of chasing every short-term price movement, I prefer understanding the fundamentals and monitoring key market levels.
What do you think about $ETH ?
Are you accumulating, holding, or waiting for a better entry?
#Ethereum #ETH #Crypto #Binance #SpotTradin
User-76d17469:
Good🖤
1.5k
1
60
1.5k

·
--
Bearish
🚨 $ETH Market Analysis | November 14, 2026
💰 Current Price: $1,904.90
📉 24H Change: -2.70%
🔴 Support: $1,875 – $1,823
🟢 Resistance: $1,999 – $2,070
ETH is currently showing a bearish market structure. With RSI around 24, the market is in oversold territory. If the $1,875 support level fails to hold, further downside pressure may follow.
Market Sentiment: Bearish 📉
$ETH
{future}(ETHUSDT)
#ETH #Ethereum #CryptoMarket
🚨 $ETH Market Analysis | November 14, 2026
💰 Current Price: $1,904.90
📉 24H Change: -2.70%
🔴 Support: $1,875 – $1,823
🟢 Resistance: $1,999 – $2,070
ETH is currently showing a bearish market structure. With RSI around 24, the market is in oversold territory. If the $1,875 support level fails to hold, further downside pressure may follow.
Market Sentiment: Bearish 📉
$ETH
#ETH #Ethereum #CryptoMarket
💰 Current Price: $1,904.90
📉 24H Change: -2.70%
🔴 Support: $1,875 – $1,823
🟢 Resistance: $1,999 – $2,070
ETH is currently showing a bearish market structure. With RSI around 24, the market is in oversold territory. If the $1,875 support level fails to hold, further downside pressure may follow.
Market Sentiment: Bearish 📉
$ETH
#ETH #Ethereum #CryptoMarket
95

·
--
🚀 ETH (Ethereum) Market Analysis – Support & Resistance
Ethereum (ETH) is showing interesting market movements. Traders should closely monitor these important support and resistance zones.
📉 Support Zones:
- S1: $3,150
- S2: $3,050
- S3: $2,950
📈 Resistance Zones:
- R1: $3,350
- R2: $3,450
- R3: $3,550
🔍 Market Outlook:
A strong breakout above resistance could indicate bullish momentum, while a breakdown below support may increase selling pressure.
⚠️ Always use proper risk management and DYOR before trading.
#ETH #Ethereum #CryptoAnalysis #BinanceSquare #Trading
🚀 ETH (Ethereum) Market Analysis – Support & Resistance
Ethereum (ETH) is showing interesting market movements. Traders should closely monitor these important support and resistance zones.
📉 Support Zones:
- S1: $3,150
- S2: $3,050
- S3: $2,950
📈 Resistance Zones:
- R1: $3,350
- R2: $3,450
- R3: $3,550
🔍 Market Outlook:
A strong breakout above resistance could indicate bullish momentum, while a breakdown below support may increase selling pressure.
⚠️ Always use proper risk management and DYOR before trading.
#ETH #Ethereum #CryptoAnalysis #BinanceSquare #Trading
Ethereum (ETH) is showing interesting market movements. Traders should closely monitor these important support and resistance zones.
📉 Support Zones:
- S1: $3,150
- S2: $3,050
- S3: $2,950
📈 Resistance Zones:
- R1: $3,350
- R2: $3,450
- R3: $3,550
🔍 Market Outlook:
A strong breakout above resistance could indicate bullish momentum, while a breakdown below support may increase selling pressure.
⚠️ Always use proper risk management and DYOR before trading.
#ETH #Ethereum #CryptoAnalysis #BinanceSquare #Trading
121

·
--
$ETH
{spot}(ETHUSDT)
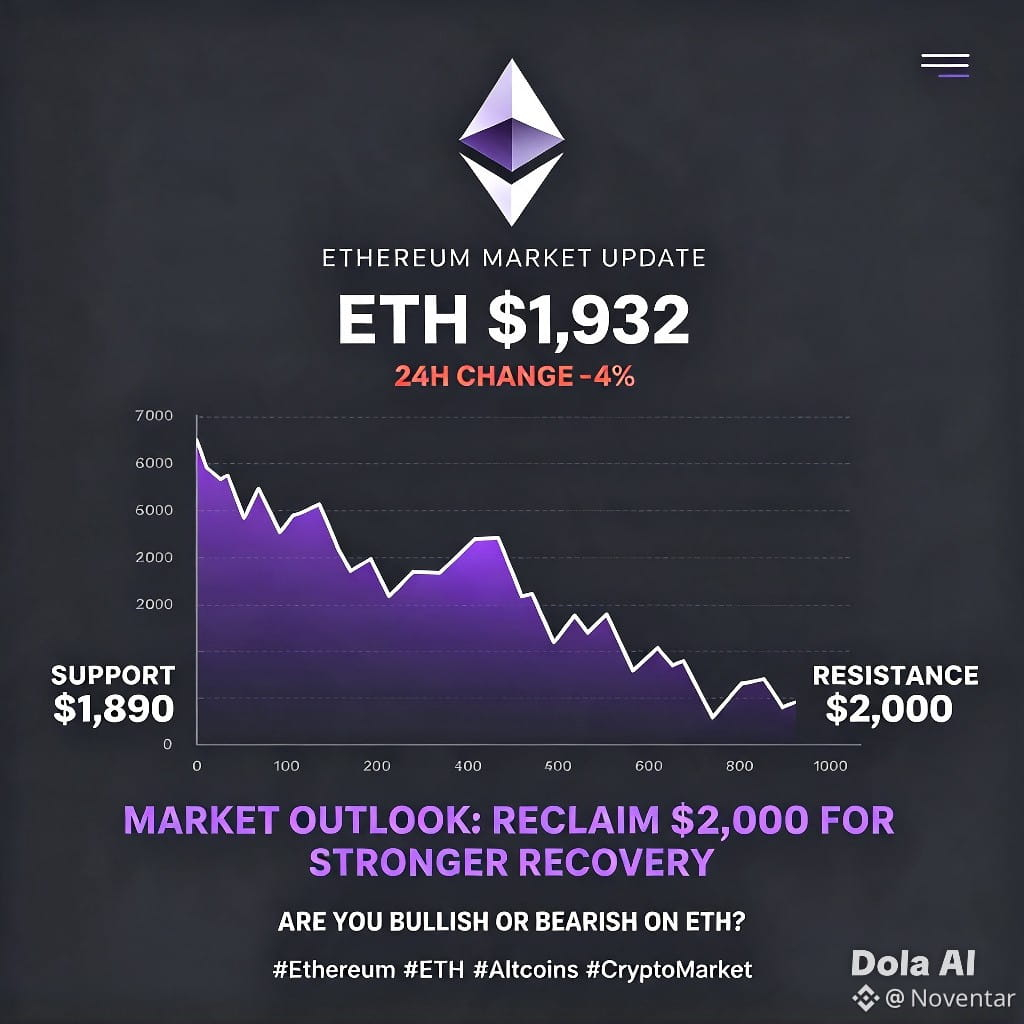
🔥 ETHEREUM MARKET UPDATE
Ethereum is under pressure as the crypto market continues to decline.
📉 ETH is trading around $1,932, down approximately 4% in 24 hours.
🔍 Key Levels:
- Support: $1,890
- Resistance: $2,000
📊 Market Outlook:
ETH needs to reclaim the $2,000 level to show stronger recovery momentum.
Are you bullish or bearish on ETH?
#Ethereum #ETH #altcoins #CryptoMarket
$ETH
🔥 ETHEREUM MARKET UPDATE
Ethereum is under pressure as the crypto market continues to decline.
📉 ETH is trading around $1,932, down approximately 4% in 24 hours.
🔍 Key Levels:
- Support: $1,890
- Resistance: $2,000
📊 Market Outlook:
ETH needs to reclaim the $2,000 level to show stronger recovery momentum.
Are you bullish or bearish on ETH?
#Ethereum #ETH #altcoins #CryptoMarket
🔥 ETHEREUM MARKET UPDATE
Ethereum is under pressure as the crypto market continues to decline.
📉 ETH is trading around $1,932, down approximately 4% in 24 hours.
🔍 Key Levels:
- Support: $1,890
- Resistance: $2,000
📊 Market Outlook:
ETH needs to reclaim the $2,000 level to show stronger recovery momentum.
Are you bullish or bearish on ETH?
#Ethereum #ETH #altcoins #CryptoMarket
62

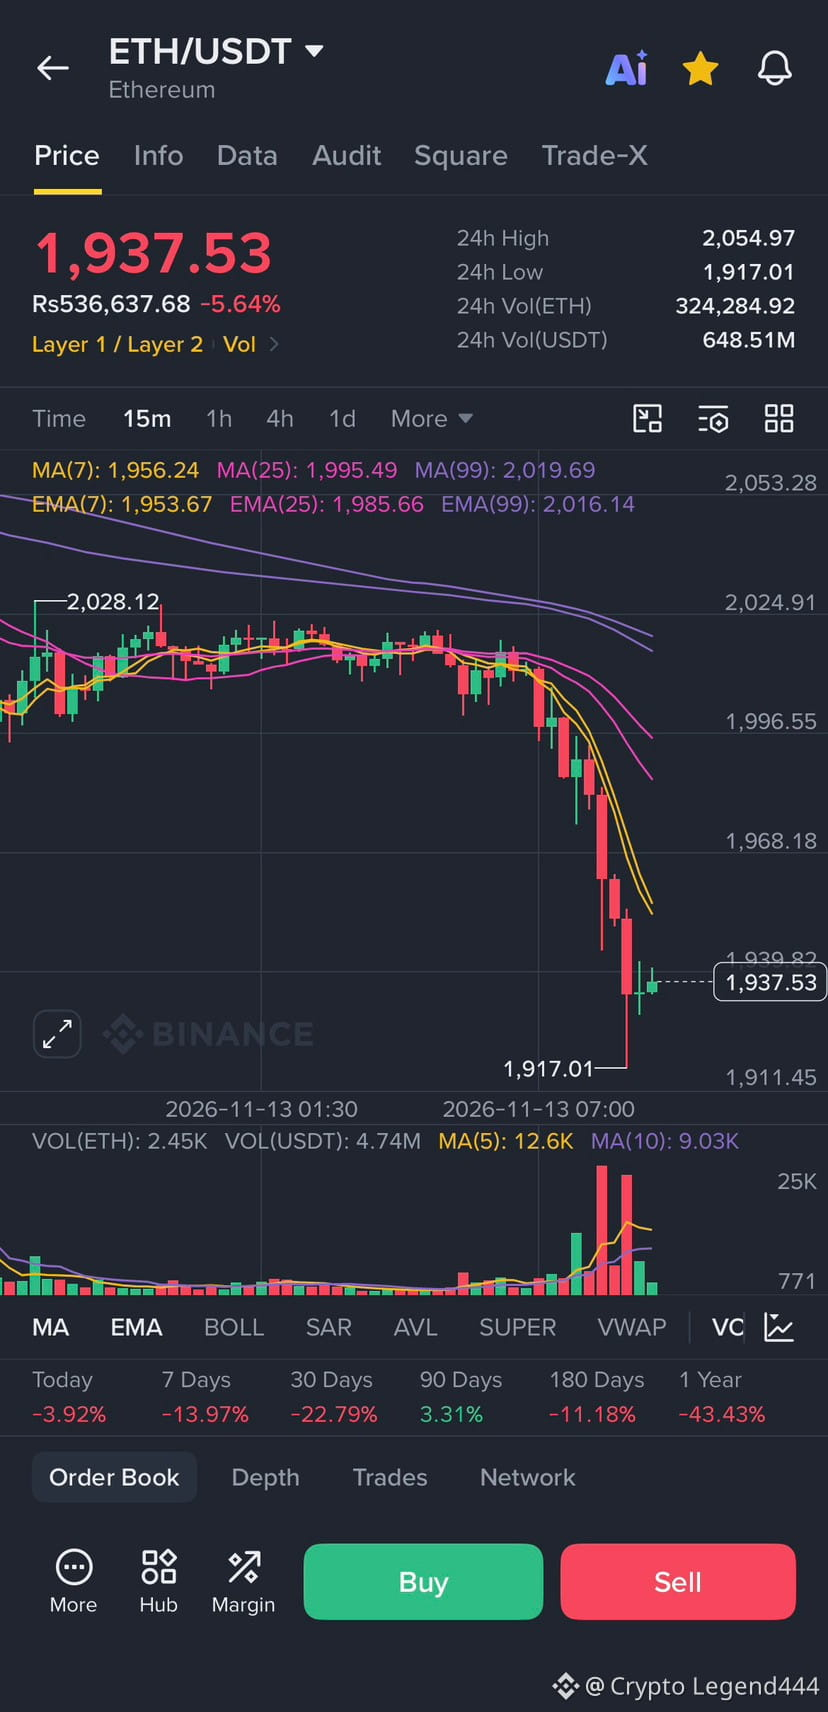
🚨 $ETH IS UNDER HEAVY SELLING PRESSURE!
Ethereum is struggling near $1,935 after losing key support.
🔻 Below $1,917, ETH could drop towards:
🎯 $1,900
🎯 $1,880
🟢 Bulls need to reclaim $1,960–$1,980 to target a recovery towards $2,000.
For now, bears have the advantage.
What’s next for $ETH — $1,900 or a bounce to $2,000? 👀
#ETH #Ethereum #crypto #Trading
{future}(ETHUSDT)
🚨 $ETH IS UNDER HEAVY SELLING PRESSURE!
Ethereum is struggling near $1,935 after losing key support.
🔻 Below $1,917, ETH could drop towards:
🎯 $1,900
🎯 $1,880
🟢 Bulls need to reclaim $1,960–$1,980 to target a recovery towards $2,000.
For now, bears have the advantage.
What’s next for $ETH — $1,900 or a bounce to $2,000? 👀
#ETH #Ethereum #crypto #Trading
Ethereum is struggling near $1,935 after losing key support.
🔻 Below $1,917, ETH could drop towards:
🎯 $1,900
🎯 $1,880
🟢 Bulls need to reclaim $1,960–$1,980 to target a recovery towards $2,000.
For now, bears have the advantage.
What’s next for $ETH — $1,900 or a bounce to $2,000? 👀
#ETH #Ethereum #crypto #Trading
1
800

·
--
BTC-Ninja:
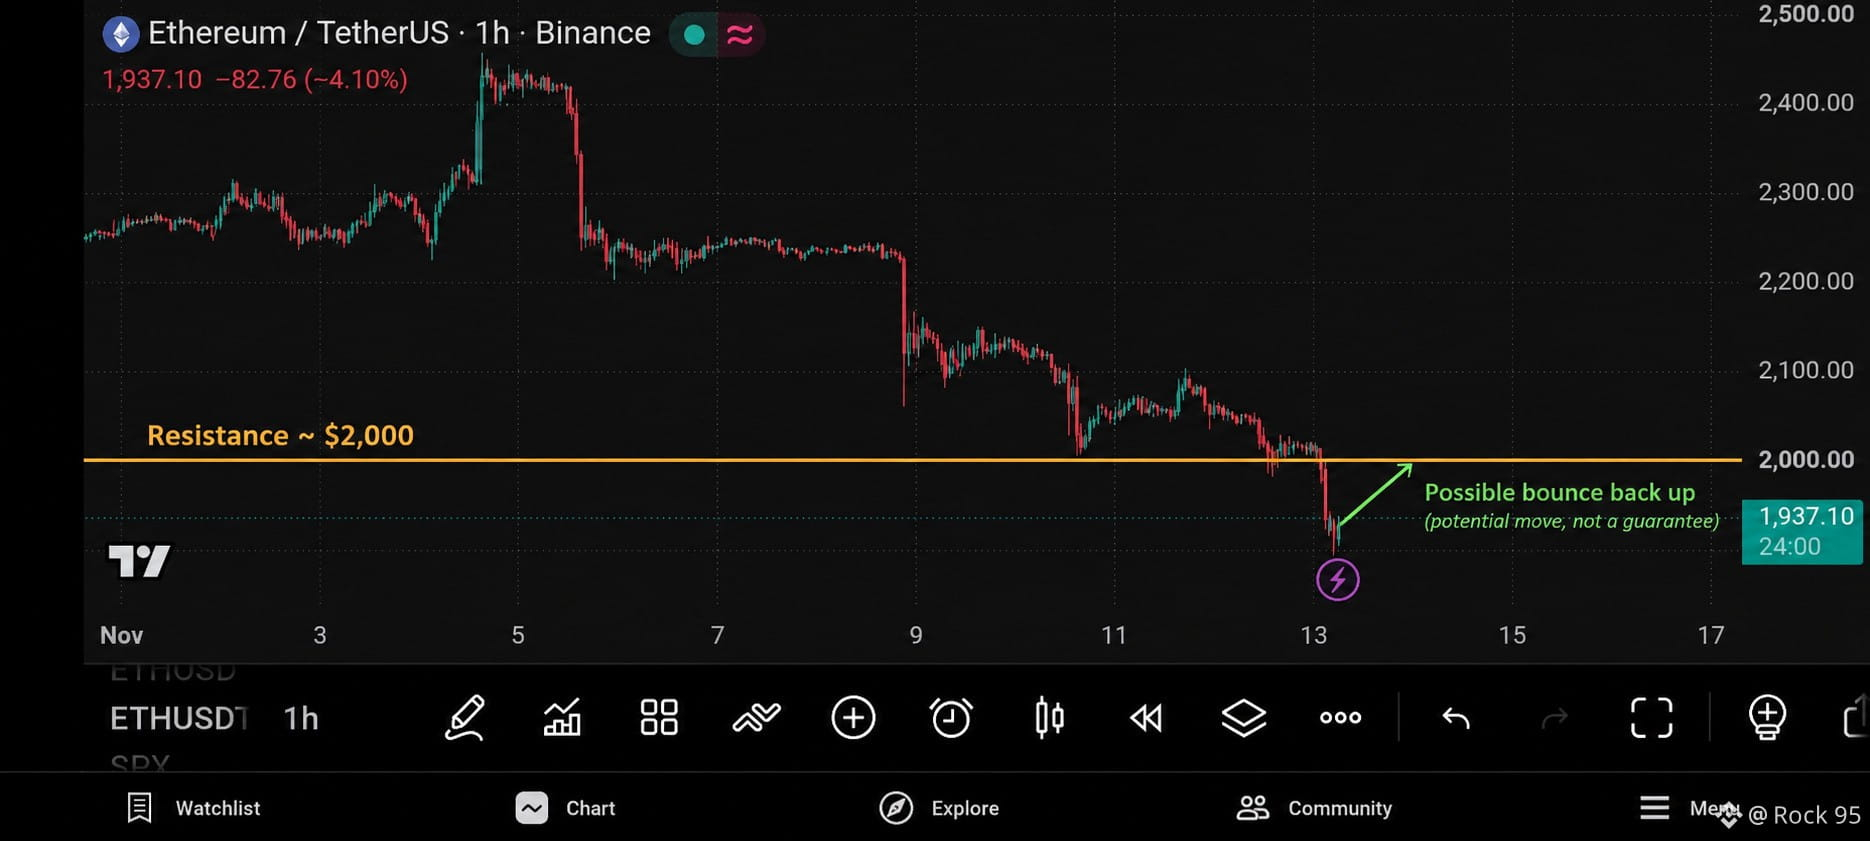
$ETH is waiting for break even
17
16
4.5k

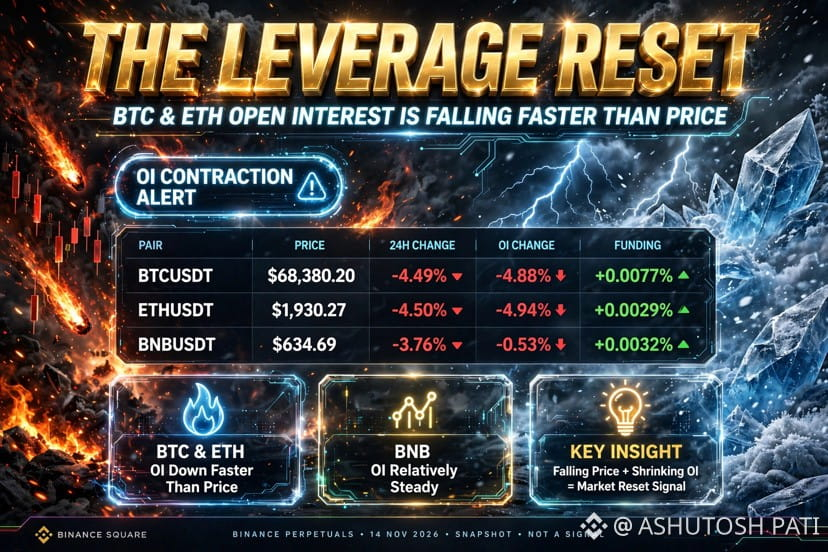
THE LEVERAGE RESET 🔥
BTC & ETH Open Interest is falling FASTER than price. This is not a normal dip, this is deleveraging.
DATA - 14 NOV 2026 | Binance Perpetuals:
BTC - $68,380.20 | -4.49% | OI -4.88% | Funding +0.0077%
ETH - $1,930.27 | -4.50% | OI -4.94% | Funding +0.0029%
BNB - $634.69 | -3.76% | OI -0.53% | Funding +0.0032%
WHAT DOES THE DATA TELL US?
BTC & ETH - OI down faster than price = traders are closing positions, leverage is getting flushed out.
BNB - OI relatively steady = holding stronger than BTC / ETH.
Funding still positive = longs still paying, but OI is shrinking.
MY ANALYST VIEW
Falling Price + Shrinking OI = Market Reset Signal?
Falling OI = less open exposure, not proof of who closed. It can be longs giving up OR shorts taking profit.
Extreme volatility creates opportunities, but also creates traps. I would watch volume, Open Interest, funding rates and price structure before considering any Futures setup.
No FOMO. No blind entries. Risk management first.
Which side are you on?
Is this a healthy leverage reset before bounce, or start of more downside? Drop your view below.
#Bitcoin #Ethereum #BNB #Crypto #BinanceSquare
THE LEVERAGE RESET 🔥
BTC & ETH Open Interest is falling FASTER than price. This is not a normal dip, this is deleveraging.
DATA - 14 NOV 2026 | Binance Perpetuals:
BTC - $68,380.20 | -4.49% | OI -4.88% | Funding +0.0077%
ETH - $1,930.27 | -4.50% | OI -4.94% | Funding +0.0029%
BNB - $634.69 | -3.76% | OI -0.53% | Funding +0.0032%
WHAT DOES THE DATA TELL US?
BTC & ETH - OI down faster than price = traders are closing positions, leverage is getting flushed out.
BNB - OI relatively steady = holding stronger than BTC / ETH.
Funding still positive = longs still paying, but OI is shrinking.
MY ANALYST VIEW
Falling Price + Shrinking OI = Market Reset Signal?
Falling OI = less open exposure, not proof of who closed. It can be longs giving up OR shorts taking profit.
Extreme volatility creates opportunities, but also creates traps. I would watch volume, Open Interest, funding rates and price structure before considering any Futures setup.
No FOMO. No blind entries. Risk management first.
Which side are you on?
Is this a healthy leverage reset before bounce, or start of more downside? Drop your view below.
#Bitcoin #Ethereum #BNB #Crypto #BinanceSquare
BTC & ETH Open Interest is falling FASTER than price. This is not a normal dip, this is deleveraging.
DATA - 14 NOV 2026 | Binance Perpetuals:
BTC - $68,380.20 | -4.49% | OI -4.88% | Funding +0.0077%
ETH - $1,930.27 | -4.50% | OI -4.94% | Funding +0.0029%
BNB - $634.69 | -3.76% | OI -0.53% | Funding +0.0032%
WHAT DOES THE DATA TELL US?
BTC & ETH - OI down faster than price = traders are closing positions, leverage is getting flushed out.
BNB - OI relatively steady = holding stronger than BTC / ETH.
Funding still positive = longs still paying, but OI is shrinking.
MY ANALYST VIEW
Falling Price + Shrinking OI = Market Reset Signal?
Falling OI = less open exposure, not proof of who closed. It can be longs giving up OR shorts taking profit.
Extreme volatility creates opportunities, but also creates traps. I would watch volume, Open Interest, funding rates and price structure before considering any Futures setup.
No FOMO. No blind entries. Risk management first.
Which side are you on?
Is this a healthy leverage reset before bounce, or start of more downside? Drop your view below.
#Bitcoin #Ethereum #BNB #Crypto #BinanceSquare
Priyadarshinipanda:
I think this is a healthy leverage reset before bounce. BNB holding stronger than BTC/ETH is a good sign. No FOMO, watching OI and funding closely.
1
1
355
Log in to explore more content
Join global crypto users on Binance Square
⚡️ Get latest and useful information about crypto.
💬 Trusted by the world’s largest crypto exchange.
👍 Discover real insights from verified creators.
Email / Phone number
Trending Topics
1
#WhoWillSucceedJensenHuangatNvidia?
34,469 views
491 Discussing
2
#WhatWillDriveCryptoandStocks’NextRebound?
344,061 views
2,459 Discussing
3
#USPPIMissMayEaseBTCPressure
156,527 views
1,719 Discussing
4
#TONStrategyReports$23.97MQ3NetLoss
1,173 views
24 Discussing
5
#PolkadotCommunityApprovesNewStrategyWith97%Vote
6,746 views
121 Discussing
6
#dYdXPlansV9.9UpgradeToShiftUSDCToInjective
3,193 views
103 Discussing
7
#TradFiForBeginners
673,345 views
4,378 Discussing
8
#MANTRAPausesUnstakingFor7DaysAfterKeplrSecurityIncident
2,861 views
43 Discussing
9
#BitcoinCoreDisclosesTorTrafficVulnerability
69,116 views
945 Discussing
10
#BitcoinBreaksBelow200WeekMovingAverage
157,311 views
975 Discussing