
#beamx
beamx
1.4M views
5,417 Discussing
Hot
Latest

·
--
Bullish
$BEAMX is showing strength from support, with buyers gradually taking control and momentum building for a potential continuation move.
Entry: 0.00410–0.00418
TP1: 0.00435
TP2: 0.0045
TP3: 0.00480
SL: 0.00395
Buy and Trade $HOT
#BEAMX $BMT
{future}(BMTUSDT)
{future}(HOTUSDT)
{future}(BEAMXUSDT)
$BEAMX is showing strength from support, with buyers gradually taking control and momentum building for a potential continuation move.
Entry: 0.00410–0.00418
TP1: 0.00435
TP2: 0.0045
TP3: 0.00480
SL: 0.00395
Buy and Trade $HOT
#BEAMX $BMT
Entry: 0.00410–0.00418
TP1: 0.00435
TP2: 0.0045
TP3: 0.00480
SL: 0.00395
Buy and Trade $HOT
#BEAMX $BMT
2
67


·
--
Bullish
$BEAMX Buyers Are Regaining Momentum Bullish Move Developing
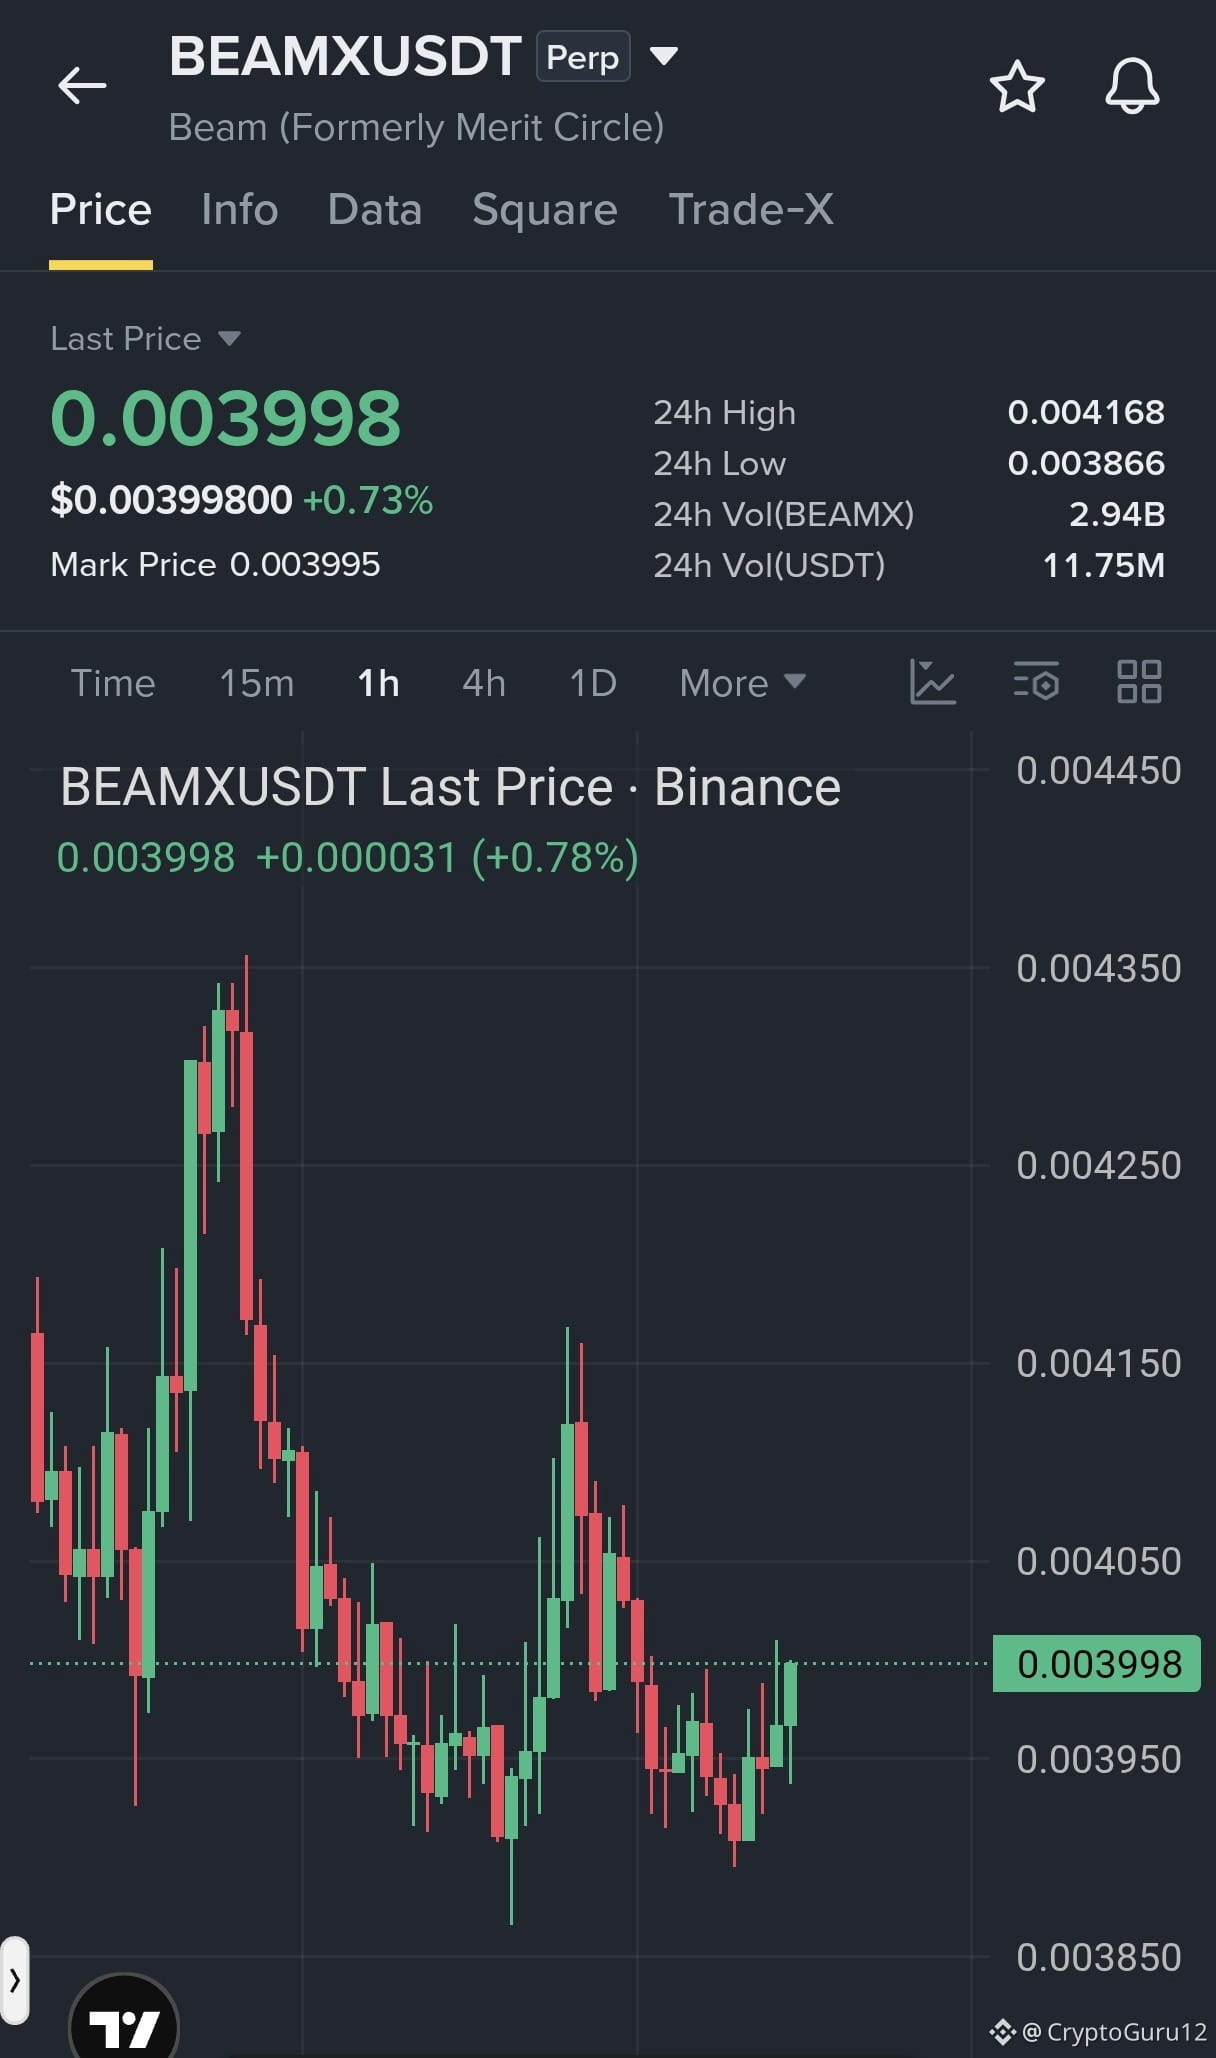
#BEAMX is bouncing from the $0.00390 support zone, with fresh buying pressure pushing price toward $0.00400. A breakout above $0.00405 could open the way for further upside.
Long Setup
Entry: $0.00398–$0.00402
TP1: $0.00408
TP2: $0.00415
TP3: $0.00425
SL: $0.00388
Watch for a confirmed breakout above $0.00405 before entry.
Buy and Trade
{future}(BEAMXUSDT)
$TRUMP
{future}(TRUMPUSDT)
$SNDK
{future}(SNDKUSDT)
$BEAMX Buyers Are Regaining Momentum Bullish Move Developing
#BEAMX is bouncing from the $0.00390 support zone, with fresh buying pressure pushing price toward $0.00400. A breakout above $0.00405 could open the way for further upside.
Long Setup
Entry: $0.00398–$0.00402
TP1: $0.00408
TP2: $0.00415
TP3: $0.00425
SL: $0.00388
Watch for a confirmed breakout above $0.00405 before entry.
Buy and Trade
$TRUMP
$SNDK
#BEAMX is bouncing from the $0.00390 support zone, with fresh buying pressure pushing price toward $0.00400. A breakout above $0.00405 could open the way for further upside.
Long Setup
Entry: $0.00398–$0.00402
TP1: $0.00408
TP2: $0.00415
TP3: $0.00425
SL: $0.00388
Watch for a confirmed breakout above $0.00405 before entry.
Buy and Trade
$TRUMP
$SNDK
1
387


🦈 $BEAMX DEFENDING MAJOR ACCUMULATION AS SMART MONEY STEPS IN FOR RECOVERY! 📈
Entry: 0.00410–0.00418 ⚡
Target: 0.00465 🚀
Stop Loss: 0.00388 ⚠️
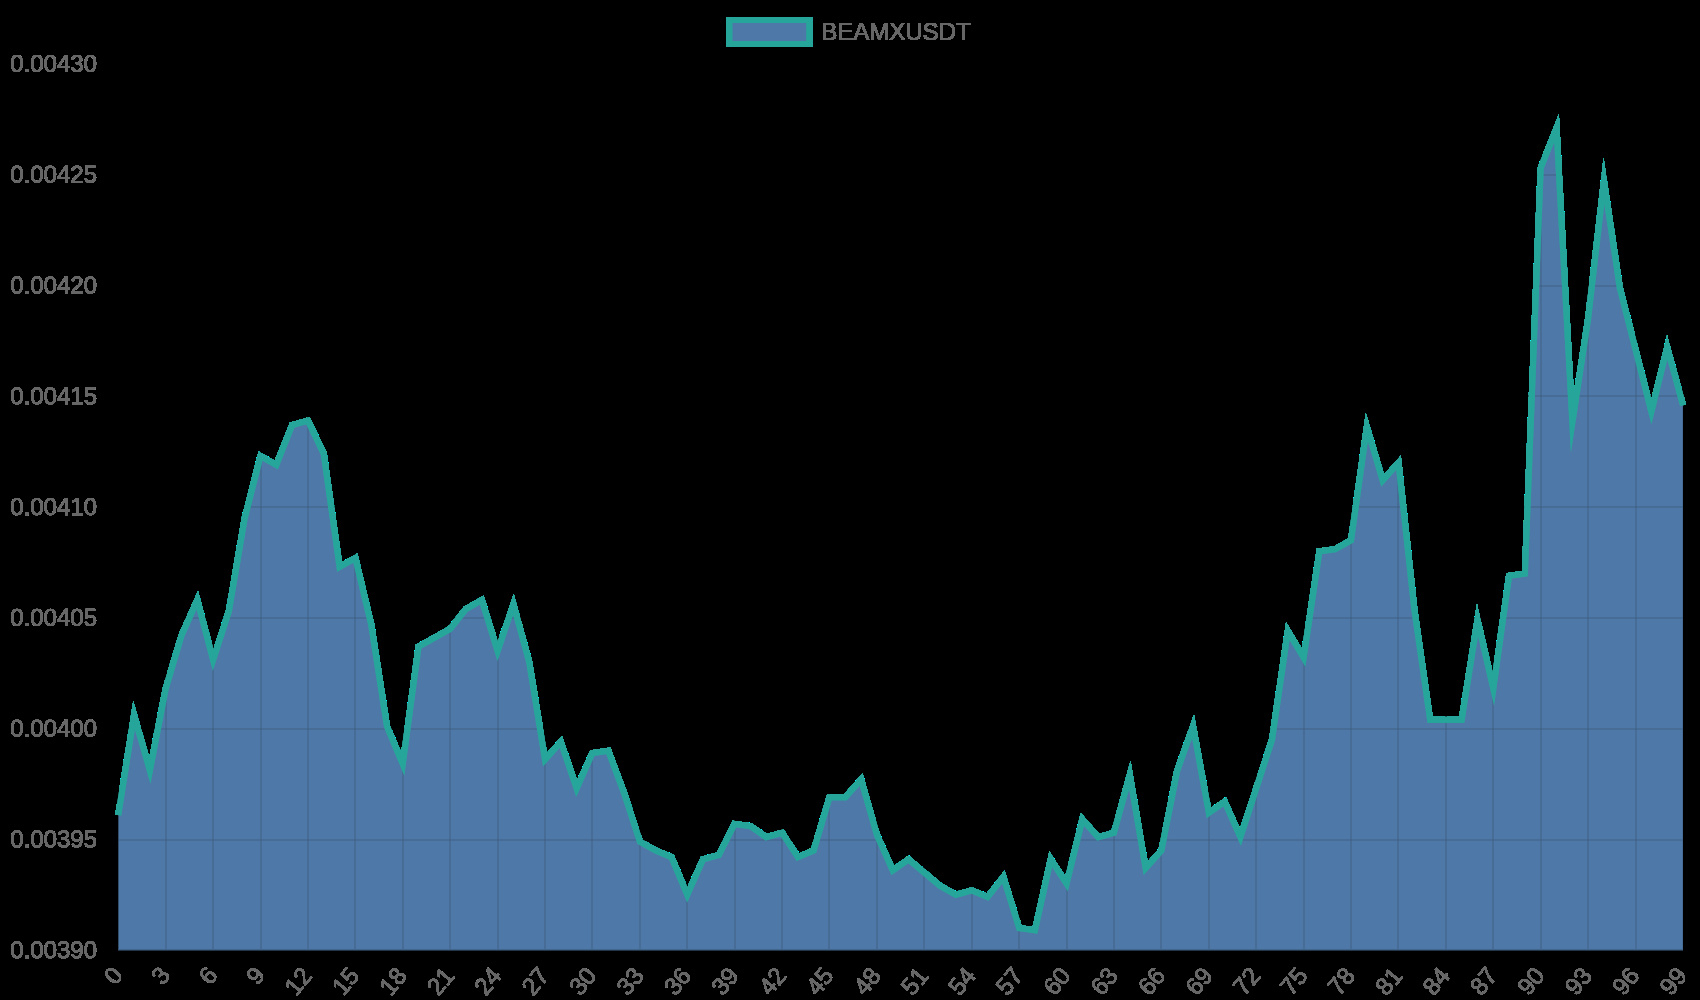
Institutional order flow is currently absorbing sell pressure right above the crucial 0.00400 structural floor. 🌊 Buyers are methodically building a base here, setting up a clean structural pivot for higher timeframe expansion. 📊
As long as the 0.00390 invalidation level holds firm, a sustained push past 0.00420 unlocks rapid liquidity clearing toward our upper targets. 💡 Are you positioned for this momentum shift or waiting for a confirmed range breakout? 💬
⚠️ Not financial advice. Always manage your risk. 🛡️
🏷️ #BEAMX #LongSetup #SmartMoney #Crypto
🔥 💎
🦈 $BEAMX DEFENDING MAJOR ACCUMULATION AS SMART MONEY STEPS IN FOR RECOVERY! 📈
Entry: 0.00410–0.00418 ⚡
Target: 0.00465 🚀
Stop Loss: 0.00388 ⚠️
Institutional order flow is currently absorbing sell pressure right above the crucial 0.00400 structural floor. 🌊 Buyers are methodically building a base here, setting up a clean structural pivot for higher timeframe expansion. 📊
As long as the 0.00390 invalidation level holds firm, a sustained push past 0.00420 unlocks rapid liquidity clearing toward our upper targets. 💡 Are you positioned for this momentum shift or waiting for a confirmed range breakout? 💬
⚠️ Not financial advice. Always manage your risk. 🛡️
🏷️ #BEAMX #LongSetup #SmartMoney #Crypto
🔥 💎
Entry: 0.00410–0.00418 ⚡
Target: 0.00465 🚀
Stop Loss: 0.00388 ⚠️
Institutional order flow is currently absorbing sell pressure right above the crucial 0.00400 structural floor. 🌊 Buyers are methodically building a base here, setting up a clean structural pivot for higher timeframe expansion. 📊
As long as the 0.00390 invalidation level holds firm, a sustained push past 0.00420 unlocks rapid liquidity clearing toward our upper targets. 💡 Are you positioned for this momentum shift or waiting for a confirmed range breakout? 💬
⚠️ Not financial advice. Always manage your risk. 🛡️
🏷️ #BEAMX #LongSetup #SmartMoney #Crypto
🔥 💎
26

·
--
$BEAMX +6.71% | $HFT +6.28% | $HMSTR +6.05%
#BEAMX nudged to $0.00421500, up +6.71% on $2.6 M of volume. The climb suggests renewed interest after recent liquidity updates.
#HFT traded at $0.00711000, gaining +6.28% with $2.3 M moved. As a multichain DEX, its rise may reflect broader cross‑chain activity.
#HMSTR is now $0.00013670, up +6.05% on a solid $5.1 M volume. The token’s surge is notable given its low‑price positioning.
👀 Watch whether the concurrent volume spikes hold, which could hint at a short‑term rally across these niche assets.
#Write2Earn #Binance
$BEAMX +6.71% | $HFT +6.28% | $HMSTR +6.05%
#BEAMX nudged to $0.00421500, up +6.71% on $2.6 M of volume. The climb suggests renewed interest after recent liquidity updates.
#HFT traded at $0.00711000, gaining +6.28% with $2.3 M moved. As a multichain DEX, its rise may reflect broader cross‑chain activity.
#HMSTR is now $0.00013670, up +6.05% on a solid $5.1 M volume. The token’s surge is notable given its low‑price positioning.
👀 Watch whether the concurrent volume spikes hold, which could hint at a short‑term rally across these niche assets.
#Write2Earn #Binance
#BEAMX nudged to $0.00421500, up +6.71% on $2.6 M of volume. The climb suggests renewed interest after recent liquidity updates.
#HFT traded at $0.00711000, gaining +6.28% with $2.3 M moved. As a multichain DEX, its rise may reflect broader cross‑chain activity.
#HMSTR is now $0.00013670, up +6.05% on a solid $5.1 M volume. The token’s surge is notable given its low‑price positioning.
👀 Watch whether the concurrent volume spikes hold, which could hint at a short‑term rally across these niche assets.
#Write2Earn #Binance
12

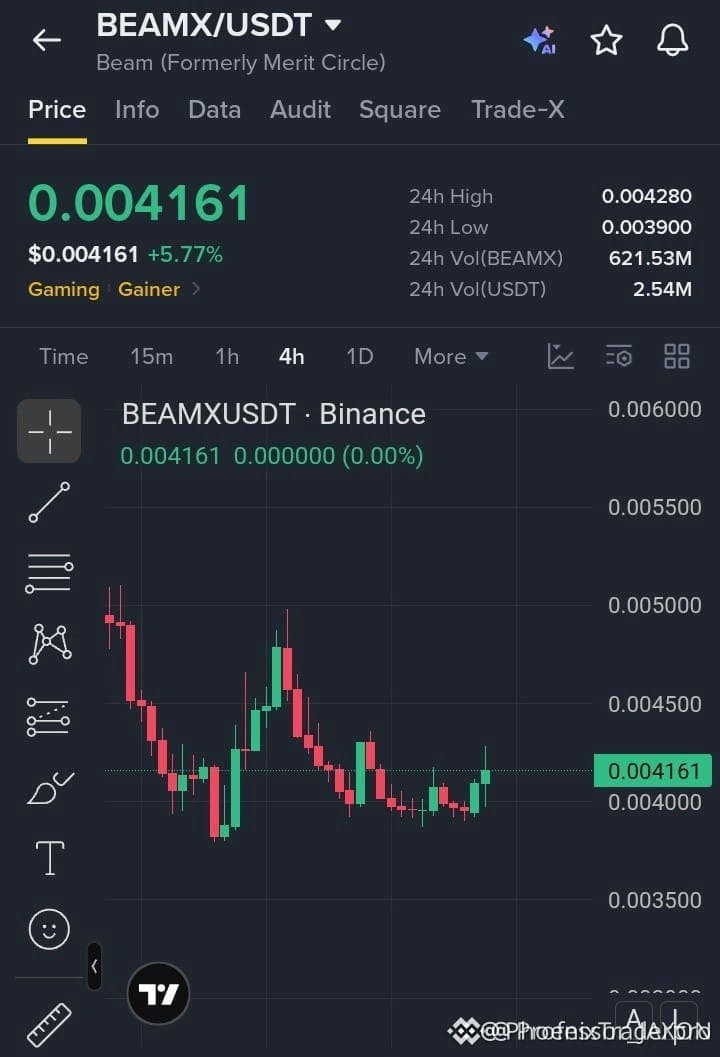
⚡ $BEAMX BUYERS IGNITE A CRUCIAL DEFENSE AT THE FOUR-ZERO SUPPORT! 🎯
Entry: 0.00410–0.00418 ⚡
Target: 0.00465 🚀
Stop Loss: 0.00388 ⚠️
The order books are shifting as aggressive bids absorb the lingering supply around the psychological support zone. 📊 Momentum is coiling tight on the lower timeframes, waiting for a clean break past resistance to trigger expansion. ⚡
Patience is key here as we let the structural reclaim validate the next leg upward while keeping a strict eye on downside risk. 💡 Are you catching this dip early or waiting for confirmation above the threshold? 👇
⚠️ Not financial advice. Always manage your risk. 🛡️
🏷️ #BEAMX #LongSetup #Crypto #Breakout
🔥 💎
⚡ $BEAMX BUYERS IGNITE A CRUCIAL DEFENSE AT THE FOUR-ZERO SUPPORT! 🎯
Entry: 0.00410–0.00418 ⚡
Target: 0.00465 🚀
Stop Loss: 0.00388 ⚠️
The order books are shifting as aggressive bids absorb the lingering supply around the psychological support zone. 📊 Momentum is coiling tight on the lower timeframes, waiting for a clean break past resistance to trigger expansion. ⚡
Patience is key here as we let the structural reclaim validate the next leg upward while keeping a strict eye on downside risk. 💡 Are you catching this dip early or waiting for confirmation above the threshold? 👇
⚠️ Not financial advice. Always manage your risk. 🛡️
🏷️ #BEAMX #LongSetup #Crypto #Breakout
🔥 💎
Entry: 0.00410–0.00418 ⚡
Target: 0.00465 🚀
Stop Loss: 0.00388 ⚠️
The order books are shifting as aggressive bids absorb the lingering supply around the psychological support zone. 📊 Momentum is coiling tight on the lower timeframes, waiting for a clean break past resistance to trigger expansion. ⚡
Patience is key here as we let the structural reclaim validate the next leg upward while keeping a strict eye on downside risk. 💡 Are you catching this dip early or waiting for confirmation above the threshold? 👇
⚠️ Not financial advice. Always manage your risk. 🛡️
🏷️ #BEAMX #LongSetup #Crypto #Breakout
🔥 💎
15

·
--
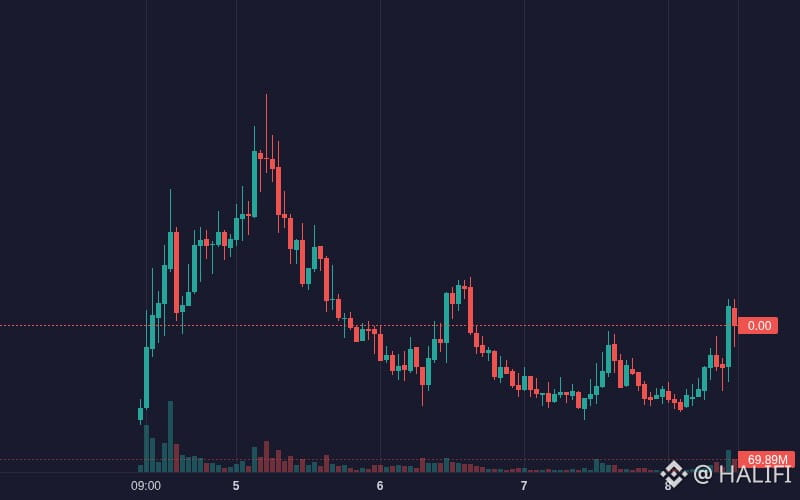
$BEAMX BEAMX is showing bullish movement: 6.18% (Crypto).
Volume: 2.57M | Last: $0.004190
Key signals: strong momentum, high volatility.
Bias Daily: BULLISH 🟢 | Weekly: BULLISH 🟢
BEAMX gained 7.8% over the past 24 hours, driven by a surge in trading volume and bullish MACD expansion.
**Volume-driven breakout (High)**: Hourly trading volume spiked to $1.68M → pushed price above upper Bollinger Band ($0.00416) to $0.00426
- **Bullish momentum shift (High)**: MACD histogram expanded into positive territory (`+0.00002899`) as short-term EMA 7 crossed above EMA 25
- **Selective whale absorption (Medium)**: Intermittent large order net inflows cushioned pullbacks earlier at key $0.0039 support
#BEAMX #JobsReportRaisesHikeOdds #WillAnthropicListOnTime #CPITestsDecemberRateOutlook #Crypto
$BEAMX BEAMX is showing bullish movement: 6.18% (Crypto).
Volume: 2.57M | Last: $0.004190
Key signals: strong momentum, high volatility.
Bias Daily: BULLISH 🟢 | Weekly: BULLISH 🟢
BEAMX gained 7.8% over the past 24 hours, driven by a surge in trading volume and bullish MACD expansion.
**Volume-driven breakout (High)**: Hourly trading volume spiked to $1.68M → pushed price above upper Bollinger Band ($0.00416) to $0.00426
- **Bullish momentum shift (High)**: MACD histogram expanded into positive territory (`+0.00002899`) as short-term EMA 7 crossed above EMA 25
- **Selective whale absorption (Medium)**: Intermittent large order net inflows cushioned pullbacks earlier at key $0.0039 support
#BEAMX #JobsReportRaisesHikeOdds #WillAnthropicListOnTime #CPITestsDecemberRateOutlook #Crypto
Volume: 2.57M | Last: $0.004190
Key signals: strong momentum, high volatility.
Bias Daily: BULLISH 🟢 | Weekly: BULLISH 🟢
BEAMX gained 7.8% over the past 24 hours, driven by a surge in trading volume and bullish MACD expansion.
**Volume-driven breakout (High)**: Hourly trading volume spiked to $1.68M → pushed price above upper Bollinger Band ($0.00416) to $0.00426
- **Bullish momentum shift (High)**: MACD histogram expanded into positive territory (`+0.00002899`) as short-term EMA 7 crossed above EMA 25
- **Selective whale absorption (Medium)**: Intermittent large order net inflows cushioned pullbacks earlier at key $0.0039 support
#BEAMX #JobsReportRaisesHikeOdds #WillAnthropicListOnTime #CPITestsDecemberRateOutlook #Crypto
20

·
--
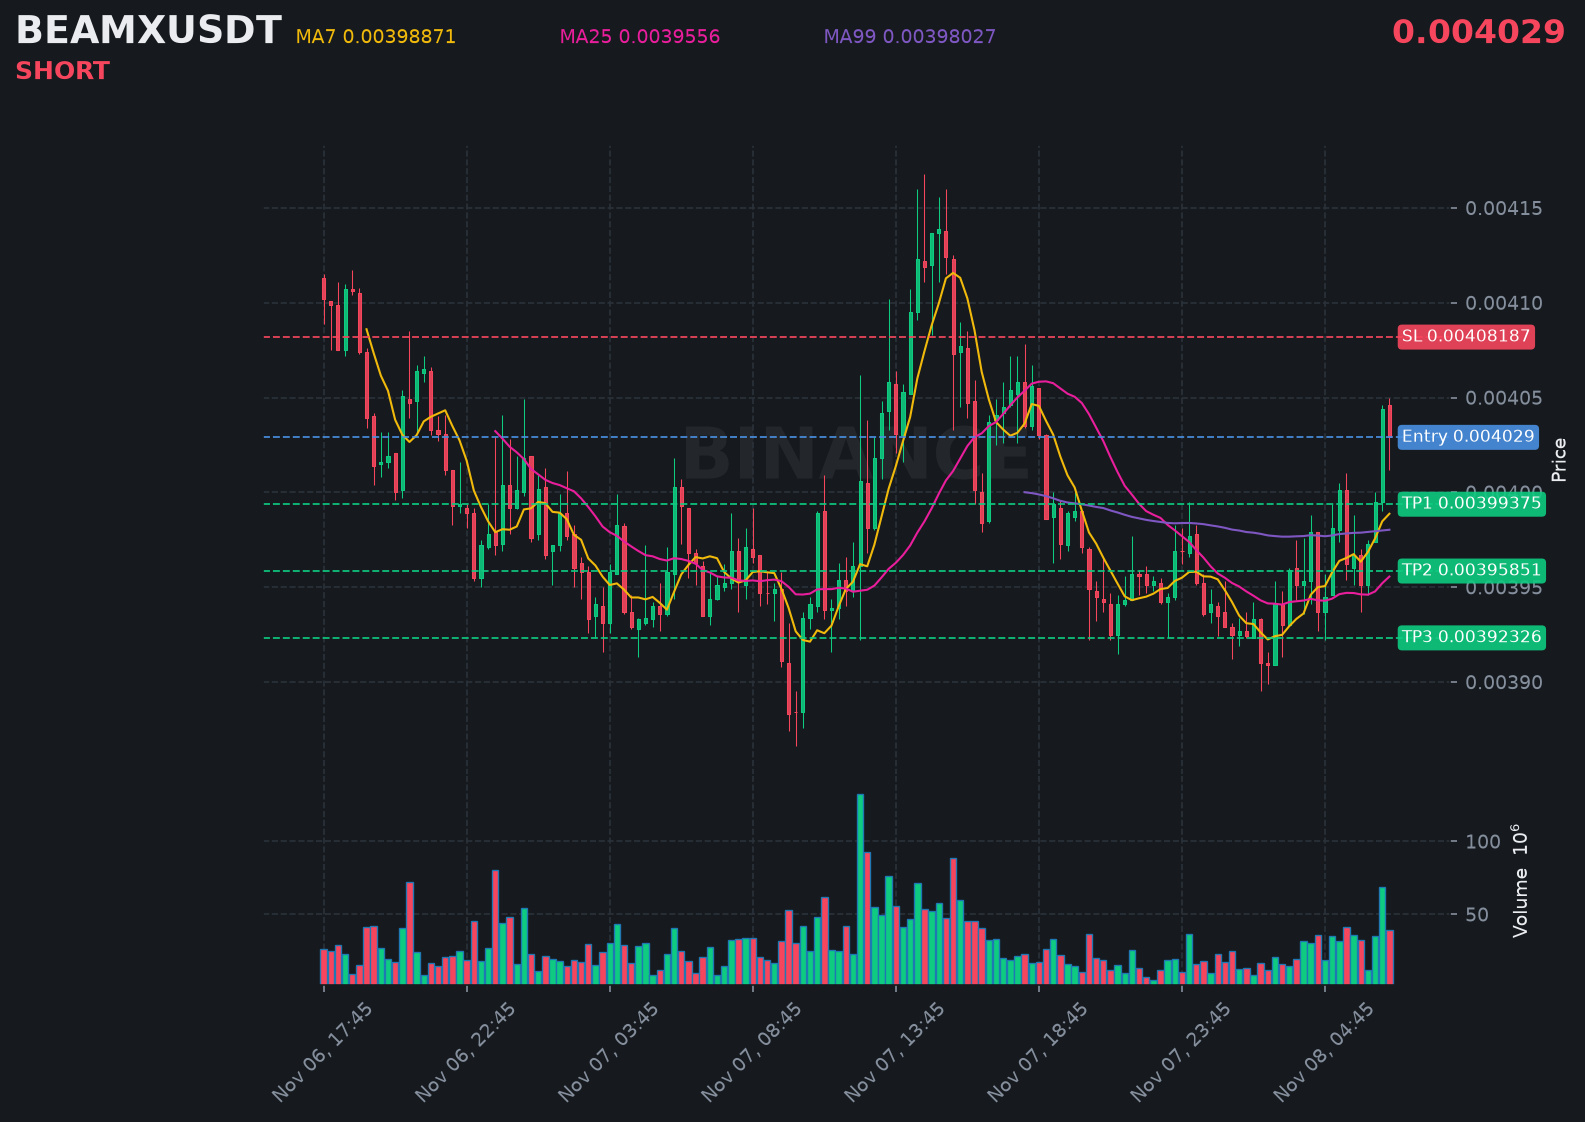
$BEAMX looks primed to keep falling, with bears firmly in control of the trend.
📍 @ 0.004029 | Volume: 0.16M USD
RSI 62 | EMA20: 0.00397436 USD
📈 Trade Plan:
📈 Entry: 0.00401843 – 0.00403957
🛑 Stop Loss: 0.00408187
🎯 TP1: 0.00399375
🎯 TP2: 0.00395851
🎯 TP3: 0.00392326
Waiting for confirmation, then riding the downtrend.
👉 $BEAMX 👈 Catch it
#BEAMX
$BEAMX looks primed to keep falling, with bears firmly in control of the trend.
📍 @ 0.004029 | Volume: 0.16M USD
RSI 62 | EMA20: 0.00397436 USD
📈 Trade Plan:
📈 Entry: 0.00401843 – 0.00403957
🛑 Stop Loss: 0.00408187
🎯 TP1: 0.00399375
🎯 TP2: 0.00395851
🎯 TP3: 0.00392326
Waiting for confirmation, then riding the downtrend.
👉 $BEAMX 👈 Catch it
#BEAMX
📍 @ 0.004029 | Volume: 0.16M USD
RSI 62 | EMA20: 0.00397436 USD
📈 Trade Plan:
📈 Entry: 0.00401843 – 0.00403957
🛑 Stop Loss: 0.00408187
🎯 TP1: 0.00399375
🎯 TP2: 0.00395851
🎯 TP3: 0.00392326
Waiting for confirmation, then riding the downtrend.
👉 $BEAMX 👈 Catch it
#BEAMX
104

$BEAMX: BEAMX: Spot Liquidity Depth
Liquidity depth defines how much trading activity spots handle before prices jump. Imagine a busy street. Many parked cars mean taxis arrive quickly. A quiet road requires a longer wait for a ride. Crypto spot markets work differently. Every order sits on the book. Thin books react sharply to large orders. Thick books absorb moves and produce smoother paths.
The spread connects the lowest sell order to the highest buy order. Spread width represents immediate liquidity. Wide spreads suggest few nearby orders. Tight spreads indicate many participants waiting at nearby levels. When turnover increases relative to baseline, depth changes. Higher relative volume suggests order flow is shifting. Traders can observe the change in fifteen minutes, hourly, four hours, twelve hours, twenty four hours, three days, or seven days.
Comparing spot turnover with token value separates utility from speculation. A token price represents the last transaction. The project value involves real usage, tech, and supply. Discrepancies matter when liquidity is thin. A small order can push price far if depth is missing. Price movements occasionally skip levels. These gaps happen when orders are not evenly distributed near the current price.
RSI or moving averages reveal momentum, not depth directly. Turnover and price changes tell a different story. Use the difference between the token price and the actual project value as a lens. If volume changes without a clear fundamental driver, question the interpretation. Look at the spread width relative to the daily change. Reassess using the average true range, ema twenty, and ema fifty context for stability. 📈
Probabilistic market research, not a recommendation or guaranteed return.
What would you check before trusting a smooth-looking price move?
#BEAMX #CryptoEducation #CryptoLearning
$BEAMX : BEAMX: Spot Liquidity Depth
Liquidity depth defines how much trading activity spots handle before prices jump. Imagine a busy street. Many parked cars mean taxis arrive quickly. A quiet road requires a longer wait for a ride. Crypto spot markets work differently. Every order sits on the book. Thin books react sharply to large orders. Thick books absorb moves and produce smoother paths.
The spread connects the lowest sell order to the highest buy order. Spread width represents immediate liquidity. Wide spreads suggest few nearby orders. Tight spreads indicate many participants waiting at nearby levels. When turnover increases relative to baseline, depth changes. Higher relative volume suggests order flow is shifting. Traders can observe the change in fifteen minutes, hourly, four hours, twelve hours, twenty four hours, three days, or seven days.
Comparing spot turnover with token value separates utility from speculation. A token price represents the last transaction. The project value involves real usage, tech, and supply. Discrepancies matter when liquidity is thin. A small order can push price far if depth is missing. Price movements occasionally skip levels. These gaps happen when orders are not evenly distributed near the current price.
RSI or moving averages reveal momentum, not depth directly. Turnover and price changes tell a different story. Use the difference between the token price and the actual project value as a lens. If volume changes without a clear fundamental driver, question the interpretation. Look at the spread width relative to the daily change. Reassess using the average true range, ema twenty, and ema fifty context for stability. 📈
Probabilistic market research, not a recommendation or guaranteed return.
What would you check before trusting a smooth-looking price move?
#BEAMX #CryptoEducation #CryptoLearning
Liquidity depth defines how much trading activity spots handle before prices jump. Imagine a busy street. Many parked cars mean taxis arrive quickly. A quiet road requires a longer wait for a ride. Crypto spot markets work differently. Every order sits on the book. Thin books react sharply to large orders. Thick books absorb moves and produce smoother paths.
The spread connects the lowest sell order to the highest buy order. Spread width represents immediate liquidity. Wide spreads suggest few nearby orders. Tight spreads indicate many participants waiting at nearby levels. When turnover increases relative to baseline, depth changes. Higher relative volume suggests order flow is shifting. Traders can observe the change in fifteen minutes, hourly, four hours, twelve hours, twenty four hours, three days, or seven days.
Comparing spot turnover with token value separates utility from speculation. A token price represents the last transaction. The project value involves real usage, tech, and supply. Discrepancies matter when liquidity is thin. A small order can push price far if depth is missing. Price movements occasionally skip levels. These gaps happen when orders are not evenly distributed near the current price.
RSI or moving averages reveal momentum, not depth directly. Turnover and price changes tell a different story. Use the difference between the token price and the actual project value as a lens. If volume changes without a clear fundamental driver, question the interpretation. Look at the spread width relative to the daily change. Reassess using the average true range, ema twenty, and ema fifty context for stability. 📈
Probabilistic market research, not a recommendation or guaranteed return.
What would you check before trusting a smooth-looking price move?
#BEAMX #CryptoEducation #CryptoLearning
58

·
--
Bullish
BEAMX shorts just got caught around $0.00409.
Upside liquidity is being cleared in this zone.
$BEAMX
{future}(BEAMXUSDT)
$LYN
{future}(LYNUSDT)
$AIN
{future}(AINUSDT)
🟢 LIQUIDITY ZONE HIT 🟢
Short liquidation spotted 🧨
$5.0235K cleared at $0.00409
Upside liquidity swept — watch reaction 👀
🎯 TP Targets:
TP1: ~$0.004110
TP2: ~$0.004131
TP3: ~$0.004151
#BEAMX
BEAMX shorts just got caught around $0.00409.
Upside liquidity is being cleared in this zone.
$BEAMX
$LYN
$AIN
🟢 LIQUIDITY ZONE HIT 🟢
Short liquidation spotted 🧨
$5.0235K cleared at $0.00409
Upside liquidity swept — watch reaction 👀
🎯 TP Targets:
TP1: ~$0.004110
TP2: ~$0.004131
TP3: ~$0.004151
#BEAMX
Upside liquidity is being cleared in this zone.
$BEAMX
$LYN
$AIN
🟢 LIQUIDITY ZONE HIT 🟢
Short liquidation spotted 🧨
$5.0235K cleared at $0.00409
Upside liquidity swept — watch reaction 👀
🎯 TP Targets:
TP1: ~$0.004110
TP2: ~$0.004131
TP3: ~$0.004151
#BEAMX
20

·
--
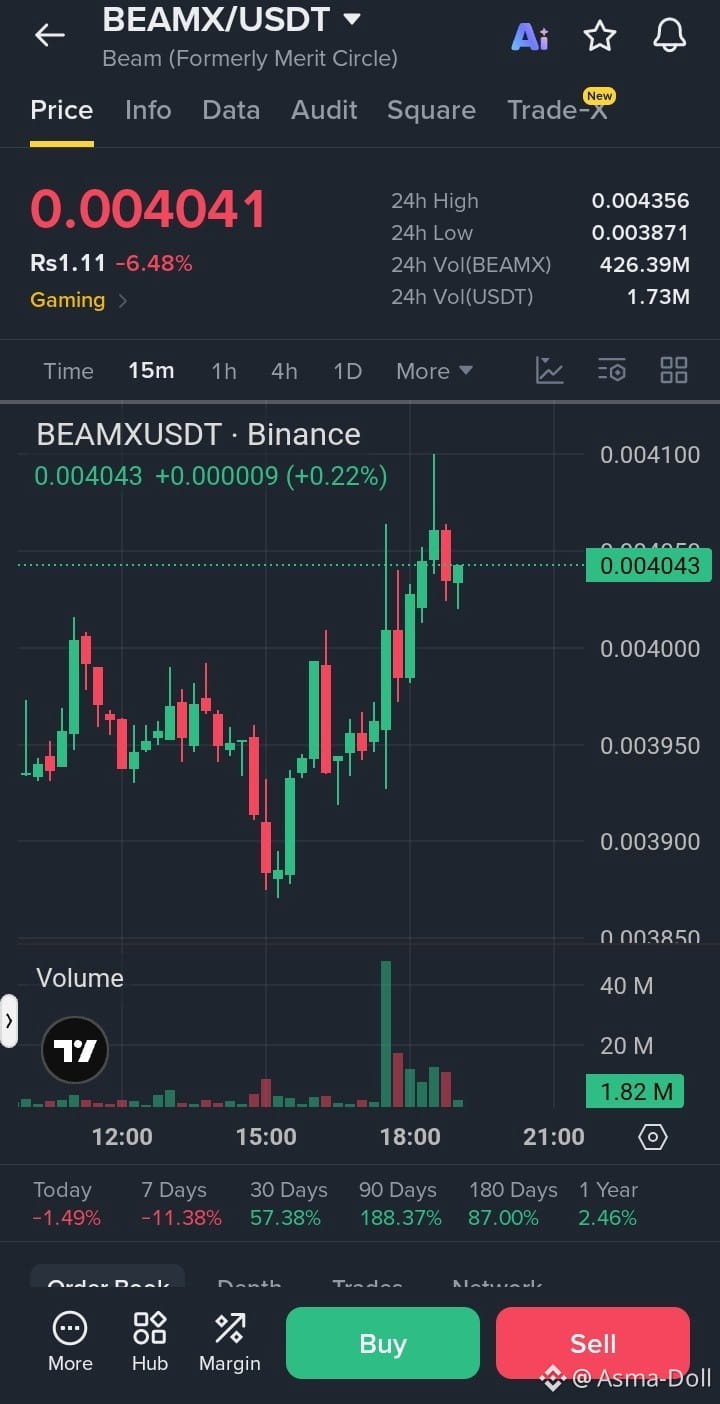
$BEAMX /USDT — SHORT SIGNAL 🔴
Trade Plan:
Entry: 0.004030 – 0.004080
Stop Loss (SL): 0.004180
Take Profit Targets:
TP1: 0.003950
TP2: 0.003900
TP3: 0.003820
Trade here $BEAMX
{future}(BEAMXUSDT)
Analysis:
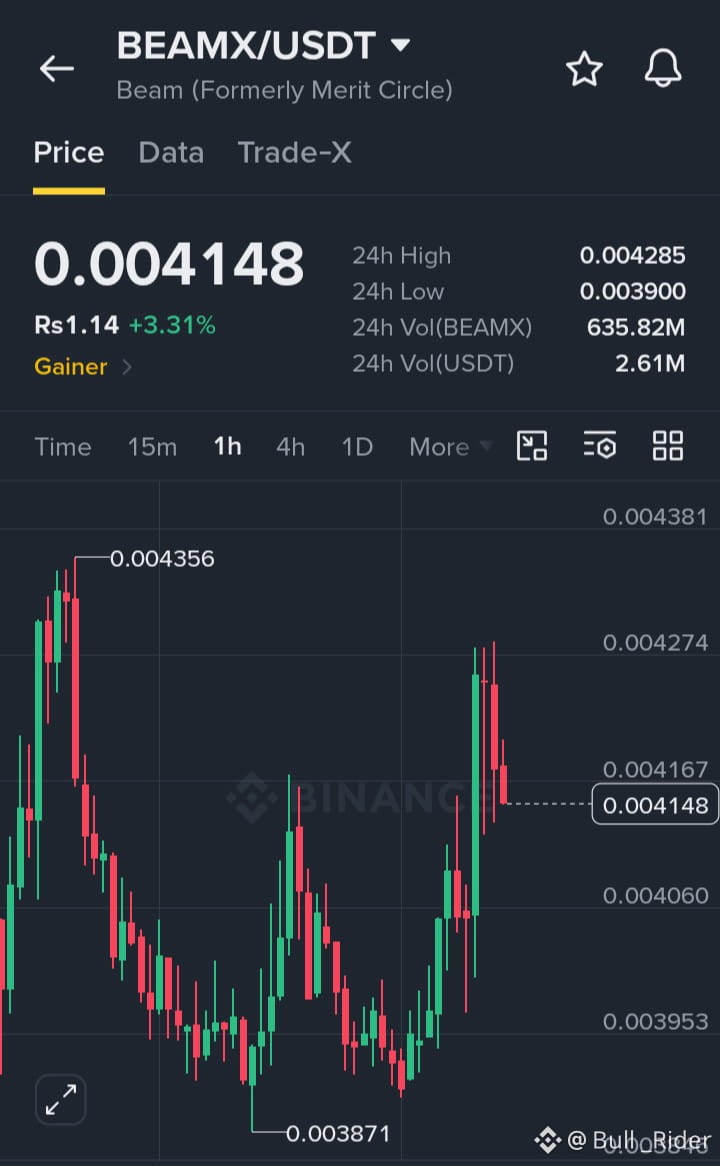
Strong bearish pressure with a 6.48% daily decline.
Price rejected near 0.004356.
Weak short-term recovery.
24h low at 0.003871 indicates nearby support.
Negative 7-day performance (-11.38%) supports bearish momentum.
Confirmation: A clean break below 0.003950 with strong selling volume could trigger further downside.
Risk-to-Reward: Approximately 1:1 to 1:2.5, depending on entry.
⚠️ Wait for confirmation. Avoid chasing the price near support.
#BEAMX #CryptoShort #BinanceTrading #AltcoinSignals #CryptoMarket
$BEAMX /USDT — SHORT SIGNAL 🔴
Trade Plan:
Entry: 0.004030 – 0.004080
Stop Loss (SL): 0.004180
Take Profit Targets:
TP1: 0.003950
TP2: 0.003900
TP3: 0.003820
Trade here $BEAMX
Analysis:
Strong bearish pressure with a 6.48% daily decline.
Price rejected near 0.004356.
Weak short-term recovery.
24h low at 0.003871 indicates nearby support.
Negative 7-day performance (-11.38%) supports bearish momentum.
Confirmation: A clean break below 0.003950 with strong selling volume could trigger further downside.
Risk-to-Reward: Approximately 1:1 to 1:2.5, depending on entry.
⚠️ Wait for confirmation. Avoid chasing the price near support.
#BEAMX #CryptoShort #BinanceTrading #AltcoinSignals #CryptoMarket
Trade Plan:
Entry: 0.004030 – 0.004080
Stop Loss (SL): 0.004180
Take Profit Targets:
TP1: 0.003950
TP2: 0.003900
TP3: 0.003820
Trade here $BEAMX
Analysis:
Strong bearish pressure with a 6.48% daily decline.
Price rejected near 0.004356.
Weak short-term recovery.
24h low at 0.003871 indicates nearby support.
Negative 7-day performance (-11.38%) supports bearish momentum.
Confirmation: A clean break below 0.003950 with strong selling volume could trigger further downside.
Risk-to-Reward: Approximately 1:1 to 1:2.5, depending on entry.
⚠️ Wait for confirmation. Avoid chasing the price near support.
#BEAMX #CryptoShort #BinanceTrading #AltcoinSignals #CryptoMarket
2
68

·
--
👀 Technical Watch: $BEAMX Holding Critical Demand Zone
Setup: 🟢 LONG $BEAMX (FUTURES)
🎯 Entry: 0.004083
🛑 Stop-Loss: 0.004012 (-1.74%)
✅ Take-Profit: 0.004287 (+5.00%)
⚖️ Risk/Reward: 1:2.9
🔍 Technical Reasoning:
The Asian session consolidation range has broken to the upside with strong momentum. Early session breakouts backed by volume typically offer excellent follow-through toward session highs.
💡 Key Confluences:
• Spot+Futures ✓
• 📊 ATR 1.8% — healthy volatility
• 🚀 Volume ×2.4 above average
🚫 Invalidation Rule: If a 1-hour candle closes below $0.004012 (-1.74%), this bullish thesis is invalidated. Exit trade without holding into drawdowns.
💡 Trade Management: Secure 50% profit at Take-Profit target ($0.004287 +5.00%) and move Stop-Loss to Breakeven to eliminate downside risk.
📊 Market Metrics:
• Funding: 0.0050% (Neutral) • Next: 2h 18m
• Open Interest (OI): $16.22M
• 24h Volume: $13.52M
• 24h Range: 0.003866 — 0.004356 (-5.1%)
📈 Strategy Track Record: WR 36% over 1392 trades
#BEAMX #CryptoTrading #TechnicalAnalysis #BinanceSquare
⚠️ Not financial advice. Always manage your risk.
👀 Technical Watch: $BEAMX Holding Critical Demand Zone
Setup: 🟢 LONG $BEAMX (FUTURES)
🎯 Entry: 0.004083
🛑 Stop-Loss: 0.004012 (-1.74%)
✅ Take-Profit: 0.004287 (+5.00%)
⚖️ Risk/Reward: 1:2.9
🔍 Technical Reasoning:
The Asian session consolidation range has broken to the upside with strong momentum. Early session breakouts backed by volume typically offer excellent follow-through toward session highs.
💡 Key Confluences:
• Spot+Futures ✓
• 📊 ATR 1.8% — healthy volatility
• 🚀 Volume ×2.4 above average
🚫 Invalidation Rule: If a 1-hour candle closes below $0.004012 (-1.74%), this bullish thesis is invalidated. Exit trade without holding into drawdowns.
💡 Trade Management: Secure 50% profit at Take-Profit target ($0.004287 +5.00%) and move Stop-Loss to Breakeven to eliminate downside risk.
📊 Market Metrics:
• Funding: 0.0050% (Neutral) • Next: 2h 18m
• Open Interest (OI): $16.22M
• 24h Volume: $13.52M
• 24h Range: 0.003866 — 0.004356 (-5.1%)
📈 Strategy Track Record: WR 36% over 1392 trades
#BEAMX #CryptoTrading #TechnicalAnalysis #BinanceSquare
⚠️ Not financial advice. Always manage your risk.
Setup: 🟢 LONG $BEAMX (FUTURES)
🎯 Entry: 0.004083
🛑 Stop-Loss: 0.004012 (-1.74%)
✅ Take-Profit: 0.004287 (+5.00%)
⚖️ Risk/Reward: 1:2.9
🔍 Technical Reasoning:
The Asian session consolidation range has broken to the upside with strong momentum. Early session breakouts backed by volume typically offer excellent follow-through toward session highs.
💡 Key Confluences:
• Spot+Futures ✓
• 📊 ATR 1.8% — healthy volatility
• 🚀 Volume ×2.4 above average
🚫 Invalidation Rule: If a 1-hour candle closes below $0.004012 (-1.74%), this bullish thesis is invalidated. Exit trade without holding into drawdowns.
💡 Trade Management: Secure 50% profit at Take-Profit target ($0.004287 +5.00%) and move Stop-Loss to Breakeven to eliminate downside risk.
📊 Market Metrics:
• Funding: 0.0050% (Neutral) • Next: 2h 18m
• Open Interest (OI): $16.22M
• 24h Volume: $13.52M
• 24h Range: 0.003866 — 0.004356 (-5.1%)
📈 Strategy Track Record: WR 36% over 1392 trades
#BEAMX #CryptoTrading #TechnicalAnalysis #BinanceSquare
⚠️ Not financial advice. Always manage your risk.
47
Understanding the Volume Trap in $BEAMX
Does higher volume always mean a breakout is certain? Many people assume that when volume rises above the baseline, as we currently see with $BEAMX, a trend must follow. They believe high activity serves as a guarantee of direction. However, this is a common misconception about how markets function.
Volume simply represents the total number of units exchanged between buyers and sellers. It measures intensity, not necessarily progress. When $BEAMX shows an hourly direction of up alongside high activity, it means participants are active, but it does not tell us who is winning the struggle. If a price moves toward 0.004064 while volume spikes, it could indicate a breakout, or it might just show a heavy exchange of hands where sellers are absorbing every buy order.
We see this in the current data where the RSI is 55.1153 and the price sits at 0.003985. The mechanism of a false breakout often involves high volume that fails to sustain a move beyond a level. If the price returns below 0.00395667 or 0.00397098, the high volume actually trapped those who entered late. To reassess this, one should look for price to hold above 0.00409506 rather than just watching the activity bars. High volume is a engine, but the engine can run in neutral. 📈
Probabilistic market research, not a recommendation or guaranteed return.
Which trading assumption would you like to question next?
#BEAMX #CryptoLearning
Binance spot proof for $BEAMX: closed price 0.003985 USDT.
Source: binance. Closed candle: 2026-11-07T13:00:00+00:00.
Understanding the Volume Trap in $BEAMX
Does higher volume always mean a breakout is certain? Many people assume that when volume rises above the baseline, as we currently see with $BEAMX , a trend must follow. They believe high activity serves as a guarantee of direction. However, this is a common misconception about how markets function.
Volume simply represents the total number of units exchanged between buyers and sellers. It measures intensity, not necessarily progress. When $BEAMX shows an hourly direction of up alongside high activity, it means participants are active, but it does not tell us who is winning the struggle. If a price moves toward 0.004064 while volume spikes, it could indicate a breakout, or it might just show a heavy exchange of hands where sellers are absorbing every buy order.
We see this in the current data where the RSI is 55.1153 and the price sits at 0.003985. The mechanism of a false breakout often involves high volume that fails to sustain a move beyond a level. If the price returns below 0.00395667 or 0.00397098, the high volume actually trapped those who entered late. To reassess this, one should look for price to hold above 0.00409506 rather than just watching the activity bars. High volume is a engine, but the engine can run in neutral. 📈
Probabilistic market research, not a recommendation or guaranteed return.
Which trading assumption would you like to question next?
#BEAMX #CryptoLearning
Binance spot proof for $BEAMX : closed price 0.003985 USDT.
Source: binance. Closed candle: 2026-11-07T13:00:00+00:00.
Does higher volume always mean a breakout is certain? Many people assume that when volume rises above the baseline, as we currently see with $BEAMX , a trend must follow. They believe high activity serves as a guarantee of direction. However, this is a common misconception about how markets function.
Volume simply represents the total number of units exchanged between buyers and sellers. It measures intensity, not necessarily progress. When $BEAMX shows an hourly direction of up alongside high activity, it means participants are active, but it does not tell us who is winning the struggle. If a price moves toward 0.004064 while volume spikes, it could indicate a breakout, or it might just show a heavy exchange of hands where sellers are absorbing every buy order.
We see this in the current data where the RSI is 55.1153 and the price sits at 0.003985. The mechanism of a false breakout often involves high volume that fails to sustain a move beyond a level. If the price returns below 0.00395667 or 0.00397098, the high volume actually trapped those who entered late. To reassess this, one should look for price to hold above 0.00409506 rather than just watching the activity bars. High volume is a engine, but the engine can run in neutral. 📈
Probabilistic market research, not a recommendation or guaranteed return.
Which trading assumption would you like to question next?
#BEAMX #CryptoLearning
Binance spot proof for $BEAMX : closed price 0.003985 USDT.
Source: binance. Closed candle: 2026-11-07T13:00:00+00:00.
26
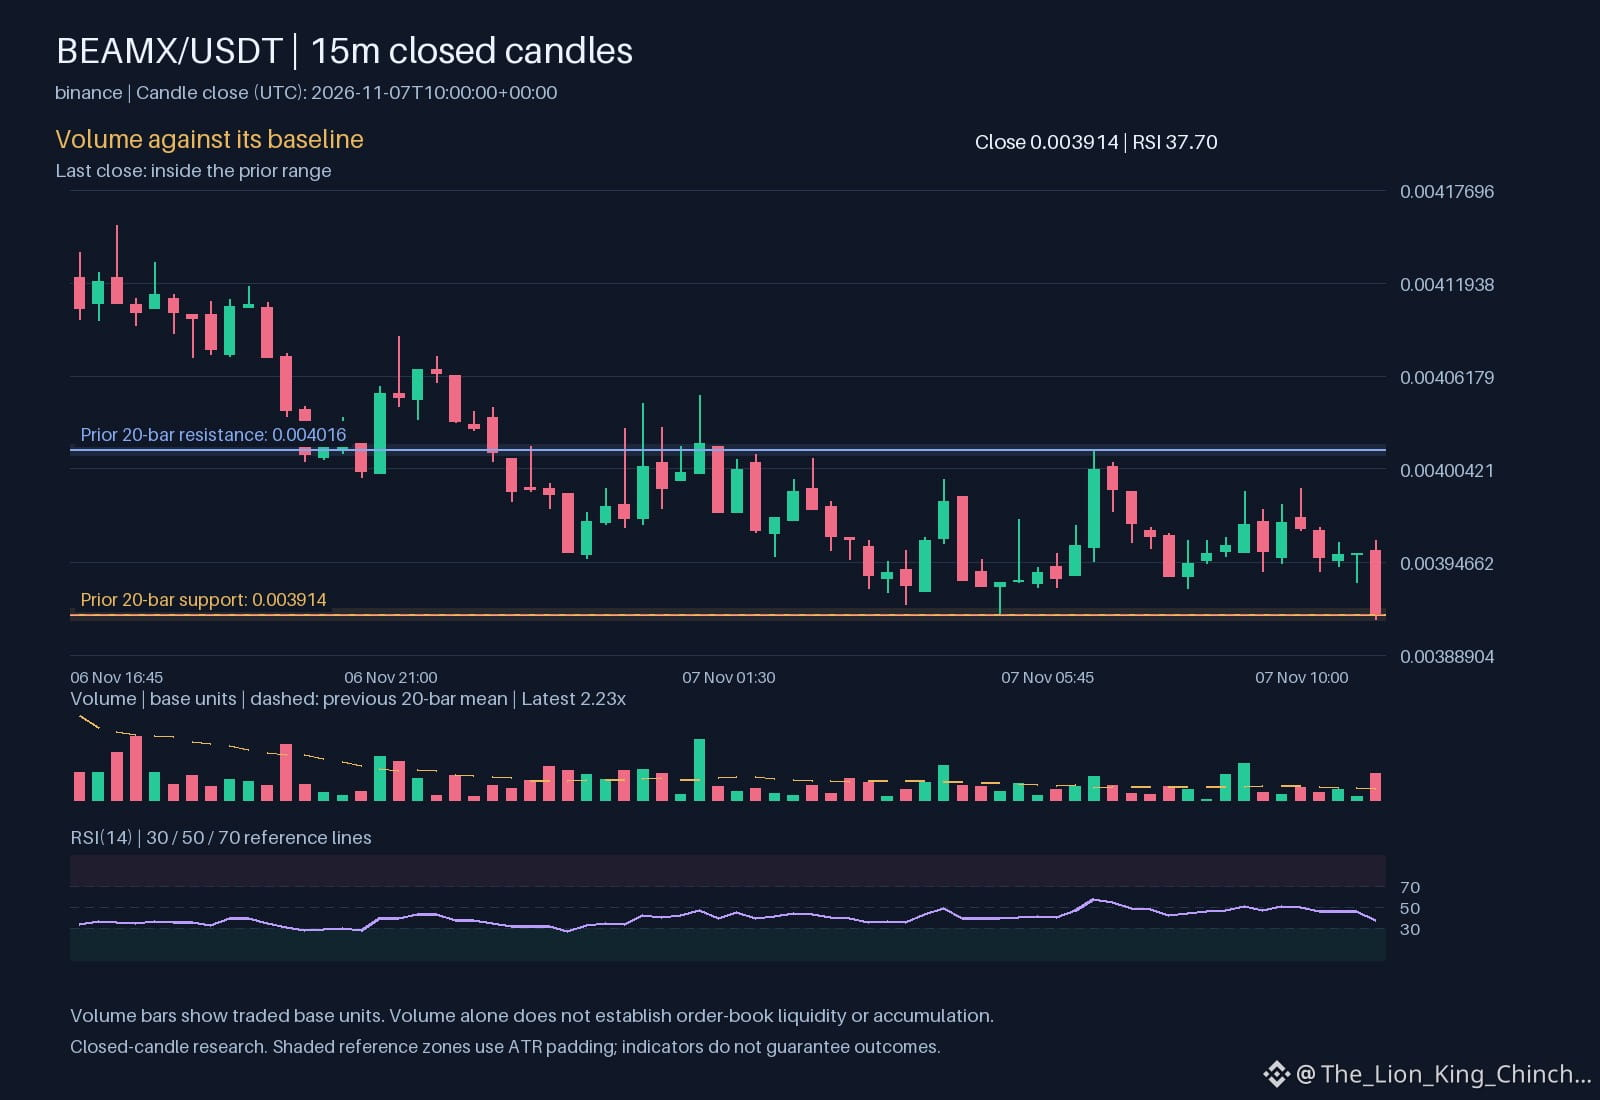
Balancing Entry Quality and Chasing on $BEAMX
The chart shows an hourly down direction while volume sits above baseline. This combination suggests pressure, but the quality of the entry remains ambiguous.
One practical trade‑off is choosing between a clean entry at a clear support level and jumping in early to catch a potential move. Imagine a thought experiment where a trader waits for price to touch the 0.003914 line before buying. The waiting period may improve entry quality, reducing immediate risk, but it also increases the chance that the down move continues and the price never returns to that level. Conversely, chasing the price as it falls toward the 0.00395502 can capture a quick rebound if the down pressure eases, yet the entry may sit too close to the current market, exposing the trader to a tighter stop and larger loss if the trend persists.
If the assumption that volume confirms the down move fails, the price could reverse toward the 0.004016 zone, invalidating the initial bias. In that scenario, a wider stop based on the 2.95965e-05 might protect against a whipsaw, but it also reduces the risk‑reward ratio.
A simple checklist can help decide:
- Is the price near a strong structural level (0.003914 or 0.004016)?
- Does the 2.22802 indicate genuine pressure or just a temporary spike?
- How far is the stop relative to the 2.95965e-05?
- Can the trade wait for a clearer signal, such as a confirming pullback to the 0.00398281?
By weighing entry precision against the temptation to chase, traders can align their risk tolerance with the current evidence without relying on invented price predictions.
Probabilistic market research, not a recommendation or guaranteed return.
Would you wait for clearer structure or reassess the risk first?
#BEAMX #RiskManagement
Binance spot proof for $BEAMX: closed price 0.003914 USDT.
Source: binance. Closed candle: 2026-11-07T10:00:00+00:00.
Balancing Entry Quality and Chasing on $BEAMX
The chart shows an hourly down direction while volume sits above baseline. This combination suggests pressure, but the quality of the entry remains ambiguous.
One practical trade‑off is choosing between a clean entry at a clear support level and jumping in early to catch a potential move. Imagine a thought experiment where a trader waits for price to touch the 0.003914 line before buying. The waiting period may improve entry quality, reducing immediate risk, but it also increases the chance that the down move continues and the price never returns to that level. Conversely, chasing the price as it falls toward the 0.00395502 can capture a quick rebound if the down pressure eases, yet the entry may sit too close to the current market, exposing the trader to a tighter stop and larger loss if the trend persists.
If the assumption that volume confirms the down move fails, the price could reverse toward the 0.004016 zone, invalidating the initial bias. In that scenario, a wider stop based on the 2.95965e-05 might protect against a whipsaw, but it also reduces the risk‑reward ratio.
A simple checklist can help decide:
- Is the price near a strong structural level (0.003914 or 0.004016)?
- Does the 2.22802 indicate genuine pressure or just a temporary spike?
- How far is the stop relative to the 2.95965e-05?
- Can the trade wait for a clearer signal, such as a confirming pullback to the 0.00398281?
By weighing entry precision against the temptation to chase, traders can align their risk tolerance with the current evidence without relying on invented price predictions.
Probabilistic market research, not a recommendation or guaranteed return.
Would you wait for clearer structure or reassess the risk first?
#BEAMX #RiskManagement
Binance spot proof for $BEAMX : closed price 0.003914 USDT.
Source: binance. Closed candle: 2026-11-07T10:00:00+00:00.
The chart shows an hourly down direction while volume sits above baseline. This combination suggests pressure, but the quality of the entry remains ambiguous.
One practical trade‑off is choosing between a clean entry at a clear support level and jumping in early to catch a potential move. Imagine a thought experiment where a trader waits for price to touch the 0.003914 line before buying. The waiting period may improve entry quality, reducing immediate risk, but it also increases the chance that the down move continues and the price never returns to that level. Conversely, chasing the price as it falls toward the 0.00395502 can capture a quick rebound if the down pressure eases, yet the entry may sit too close to the current market, exposing the trader to a tighter stop and larger loss if the trend persists.
If the assumption that volume confirms the down move fails, the price could reverse toward the 0.004016 zone, invalidating the initial bias. In that scenario, a wider stop based on the 2.95965e-05 might protect against a whipsaw, but it also reduces the risk‑reward ratio.
A simple checklist can help decide:
- Is the price near a strong structural level (0.003914 or 0.004016)?
- Does the 2.22802 indicate genuine pressure or just a temporary spike?
- How far is the stop relative to the 2.95965e-05?
- Can the trade wait for a clearer signal, such as a confirming pullback to the 0.00398281?
By weighing entry precision against the temptation to chase, traders can align their risk tolerance with the current evidence without relying on invented price predictions.
Probabilistic market research, not a recommendation or guaranteed return.
Would you wait for clearer structure or reassess the risk first?
#BEAMX #RiskManagement
Binance spot proof for $BEAMX : closed price 0.003914 USDT.
Source: binance. Closed candle: 2026-11-07T10:00:00+00:00.
86

·
--
🔔 $BEAMX secures fresh bullish order block
LONG · 15M
Entry: $0.004161 - $0.004172
TP1: $0.004273
TP2: $0.004333
TP3: $0.004394
SL: $0.004049
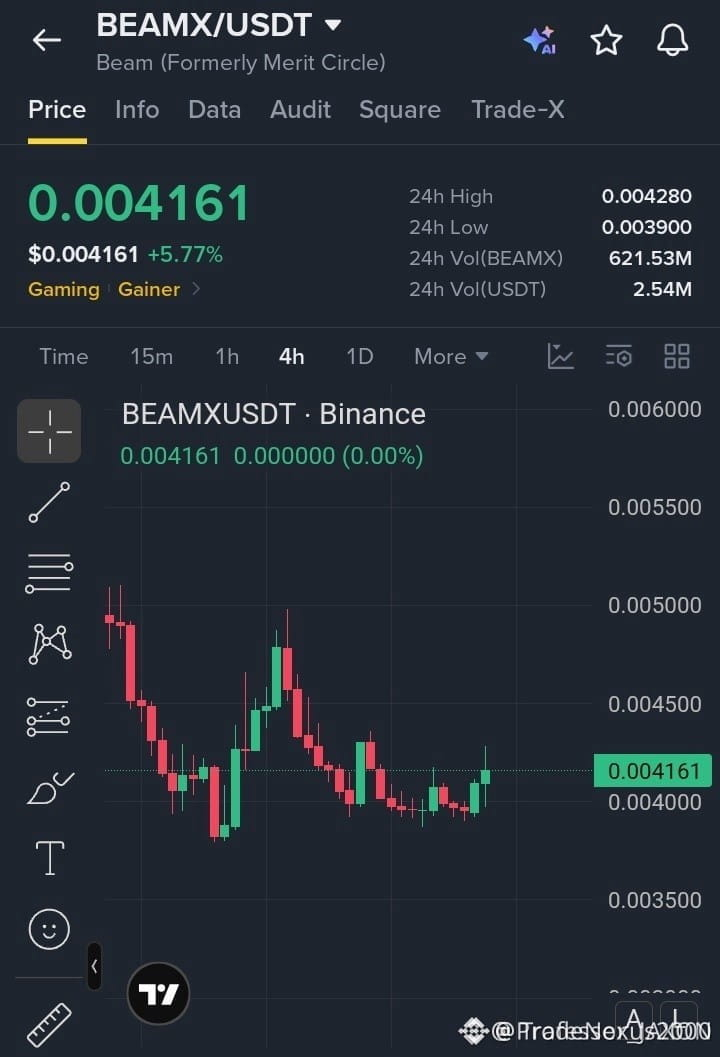
Sell‑side liquidity was swept, BOS on the 15M confirms the uptrend. A retest of the bullish order block at discount gives entry at $0.004161 with stop at $0.004049. Target is buy‑side liquidity at $0.004394; invalid if price breaks below the order block.
#BEAMX #CryptoTrading · NFA
🔔 $BEAMX secures fresh bullish order block
LONG · 15M
Entry: $0.004161 - $0.004172
TP1: $0.004273
TP2: $0.004333
TP3: $0.004394
SL: $0.004049
Sell‑side liquidity was swept, BOS on the 15M confirms the uptrend. A retest of the bullish order block at discount gives entry at $0.004161 with stop at $0.004049. Target is buy‑side liquidity at $0.004394; invalid if price breaks below the order block.
#BEAMX #CryptoTrading · NFA
LONG · 15M
Entry: $0.004161 - $0.004172
TP1: $0.004273
TP2: $0.004333
TP3: $0.004394
SL: $0.004049
Sell‑side liquidity was swept, BOS on the 15M confirms the uptrend. A retest of the bullish order block at discount gives entry at $0.004161 with stop at $0.004049. Target is buy‑side liquidity at $0.004394; invalid if price breaks below the order block.
#BEAMX #CryptoTrading · NFA
127

·
--
Bearish
$BEAMX
{spot}(BEAMXUSDT)
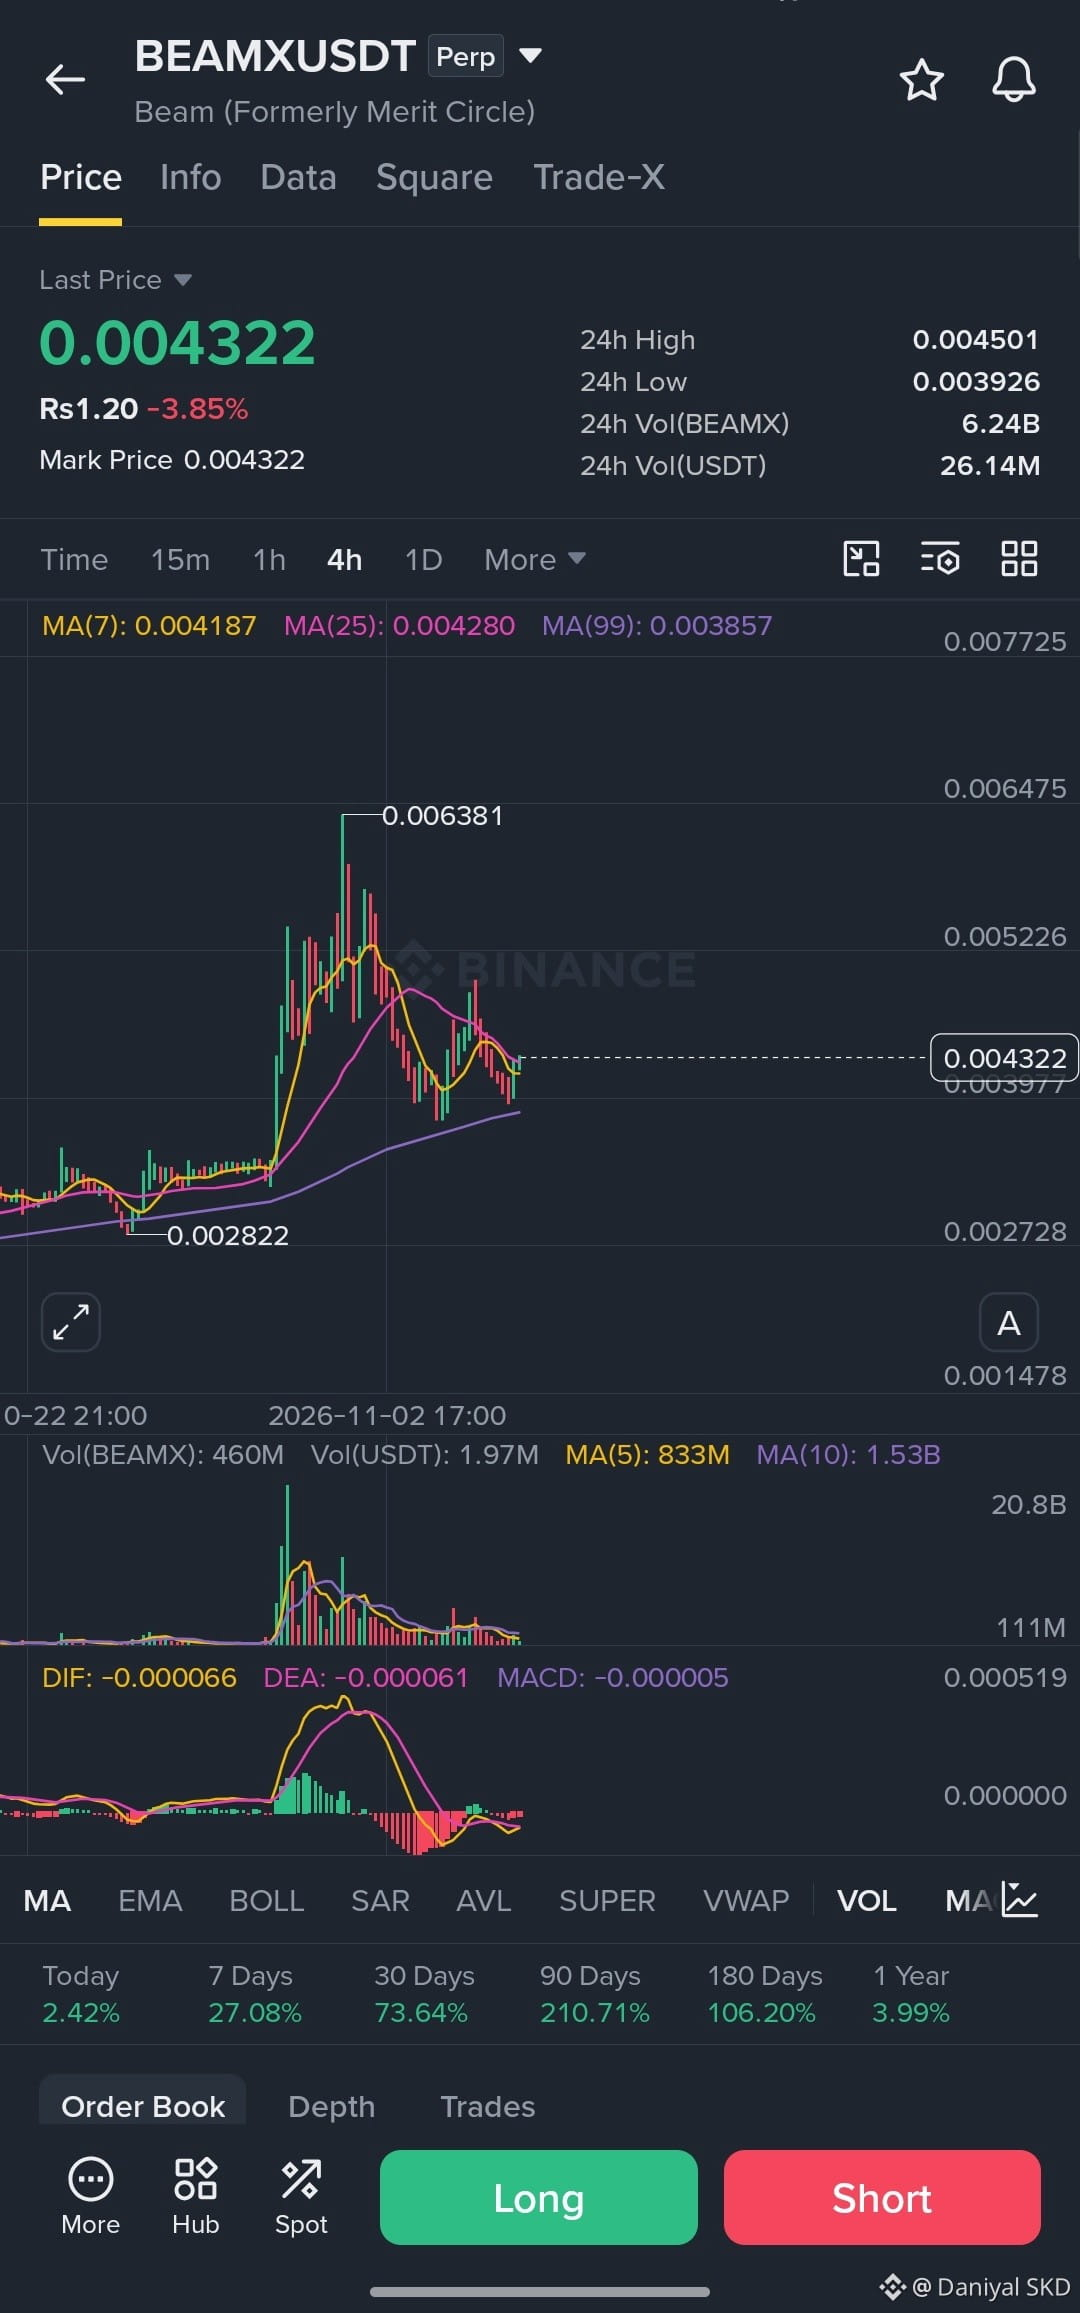
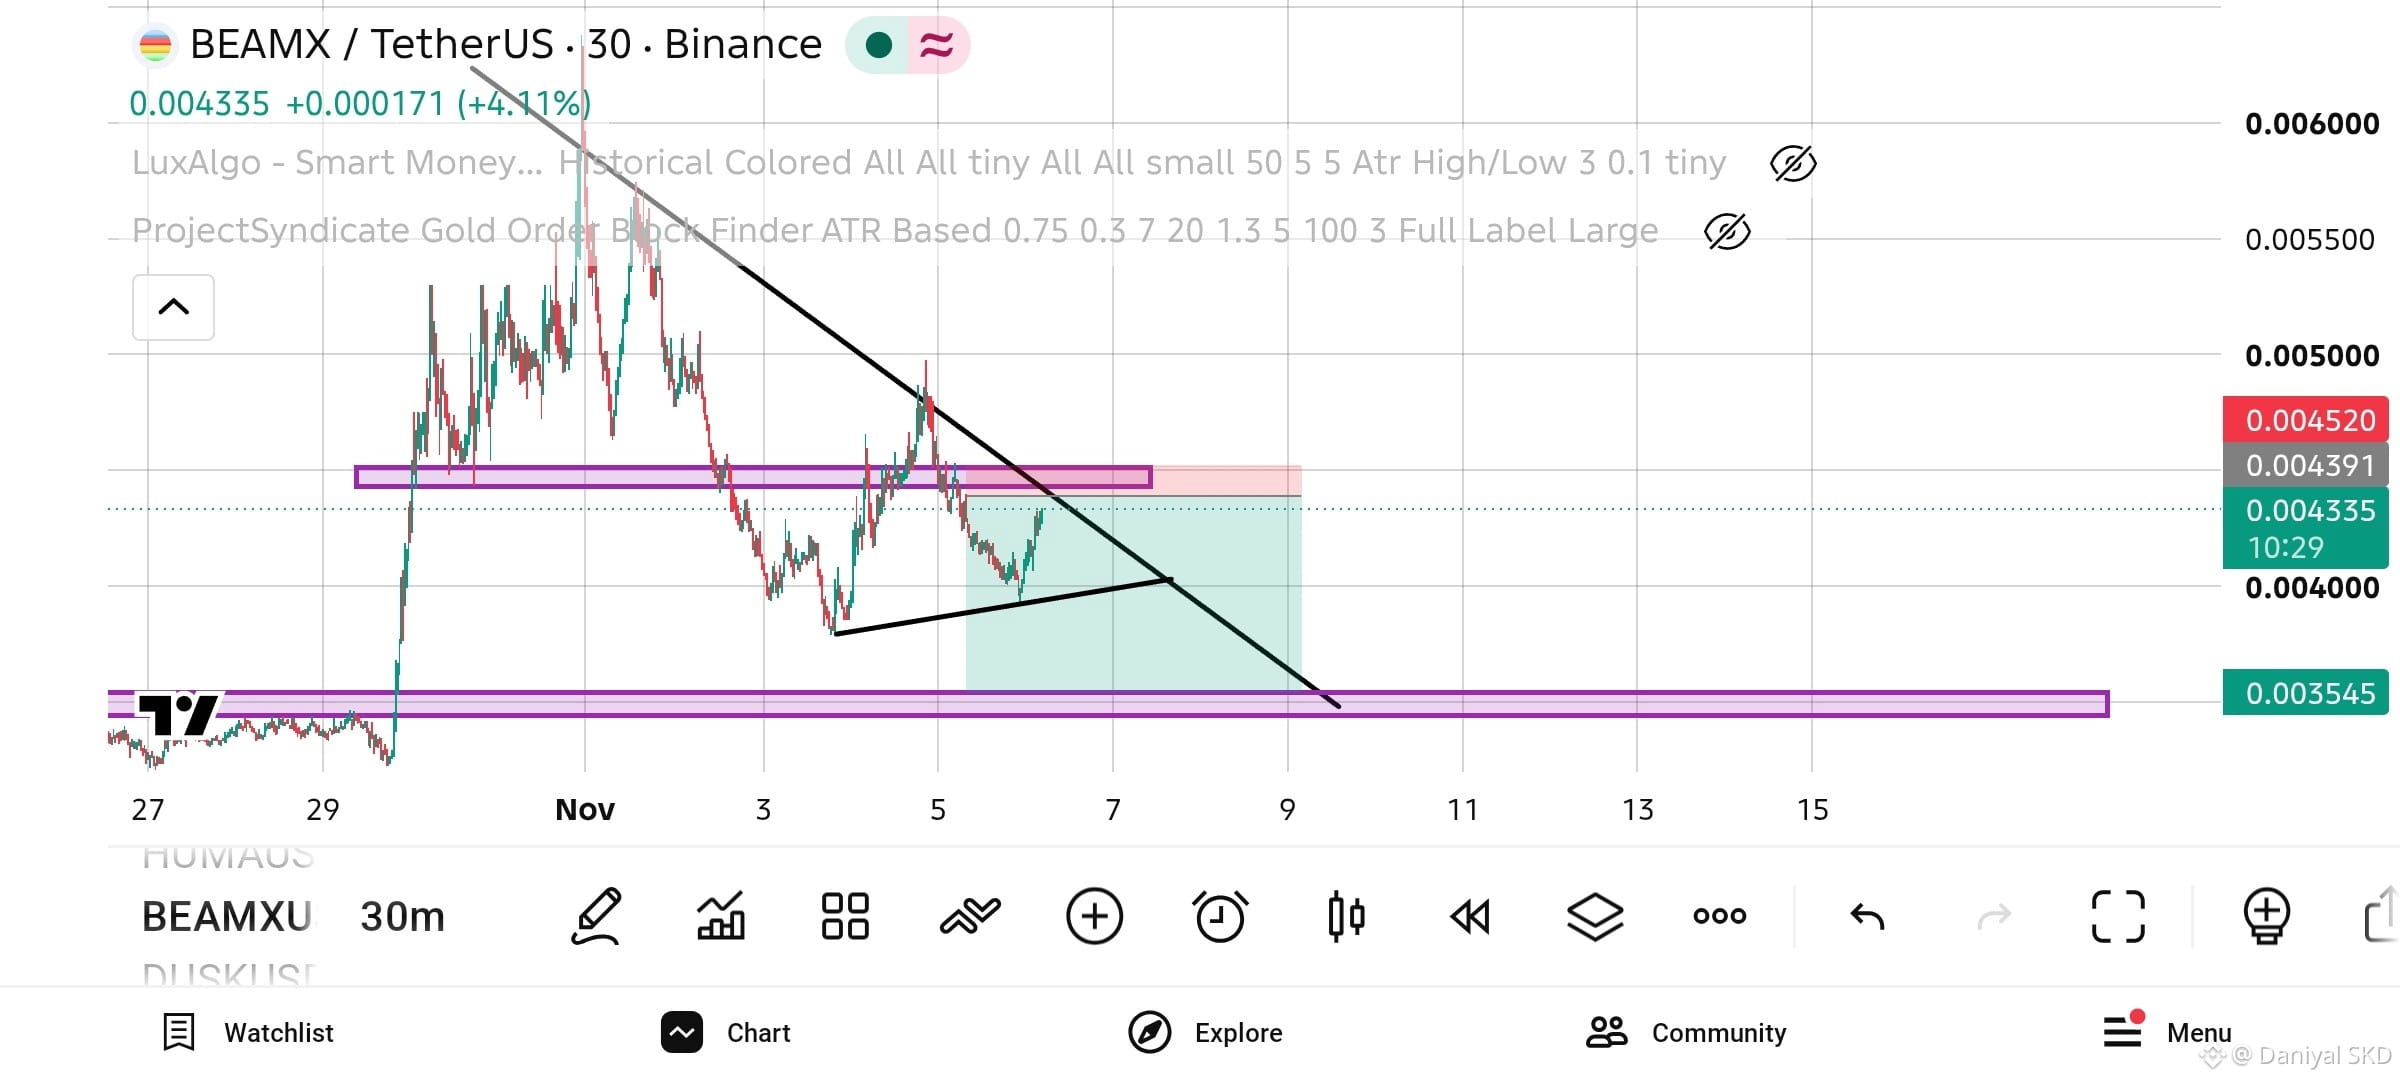
according to My analysis the beamx coin goes big dump because it touch the resistance level which shows in screen shot so everyone can trade in this coin and ma some profit 👍💯💯💯
ENTRY: 0.00435 TO 0.00443
SL: 0.00456
TP1:0.0.00419
TP2:0.004
TP 3:0.003545
#BEAMX #DumpandDump
$BEAMX
according to My analysis the beamx coin goes big dump because it touch the resistance level which shows in screen shot so everyone can trade in this coin and ma some profit 👍💯💯💯
ENTRY: 0.00435 TO 0.00443
SL: 0.00456
TP1:0.0.00419
TP2:0.004
TP 3:0.003545
#BEAMX #DumpandDump
according to My analysis the beamx coin goes big dump because it touch the resistance level which shows in screen shot so everyone can trade in this coin and ma some profit 👍💯💯💯
ENTRY: 0.00435 TO 0.00443
SL: 0.00456
TP1:0.0.00419
TP2:0.004
TP 3:0.003545
#BEAMX #DumpandDump
513

·
--
🔻 $BEAMX SHORT 🔻
Entry: 0.00395211 – 0.00397589
SL: 0.00408060
TP1: 0.00386406
TP2: 0.00379743
TP3: 0.00371414
📈 Technical Outlook:
$BEAMX is showing bearish pressure after losing strength near a key technical zone. The setup is supported by EMA trend is bearish, price is breaking below recent support. As long as price stays below the entry area, sellers may continue pushing toward the listed downside targets.
#BEAMX #Crypto #BinanceSquare #Trading
🔻 $BEAMX SHORT 🔻
Entry: 0.00395211 – 0.00397589
SL: 0.00408060
TP1: 0.00386406
TP2: 0.00379743
TP3: 0.00371414
📈 Technical Outlook:
$BEAMX is showing bearish pressure after losing strength near a key technical zone. The setup is supported by EMA trend is bearish, price is breaking below recent support. As long as price stays below the entry area, sellers may continue pushing toward the listed downside targets.
#BEAMX #Crypto #BinanceSquare #Trading
Entry: 0.00395211 – 0.00397589
SL: 0.00408060
TP1: 0.00386406
TP2: 0.00379743
TP3: 0.00371414
📈 Technical Outlook:
$BEAMX is showing bearish pressure after losing strength near a key technical zone. The setup is supported by EMA trend is bearish, price is breaking below recent support. As long as price stays below the entry area, sellers may continue pushing toward the listed downside targets.
#BEAMX #Crypto #BinanceSquare #Trading

35
·
--
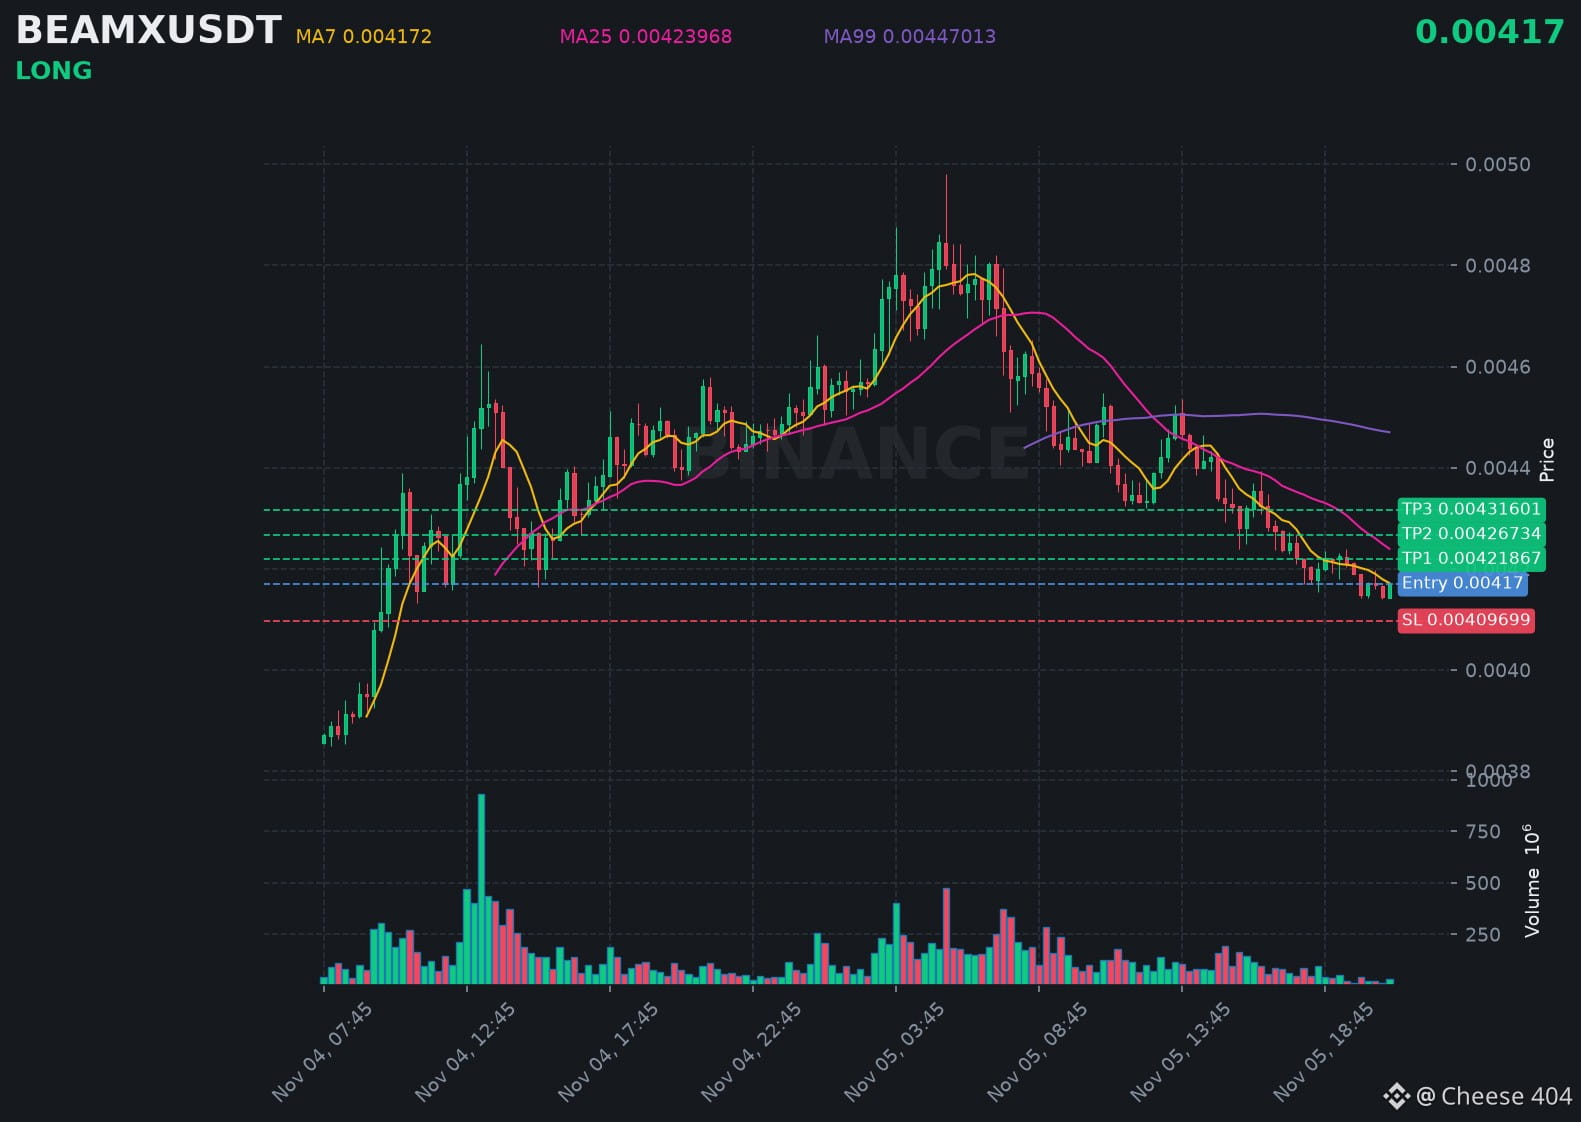
$BEAMX is trending up with real conviction, buyers defending every dip along the way.
📍 @ 0.00417 | Volume: 0.14M USD
RSI 37 | EMA20: 0.00422254 USD
📈 Trade Plan:
📈 Entry: 0.0041554 – 0.0041846
🛑 Stop Loss: 0.00409699
🎯 TP1: 0.00421867
🎯 TP2: 0.00426734
🎯 TP3: 0.00431601
Waiting for a retest, then riding the uptrend.
👉 $BEAMX 👈 Catch it
#BEAMX
$BEAMX is trending up with real conviction, buyers defending every dip along the way.
📍 @ 0.00417 | Volume: 0.14M USD
RSI 37 | EMA20: 0.00422254 USD
📈 Trade Plan:
📈 Entry: 0.0041554 – 0.0041846
🛑 Stop Loss: 0.00409699
🎯 TP1: 0.00421867
🎯 TP2: 0.00426734
🎯 TP3: 0.00431601
Waiting for a retest, then riding the uptrend.
👉 $BEAMX 👈 Catch it
#BEAMX
📍 @ 0.00417 | Volume: 0.14M USD
RSI 37 | EMA20: 0.00422254 USD
📈 Trade Plan:
📈 Entry: 0.0041554 – 0.0041846
🛑 Stop Loss: 0.00409699
🎯 TP1: 0.00421867
🎯 TP2: 0.00426734
🎯 TP3: 0.00431601
Waiting for a retest, then riding the uptrend.
👉 $BEAMX 👈 Catch it
#BEAMX
107
·
--
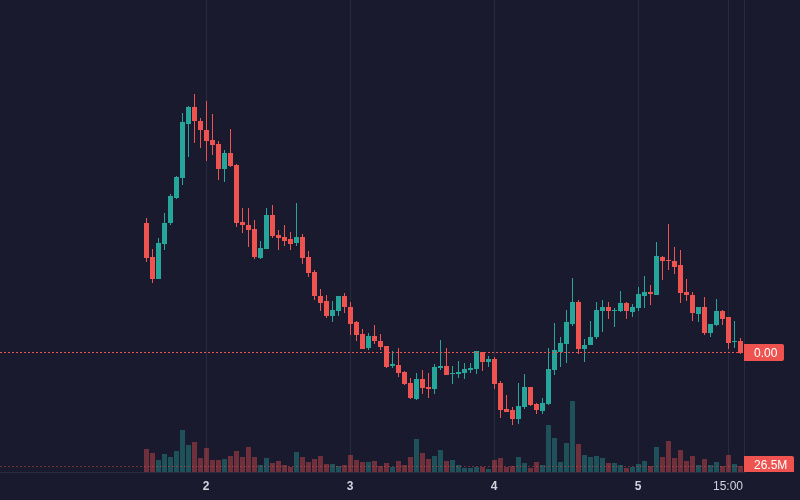
$BEAMX BEAMX is showing bearish movement: -6.35% (Crypto).
Volume: 6.87M | Last: $0.004217
Key signals: strong momentum, high volatility, high trader activity.
Bias Daily: BULLISH 🟢 | Weekly: BULLISH 🟢
BEAMX dropped 4.0% over 24h to $0.004282 as persistent profit-taking outweighed earlier whale accumulation.
**Exhaustion after local peak (High)**: BEAMX rallied to $0.004786 before aggressive profit-taking triggered consistent capital outflows exceeding $1.3M across subsequent hours.
- **Whale accumulation offset (Medium)**: On-chain accumulation of 18.83M BEAMX provided a temporary rally, but failed to sustain price above the 99-period EMA.
- **Technical breakdown (Medium)**: MACD histogram flipped negative while RSI dropped from an overbought 86.2 to 29.2 → strong downward momentum.
#BEAMX #TRUMP #BTCRebounds80K #Bitcoin #Crypto
$BEAMX BEAMX is showing bearish movement: -6.35% (Crypto).
Volume: 6.87M | Last: $0.004217
Key signals: strong momentum, high volatility, high trader activity.
Bias Daily: BULLISH 🟢 | Weekly: BULLISH 🟢
BEAMX dropped 4.0% over 24h to $0.004282 as persistent profit-taking outweighed earlier whale accumulation.
**Exhaustion after local peak (High)**: BEAMX rallied to $0.004786 before aggressive profit-taking triggered consistent capital outflows exceeding $1.3M across subsequent hours.
- **Whale accumulation offset (Medium)**: On-chain accumulation of 18.83M BEAMX provided a temporary rally, but failed to sustain price above the 99-period EMA.
- **Technical breakdown (Medium)**: MACD histogram flipped negative while RSI dropped from an overbought 86.2 to 29.2 → strong downward momentum.
#BEAMX #TRUMP #BTCRebounds80K #Bitcoin #Crypto
Volume: 6.87M | Last: $0.004217
Key signals: strong momentum, high volatility, high trader activity.
Bias Daily: BULLISH 🟢 | Weekly: BULLISH 🟢
BEAMX dropped 4.0% over 24h to $0.004282 as persistent profit-taking outweighed earlier whale accumulation.
**Exhaustion after local peak (High)**: BEAMX rallied to $0.004786 before aggressive profit-taking triggered consistent capital outflows exceeding $1.3M across subsequent hours.
- **Whale accumulation offset (Medium)**: On-chain accumulation of 18.83M BEAMX provided a temporary rally, but failed to sustain price above the 99-period EMA.
- **Technical breakdown (Medium)**: MACD histogram flipped negative while RSI dropped from an overbought 86.2 to 29.2 → strong downward momentum.
#BEAMX #TRUMP #BTCRebounds80K #Bitcoin #Crypto
110

·
--
$BEAMX sits 12.3 percent below $0.004978 and that gap matters now
A clean hourly close above that high opens the door for real momentum
Otherwise expect a drift back to $0.004164 to test the range lows
Tap $BEAMX and check the hourly chart yourself
Rejection or breakout
#BEAMX #PriceAction
$BEAMX sits 12.3 percent below $0.004978 and that gap matters now
A clean hourly close above that high opens the door for real momentum
Otherwise expect a drift back to $0.004164 to test the range lows
Tap $BEAMX and check the hourly chart yourself
Rejection or breakout
#BEAMX #PriceAction
A clean hourly close above that high opens the door for real momentum
Otherwise expect a drift back to $0.004164 to test the range lows
Tap $BEAMX and check the hourly chart yourself
Rejection or breakout
#BEAMX #PriceAction
14
Log in to explore more content
Join global crypto users on Binance Square
⚡️ Get latest and useful information about crypto.
💬 Trusted by the world’s largest crypto exchange.
👍 Discover real insights from verified creators.
Email / Phone number
Trending Topics
1
#BinanceReopensWithdrawalsForHYPE&APT
48,759 views
702 Discussing
2
#SouthKoreaDraftLawTargets15To20%ShareholderCap
52,005 views
467 Discussing
3
#TradFiForBeginners
156,636 views
1,646 Discussing
4
#KeplrAdvisesSocialLoginUsersToTransferAssets
31,541 views
418 Discussing
5
#TetherPlans€28.8MForJuventusCapitalIncrease
18,826 views
325 Discussing
6
#JobsReportRaisesHikeOdds
795,640 views
4,324 Discussing
7
#CPITestsDecemberRateOutlook
309,941 views
1,814 Discussing
8
#US Data Center Rules May Constrain AI Expansion
117,886 views
257 Discussing
9
#ARKPlans14ThematicETFsCoveringAIAndTokenizedMarkets
8,177 views
87 Discussing
10
#WillAnthropicListOnTime
253,208 views
1,847 Discussing