
Crypto Man Mab 1
350 Publicaciones

Crypto Man Mab 1
Denunciar
Bloquear usuario
0 Siguiendo
2 Seguidores
3 Me gusta
Publicaciones
Ver traducción
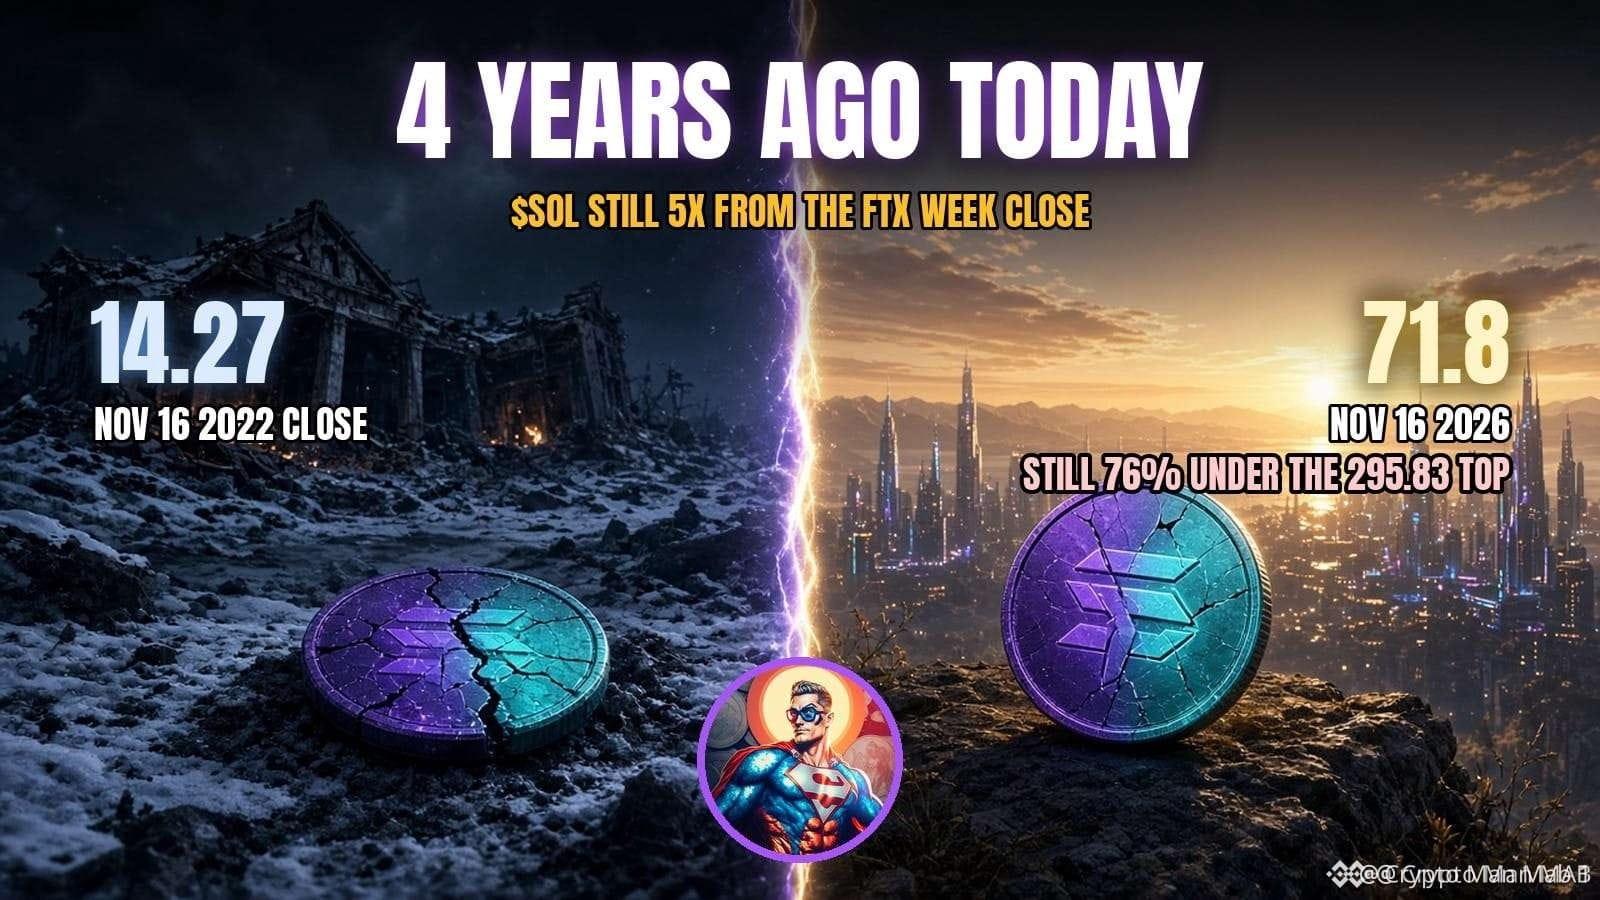
Four years ago today $SOL closed at 14.27 on Binance.
That was the week right after FTX blew up. Everyone was calling it a dead chain and it kept bleeding, all the way down to 8 by late December.
Today it sits around 71.8. Still about 76% under the 295.83 top from January 2025 and this month has been ugly for it.
But from that Nov 2022 close its still roughly 5 times higher.
Funny how the worst week a coin ever has can turn into the best entry of the whole cycle. Nobody wanted it at 14.
Four years ago today $SOL closed at 14.27 on Binance.
That was the week right after FTX blew up. Everyone was calling it a dead chain and it kept bleeding, all the way down to 8 by late December.
Today it sits around 71.8. Still about 76% under the 295.83 top from January 2025 and this month has been ugly for it.
But from that Nov 2022 close its still roughly 5 times higher.
Funny how the worst week a coin ever has can turn into the best entry of the whole cycle. Nobody wanted it at 14.
That was the week right after FTX blew up. Everyone was calling it a dead chain and it kept bleeding, all the way down to 8 by late December.
Today it sits around 71.8. Still about 76% under the 295.83 top from January 2025 and this month has been ugly for it.
But from that Nov 2022 close its still roughly 5 times higher.
Funny how the worst week a coin ever has can turn into the best entry of the whole cycle. Nobody wanted it at 14.
10
Ver traducción
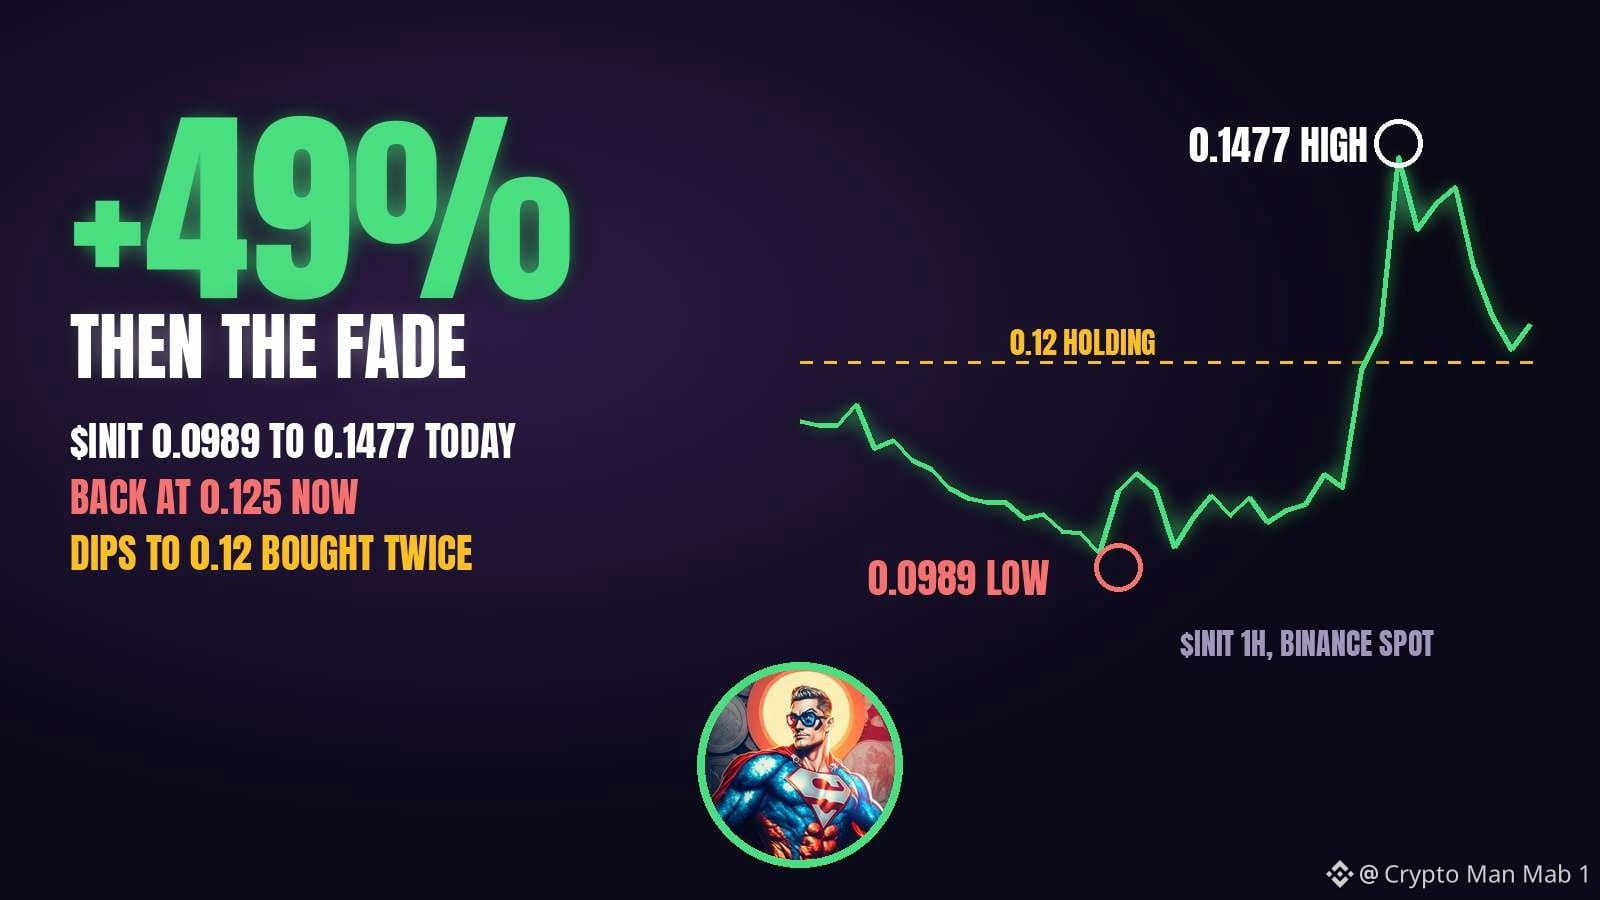
$INIT woke up today. 0.0989 at the low, 0.1477 by 08:00 UTC, and that 08:00 hour was its biggest volume hour since the Nov 11 spike.
Then the fade. It's sitting around 0.125 now, so almost half the pump already handed back.
The line I care about is 0.12. Price dipped into it twice this afternoon and both times it got bought. Hourly closes above it keep the move alive, with 0.134 and then the 0.1477 high as the next tests.
Lose 0.12 on a clean close and I think it drifts back to the 0.10 base where this all started. This is the same coin that printed 0.395 and gave it all back inside one daily candle a few days ago, so green hours alone don't impress me here.
$INIT woke up today. 0.0989 at the low, 0.1477 by 08:00 UTC, and that 08:00 hour was its biggest volume hour since the Nov 11 spike.
Then the fade. It's sitting around 0.125 now, so almost half the pump already handed back.
The line I care about is 0.12. Price dipped into it twice this afternoon and both times it got bought. Hourly closes above it keep the move alive, with 0.134 and then the 0.1477 high as the next tests.
Lose 0.12 on a clean close and I think it drifts back to the 0.10 base where this all started. This is the same coin that printed 0.395 and gave it all back inside one daily candle a few days ago, so green hours alone don't impress me here.
Then the fade. It's sitting around 0.125 now, so almost half the pump already handed back.
The line I care about is 0.12. Price dipped into it twice this afternoon and both times it got bought. Hourly closes above it keep the move alive, with 0.134 and then the 0.1477 high as the next tests.
Lose 0.12 on a clean close and I think it drifts back to the 0.10 base where this all started. This is the same coin that printed 0.395 and gave it all back inside one daily candle a few days ago, so green hours alone don't impress me here.
Ver traducción
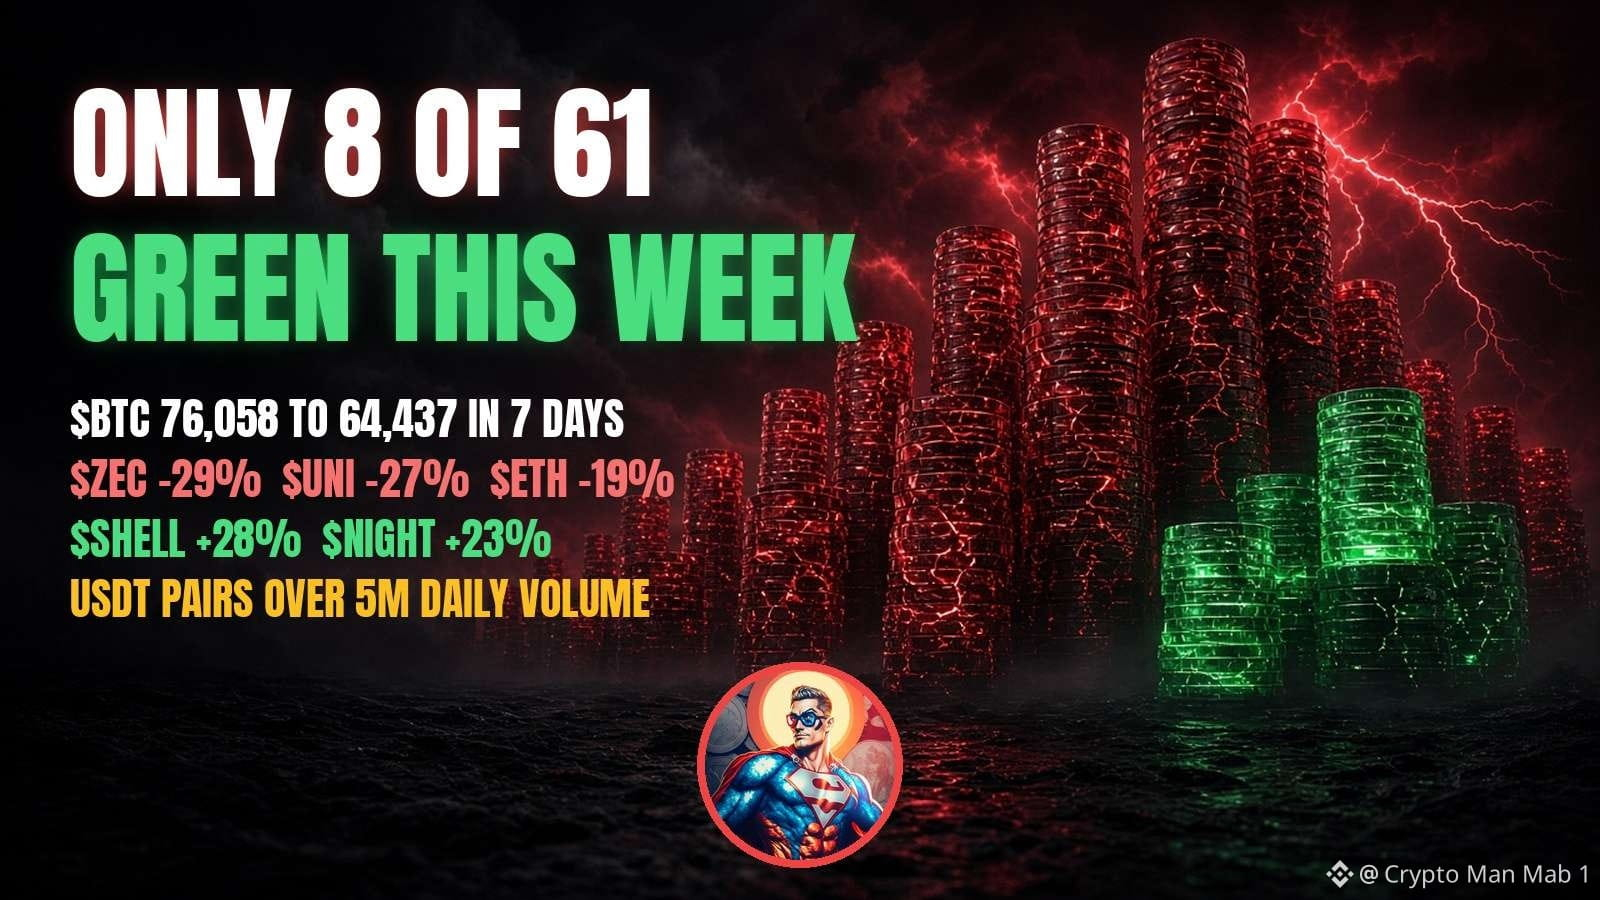
$BTC opened the last 7 days at 76,058. It's sitting near 64,400 now, about 15% lower, and it wicked to 62,006 earlier today.
$ETH did worse at 19%. ZEC gave back 29% and UNI 27%, the ugliest week of the big names.
The MSTR stock token on Binance fell 23%, more than BTC itself. Funny how the leveraged bet on the coin hurts more than the coin.
I counted the USDT pairs doing over 5M volume a day. 61 of them. Only 8 are green on the week, SHELL up 28% and NIGHT up 23% leading, plus a leveraged chip stock token up 19%.
So the money didn't vanish, it just stopped sitting in crypto majors for a while. Weekly candle closes in about 7 hours and honestly I'd rather watch that than force a trade tonight.
$BTC opened the last 7 days at 76,058. It's sitting near 64,400 now, about 15% lower, and it wicked to 62,006 earlier today.
$ETH did worse at 19%. ZEC gave back 29% and UNI 27%, the ugliest week of the big names.
The MSTR stock token on Binance fell 23%, more than BTC itself. Funny how the leveraged bet on the coin hurts more than the coin.
I counted the USDT pairs doing over 5M volume a day. 61 of them. Only 8 are green on the week, SHELL up 28% and NIGHT up 23% leading, plus a leveraged chip stock token up 19%.
So the money didn't vanish, it just stopped sitting in crypto majors for a while. Weekly candle closes in about 7 hours and honestly I'd rather watch that than force a trade tonight.
$ETH did worse at 19%. ZEC gave back 29% and UNI 27%, the ugliest week of the big names.
The MSTR stock token on Binance fell 23%, more than BTC itself. Funny how the leveraged bet on the coin hurts more than the coin.
I counted the USDT pairs doing over 5M volume a day. 61 of them. Only 8 are green on the week, SHELL up 28% and NIGHT up 23% leading, plus a leveraged chip stock token up 19%.
So the money didn't vanish, it just stopped sitting in crypto majors for a while. Weekly candle closes in about 7 hours and honestly I'd rather watch that than force a trade tonight.
27
Ver traducción
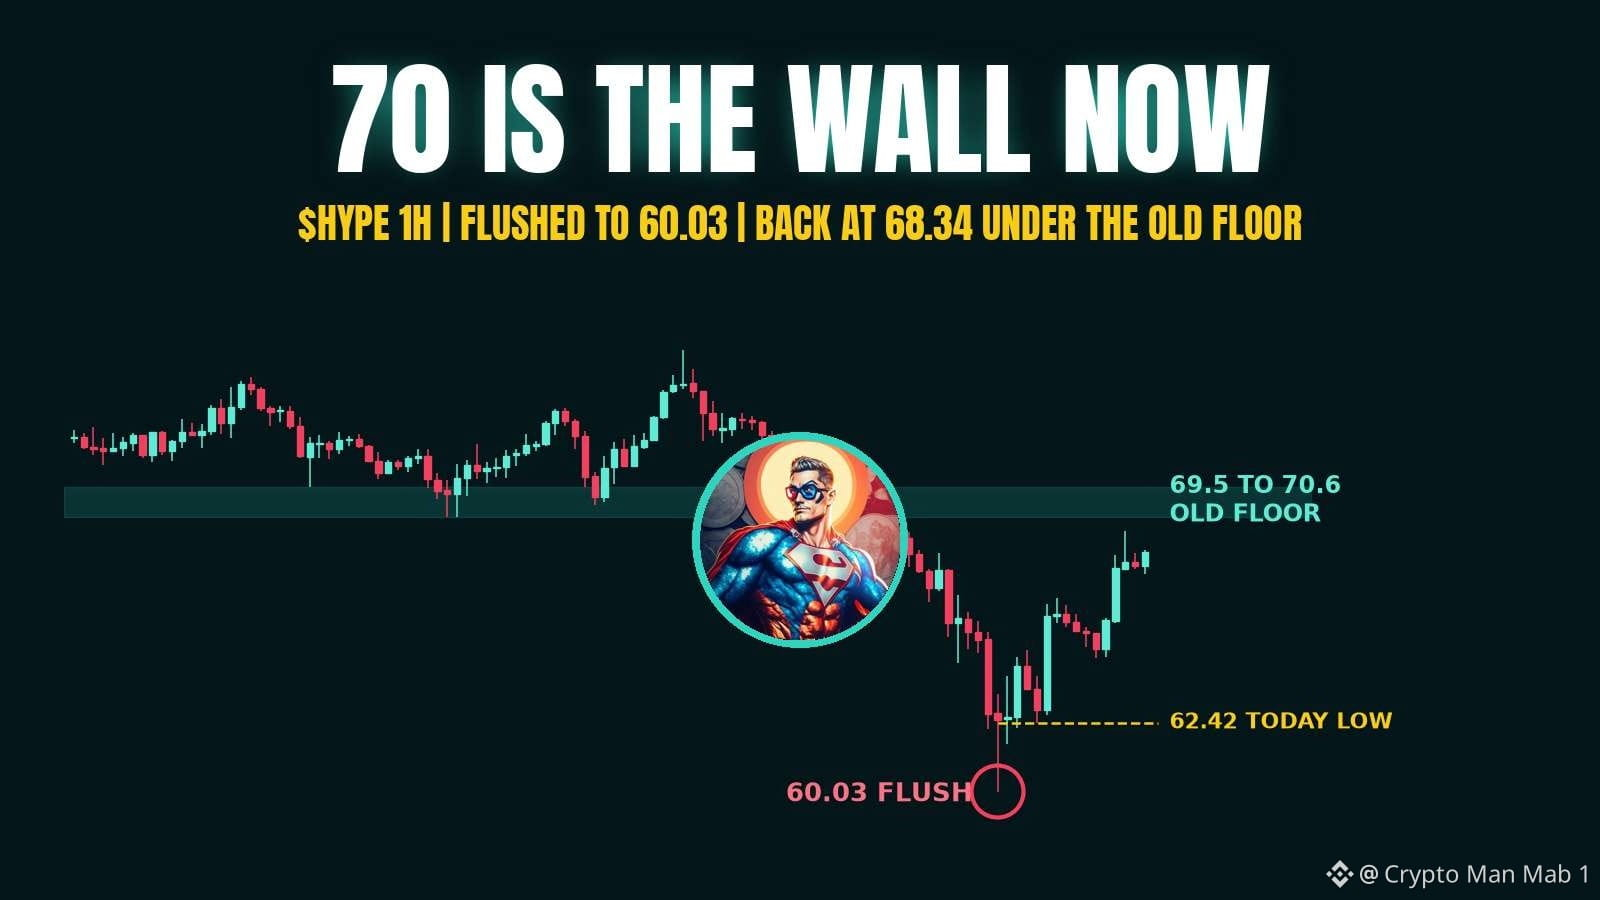
60.03. That was the print on $HYPE at 21:00 UTC yesterday, lowest it has traded since it listed on Binance spot in September.
That hour did 18.7M in volume, the heaviest of the whole dump. Looked like forced selling to me.
Bounce since then is decent, around 68.3 now, roughly 14% off the low.
But look where it stopped. Today's high was 69.05, right under the 69.5 to 70.6 zone that held as the floor from Nov 10 to Nov 13. Old floor, new ceiling.
For me an hourly close back above 70.6 puts it back inside the old range and the flush starts looking like a trap for shorts. If it rolls over here, 62.42 from this morning is the first thing I watch, then 60 again.
60.03. That was the print on $HYPE at 21:00 UTC yesterday, lowest it has traded since it listed on Binance spot in September.
That hour did 18.7M in volume, the heaviest of the whole dump. Looked like forced selling to me.
Bounce since then is decent, around 68.3 now, roughly 14% off the low.
But look where it stopped. Today's high was 69.05, right under the 69.5 to 70.6 zone that held as the floor from Nov 10 to Nov 13. Old floor, new ceiling.
For me an hourly close back above 70.6 puts it back inside the old range and the flush starts looking like a trap for shorts. If it rolls over here, 62.42 from this morning is the first thing I watch, then 60 again.
That hour did 18.7M in volume, the heaviest of the whole dump. Looked like forced selling to me.
Bounce since then is decent, around 68.3 now, roughly 14% off the low.
But look where it stopped. Today's high was 69.05, right under the 69.5 to 70.6 zone that held as the floor from Nov 10 to Nov 13. Old floor, new ceiling.
For me an hourly close back above 70.6 puts it back inside the old range and the flush starts looking like a trap for shorts. If it rolls over here, 62.42 from this morning is the first thing I watch, then 60 again.
27
Ver traducción
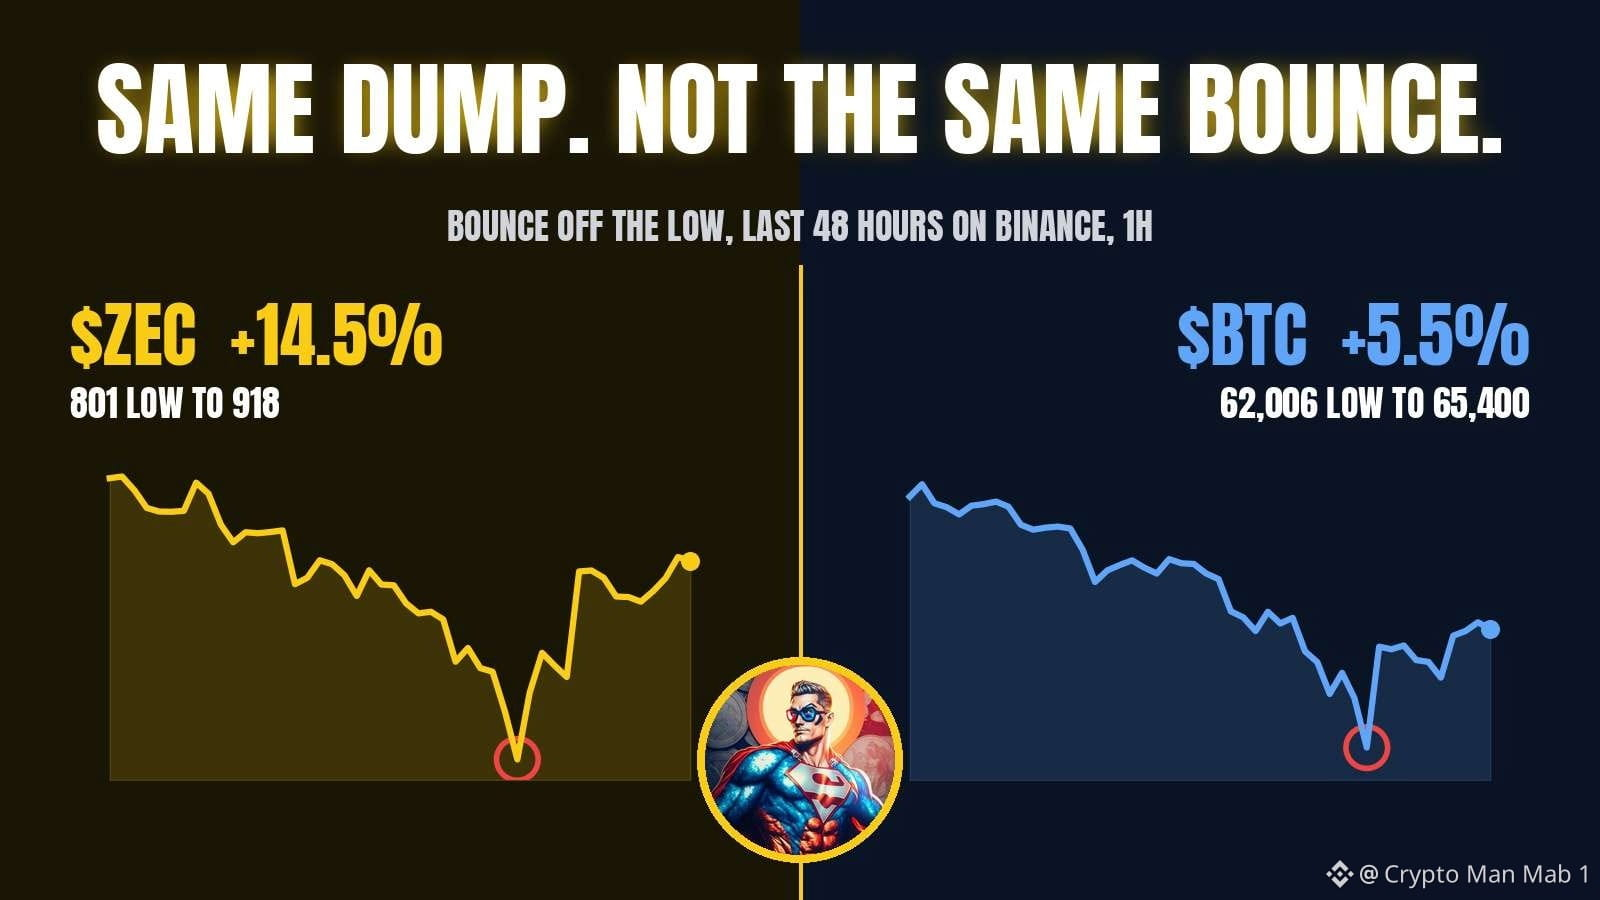
$BTC wicked to 62,006 early today and its back around 65,400 now. Roughly 5.5% off the low.
$ZEC took a worse hit. 801 last night, lowest since Sep 2, and now it's sitting near 918. Thats about 14.5% off the bottom in under a day, almost triple what BTC managed.
Zoom out though and neither chart is pretty. ZEC topped at 1,698 in September so even after this bounce it's still around 46% under that. BTC was 80.5k on Nov 4.
For me a fast bounce off a flush tells you buyers were sitting there waiting. It only really counts if the low doesn't get revisited on the next red day, and with this market that test usually comes quick.
Right now ZEC is the one showing the stronger hands.
$BTC wicked to 62,006 early today and its back around 65,400 now. Roughly 5.5% off the low.
$ZEC took a worse hit. 801 last night, lowest since Sep 2, and now it's sitting near 918. Thats about 14.5% off the bottom in under a day, almost triple what BTC managed.
Zoom out though and neither chart is pretty. ZEC topped at 1,698 in September so even after this bounce it's still around 46% under that. BTC was 80.5k on Nov 4.
For me a fast bounce off a flush tells you buyers were sitting there waiting. It only really counts if the low doesn't get revisited on the next red day, and with this market that test usually comes quick.
Right now ZEC is the one showing the stronger hands.
$ZEC took a worse hit. 801 last night, lowest since Sep 2, and now it's sitting near 918. Thats about 14.5% off the bottom in under a day, almost triple what BTC managed.
Zoom out though and neither chart is pretty. ZEC topped at 1,698 in September so even after this bounce it's still around 46% under that. BTC was 80.5k on Nov 4.
For me a fast bounce off a flush tells you buyers were sitting there waiting. It only really counts if the low doesn't get revisited on the next red day, and with this market that test usually comes quick.
Right now ZEC is the one showing the stronger hands.
39
Ver traducción
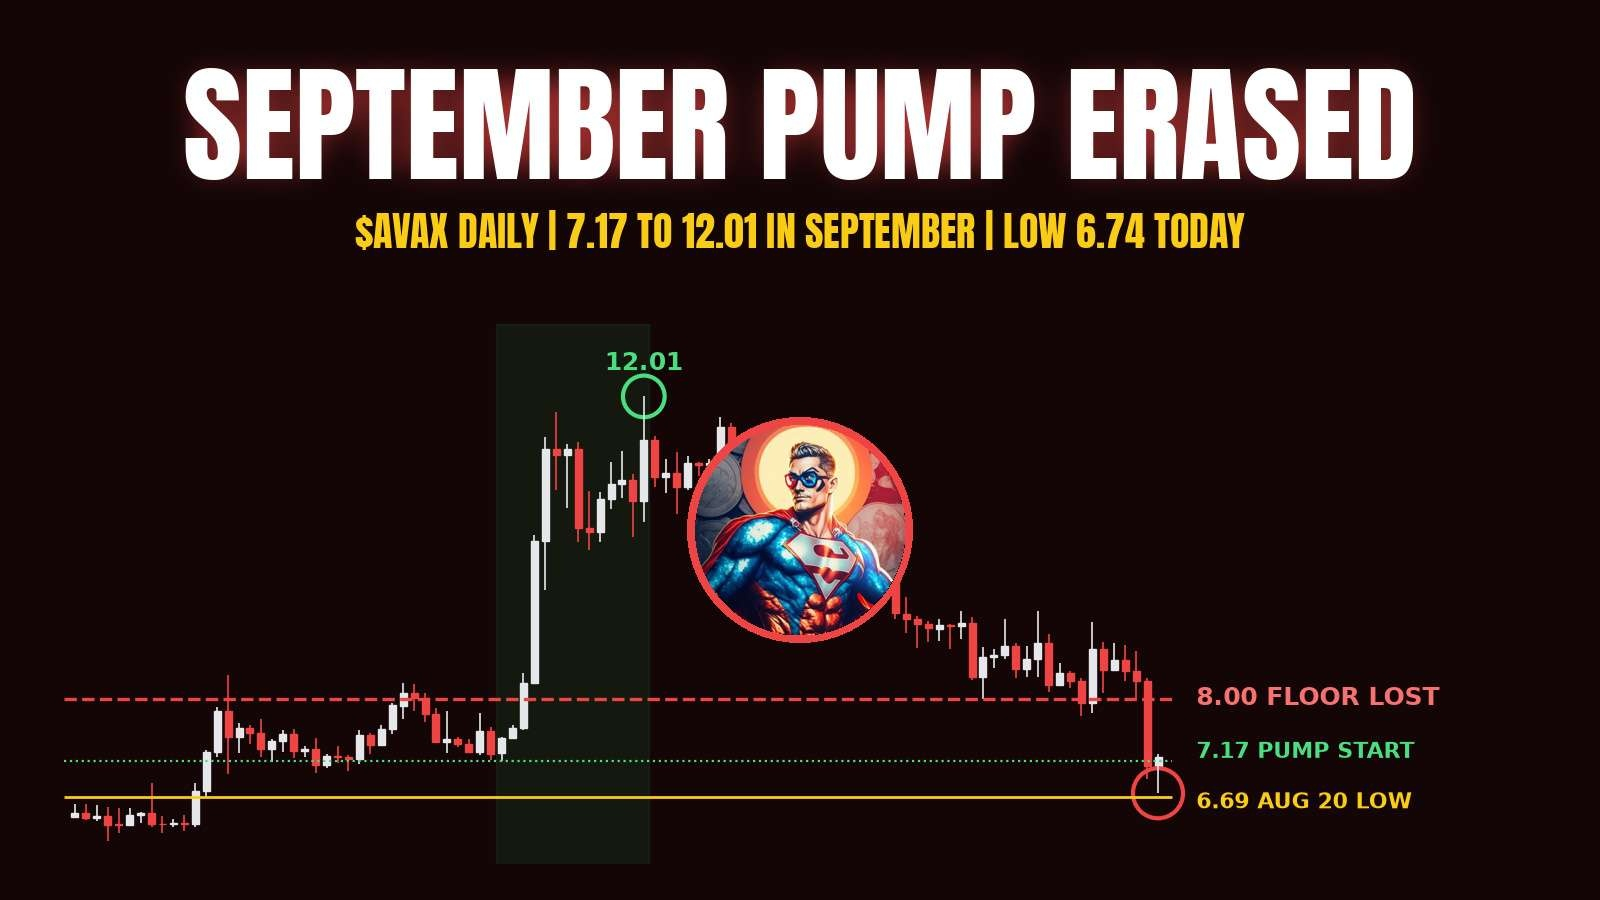
$AVAX went from 7.17 to 12.01 between Sep 16 and Sep 29. That whole run is gone now.
The 8.00 floor held twice, Oct 30 and Nov 13, both lows printed exactly 8.000. Yesterday it finally gave up, daily candle down almost 14% and closed 7.10 on the biggest volume since Nov 10.
Overnight it wicked to 6.74, lowest since Aug 20, and it's sitting around 7.21 now.
For me 6.69 is the line that matters, that's the August low. A daily close under it and there is not much support until the low 6s from the summer.
Upside, 8.00 is old support now. Until price is back above it every pop into 7.5 to 8 looks like a chance for trapped longs to get out.
$AVAX went from 7.17 to 12.01 between Sep 16 and Sep 29. That whole run is gone now.
The 8.00 floor held twice, Oct 30 and Nov 13, both lows printed exactly 8.000. Yesterday it finally gave up, daily candle down almost 14% and closed 7.10 on the biggest volume since Nov 10.
Overnight it wicked to 6.74, lowest since Aug 20, and it's sitting around 7.21 now.
For me 6.69 is the line that matters, that's the August low. A daily close under it and there is not much support until the low 6s from the summer.
Upside, 8.00 is old support now. Until price is back above it every pop into 7.5 to 8 looks like a chance for trapped longs to get out.
The 8.00 floor held twice, Oct 30 and Nov 13, both lows printed exactly 8.000. Yesterday it finally gave up, daily candle down almost 14% and closed 7.10 on the biggest volume since Nov 10.
Overnight it wicked to 6.74, lowest since Aug 20, and it's sitting around 7.21 now.
For me 6.69 is the line that matters, that's the August low. A daily close under it and there is not much support until the low 6s from the summer.
Upside, 8.00 is old support now. Until price is back above it every pop into 7.5 to 8 looks like a chance for trapped longs to get out.
62
Ver traducción
Dogecoin traded at 0.056 on Binance today. Lowest print since August 2023.
The 2021 top was 0.74. So $DOGE is sitting roughly 92% under that peak, five and a half years later.
Down about 12% in the last 24 hours alone, and 8 of the last 10 daily candles closed lower than the day before.
What gets me is how fast the 2024 run got erased. 0.48 in December 2024 felt like the start of something big, and now all of it is gone and then some.
Memes run on attention and they bleed when the attention moves somewhere else
Dogecoin traded at 0.056 on Binance today. Lowest print since August 2023.
The 2021 top was 0.74. So $DOGE is sitting roughly 92% under that peak, five and a half years later.
Down about 12% in the last 24 hours alone, and 8 of the last 10 daily candles closed lower than the day before.
What gets me is how fast the 2024 run got erased. 0.48 in December 2024 felt like the start of something big, and now all of it is gone and then some.
Memes run on attention and they bleed when the attention moves somewhere else
The 2021 top was 0.74. So $DOGE is sitting roughly 92% under that peak, five and a half years later.
Down about 12% in the last 24 hours alone, and 8 of the last 10 daily candles closed lower than the day before.
What gets me is how fast the 2024 run got erased. 0.48 in December 2024 felt like the start of something big, and now all of it is gone and then some.
Memes run on attention and they bleed when the attention moves somewhere else

70
Ver traducción
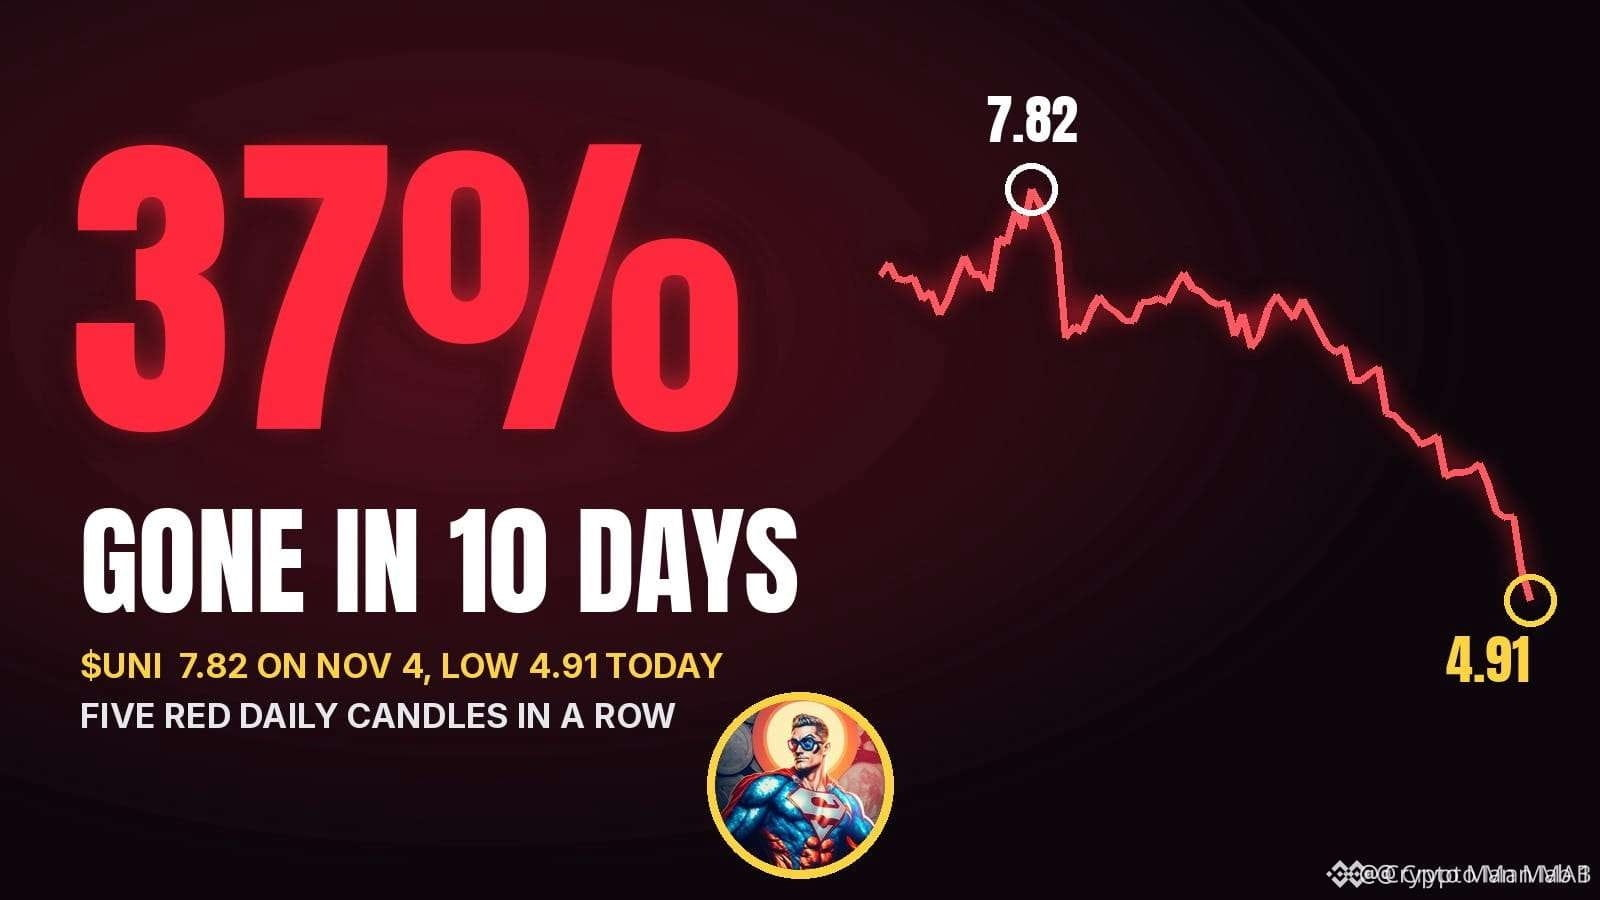
Five red daily candles in a row on $UNI and today's wick went all the way to 4.91.
Lowest it has traded since late August. Ten days ago it was tagging 7.82, so roughly 37% gone from that high.
What changed for me was Nov 11. The 6.25 area held twice in late October and that daily close at 6.23 finally broke it. No real bounce since then, just lower closes every day.
Next spot I'm watching is the late August low near 4.64. A daily close under that and the 4.3 area where it sat in late August comes back in play.
For sellers to look tired it needs to get back over 5.64, yesterday's low, and hold it. Until then the trend is the trend.
Five red daily candles in a row on $UNI and today's wick went all the way to 4.91.
Lowest it has traded since late August. Ten days ago it was tagging 7.82, so roughly 37% gone from that high.
What changed for me was Nov 11. The 6.25 area held twice in late October and that daily close at 6.23 finally broke it. No real bounce since then, just lower closes every day.
Next spot I'm watching is the late August low near 4.64. A daily close under that and the 4.3 area where it sat in late August comes back in play.
For sellers to look tired it needs to get back over 5.64, yesterday's low, and hold it. Until then the trend is the trend.
Lowest it has traded since late August. Ten days ago it was tagging 7.82, so roughly 37% gone from that high.
What changed for me was Nov 11. The 6.25 area held twice in late October and that daily close at 6.23 finally broke it. No real bounce since then, just lower closes every day.
Next spot I'm watching is the late August low near 4.64. A daily close under that and the 4.3 area where it sat in late August comes back in play.
For sellers to look tired it needs to get back over 5.64, yesterday's low, and hold it. Until then the trend is the trend.
27
Ver traducción
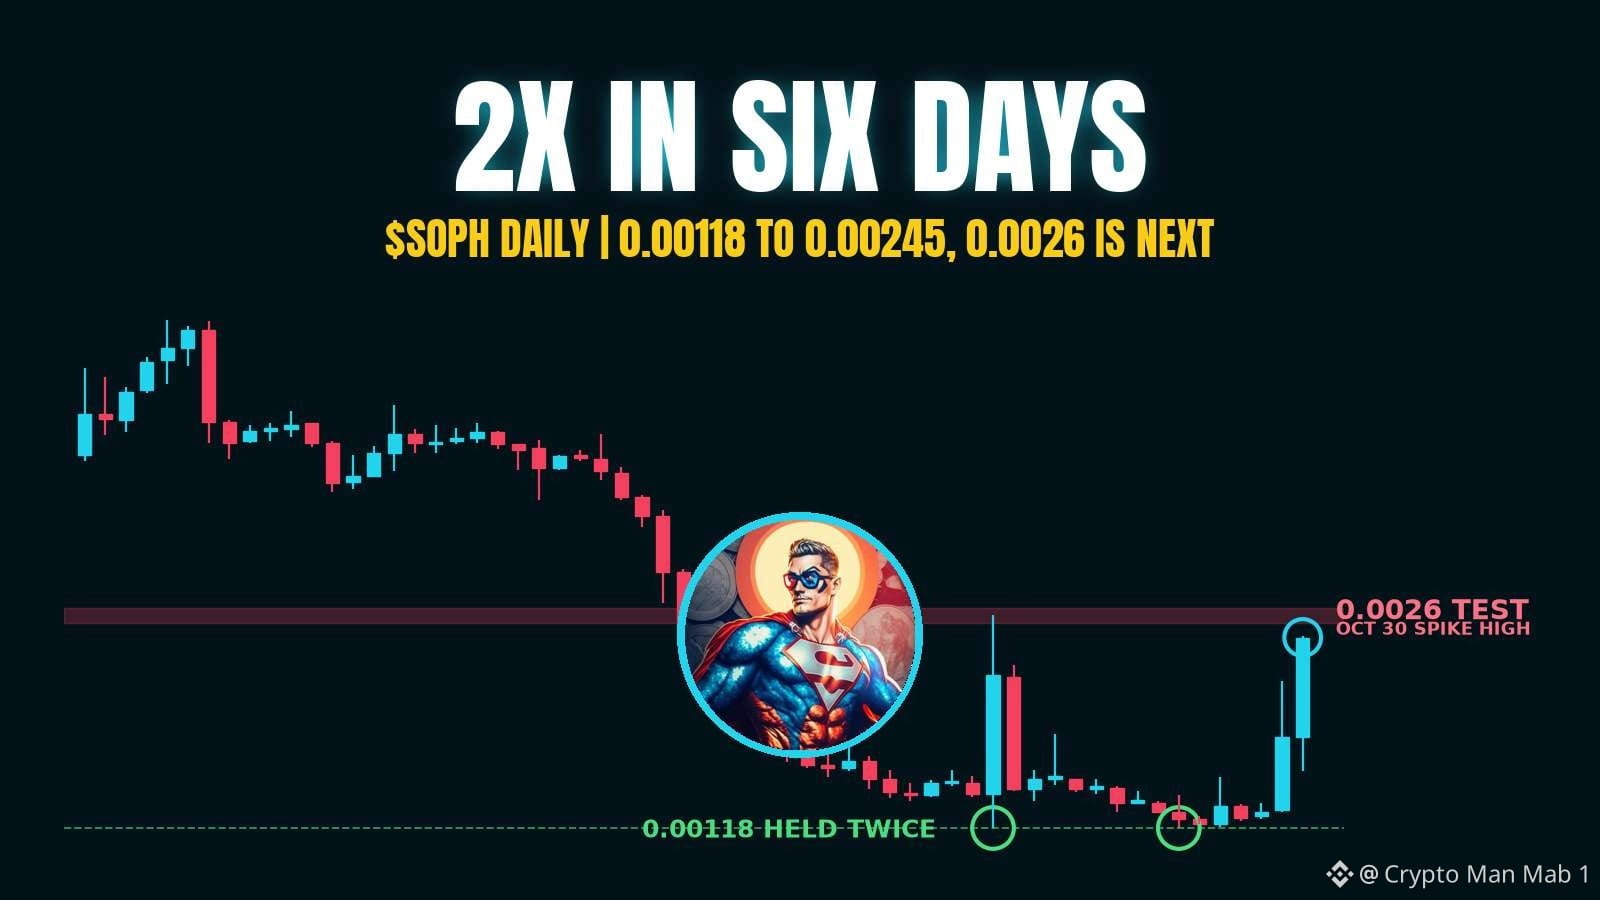
$SOPH sat at 0.00118 on Oct 30 and again on Nov 8. Same exact low, twice.
From there it went 0.00118 to 0.00245 in six days, more than double, with today's volume around 8.6M when most of early Nov was under 1M.
Thing is, 0.0026 is right overhead. Oct 30 also spiked to 0.0026 and gave the whole thing back the next day, closed at 0.00144.
So a daily close above 0.0026 is the real change for me, that opens the mid Oct area near 0.0029. Lose 0.00216 (yesterday's high) and this looks like the Oct 30 spike all over again.
$SOPH sat at 0.00118 on Oct 30 and again on Nov 8. Same exact low, twice.
From there it went 0.00118 to 0.00245 in six days, more than double, with today's volume around 8.6M when most of early Nov was under 1M.
Thing is, 0.0026 is right overhead. Oct 30 also spiked to 0.0026 and gave the whole thing back the next day, closed at 0.00144.
So a daily close above 0.0026 is the real change for me, that opens the mid Oct area near 0.0029. Lose 0.00216 (yesterday's high) and this looks like the Oct 30 spike all over again.
From there it went 0.00118 to 0.00245 in six days, more than double, with today's volume around 8.6M when most of early Nov was under 1M.
Thing is, 0.0026 is right overhead. Oct 30 also spiked to 0.0026 and gave the whole thing back the next day, closed at 0.00144.
So a daily close above 0.0026 is the real change for me, that opens the mid Oct area near 0.0029. Lose 0.00216 (yesterday's high) and this looks like the Oct 30 spike all over again.
39
Ver traducción
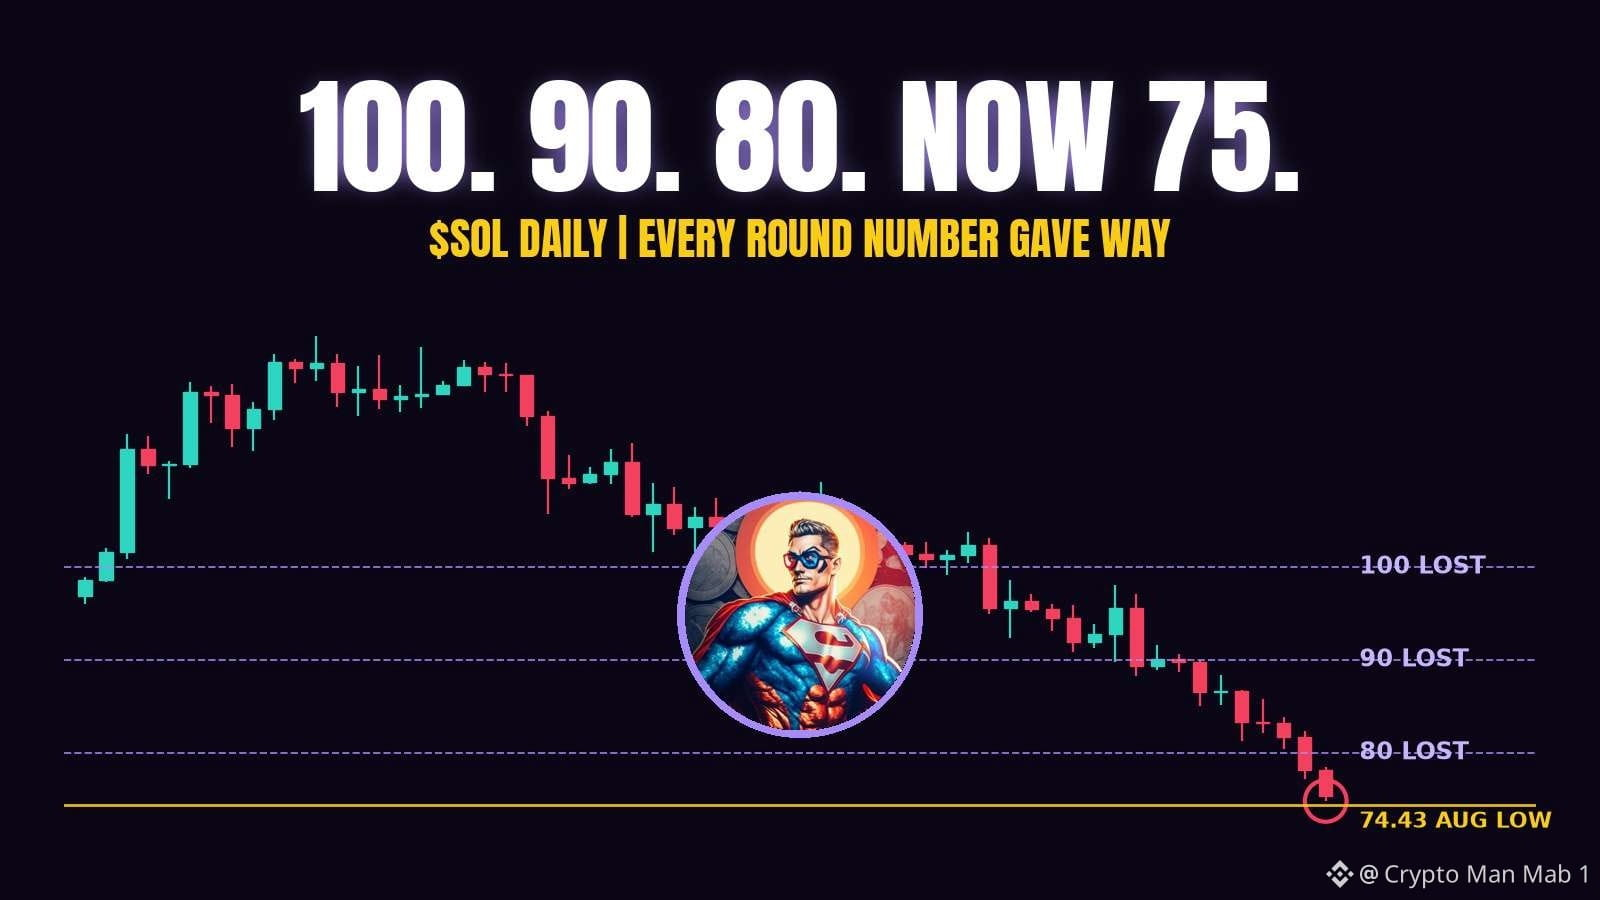
Watching $SOL lose round numbers one by one has been painful honestly.
100 went in late October, 90 on Nov 5, 80 yesterday. Today it tagged 74.85, lowest since August.
And the bounces keep getting smaller, every little pop got sold within a day or two.
For me the next real test is the August low at 74.43. A daily close under that and this leg is still going.
Flip side, a daily close back over 80 would be the first sign sellers are getting tired. Until then its just a downtrend doing downtrend things.
Watching $SOL lose round numbers one by one has been painful honestly.
100 went in late October, 90 on Nov 5, 80 yesterday. Today it tagged 74.85, lowest since August.
And the bounces keep getting smaller, every little pop got sold within a day or two.
For me the next real test is the August low at 74.43. A daily close under that and this leg is still going.
Flip side, a daily close back over 80 would be the first sign sellers are getting tired. Until then its just a downtrend doing downtrend things.
100 went in late October, 90 on Nov 5, 80 yesterday. Today it tagged 74.85, lowest since August.
And the bounces keep getting smaller, every little pop got sold within a day or two.
For me the next real test is the August low at 74.43. A daily close under that and this leg is still going.
Flip side, a daily close back over 80 would be the first sign sellers are getting tired. Until then its just a downtrend doing downtrend things.
48
Ver traducción
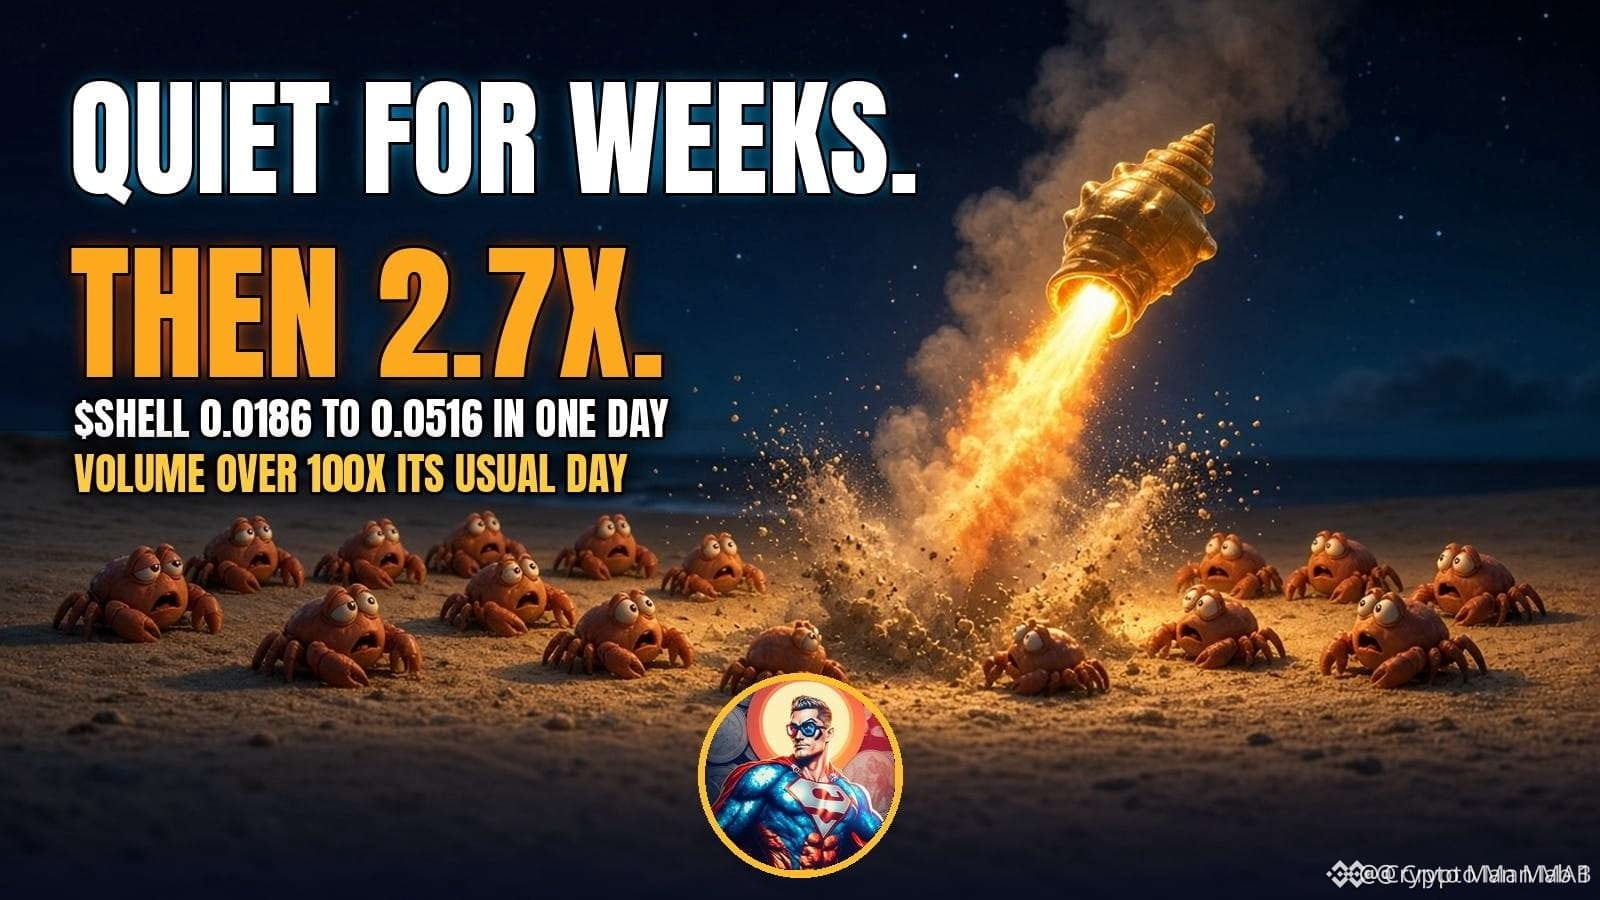
$SHELL did basically nothing for weeks. Daily volume on Binance sat around 75k to 110k USDT most of November and price just drifted near 0.019 to 0.020.
Then yesterday it ran from a 0.0186 low to 0.0516, about 2.7x, on 22M volume. That is more than 100 times a normal day for this coin, and most of it happened in around 6 hours after 15:00 UTC.
Now it's back near 0.0416, roughly 19% off the top. When a sleepy coin wakes up like this, the first pullback tells you more than the pump did.
$SHELL did basically nothing for weeks. Daily volume on Binance sat around 75k to 110k USDT most of November and price just drifted near 0.019 to 0.020.
Then yesterday it ran from a 0.0186 low to 0.0516, about 2.7x, on 22M volume. That is more than 100 times a normal day for this coin, and most of it happened in around 6 hours after 15:00 UTC.
Now it's back near 0.0416, roughly 19% off the top. When a sleepy coin wakes up like this, the first pullback tells you more than the pump did.
Then yesterday it ran from a 0.0186 low to 0.0516, about 2.7x, on 22M volume. That is more than 100 times a normal day for this coin, and most of it happened in around 6 hours after 15:00 UTC.
Now it's back near 0.0416, roughly 19% off the top. When a sleepy coin wakes up like this, the first pullback tells you more than the pump did.
78
Ver traducción
$XRP printed 0.9975 around 03:00 UTC today. First trade under 1.00 since August 19.
It lasted one hourly candle. That hour closed back at 1.006 and now it's sitting near 1.02, basically flat on the day while $BTC is down 4%.
This is what a sweep of a round number usually looks like. Loads of stops sit just under 1.00, price dips a few ticks, takes them out, and bigger buyers fill right there. The wick under the level doesn't mean much by itself.
The close is what counts. Back in August it chopped around 1.00 for almost a week, with a couple of daily closes under it, before it finally pushed to 1.10. So one quick wick is a decent sign, not a done deal.
$XRP printed 0.9975 around 03:00 UTC today. First trade under 1.00 since August 19.
It lasted one hourly candle. That hour closed back at 1.006 and now it's sitting near 1.02, basically flat on the day while $BTC is down 4%.
This is what a sweep of a round number usually looks like. Loads of stops sit just under 1.00, price dips a few ticks, takes them out, and bigger buyers fill right there. The wick under the level doesn't mean much by itself.
The close is what counts. Back in August it chopped around 1.00 for almost a week, with a couple of daily closes under it, before it finally pushed to 1.10. So one quick wick is a decent sign, not a done deal.
It lasted one hourly candle. That hour closed back at 1.006 and now it's sitting near 1.02, basically flat on the day while $BTC is down 4%.
This is what a sweep of a round number usually looks like. Loads of stops sit just under 1.00, price dips a few ticks, takes them out, and bigger buyers fill right there. The wick under the level doesn't mean much by itself.
The close is what counts. Back in August it chopped around 1.00 for almost a week, with a couple of daily closes under it, before it finally pushed to 1.10. So one quick wick is a decent sign, not a done deal.

Ver traducción
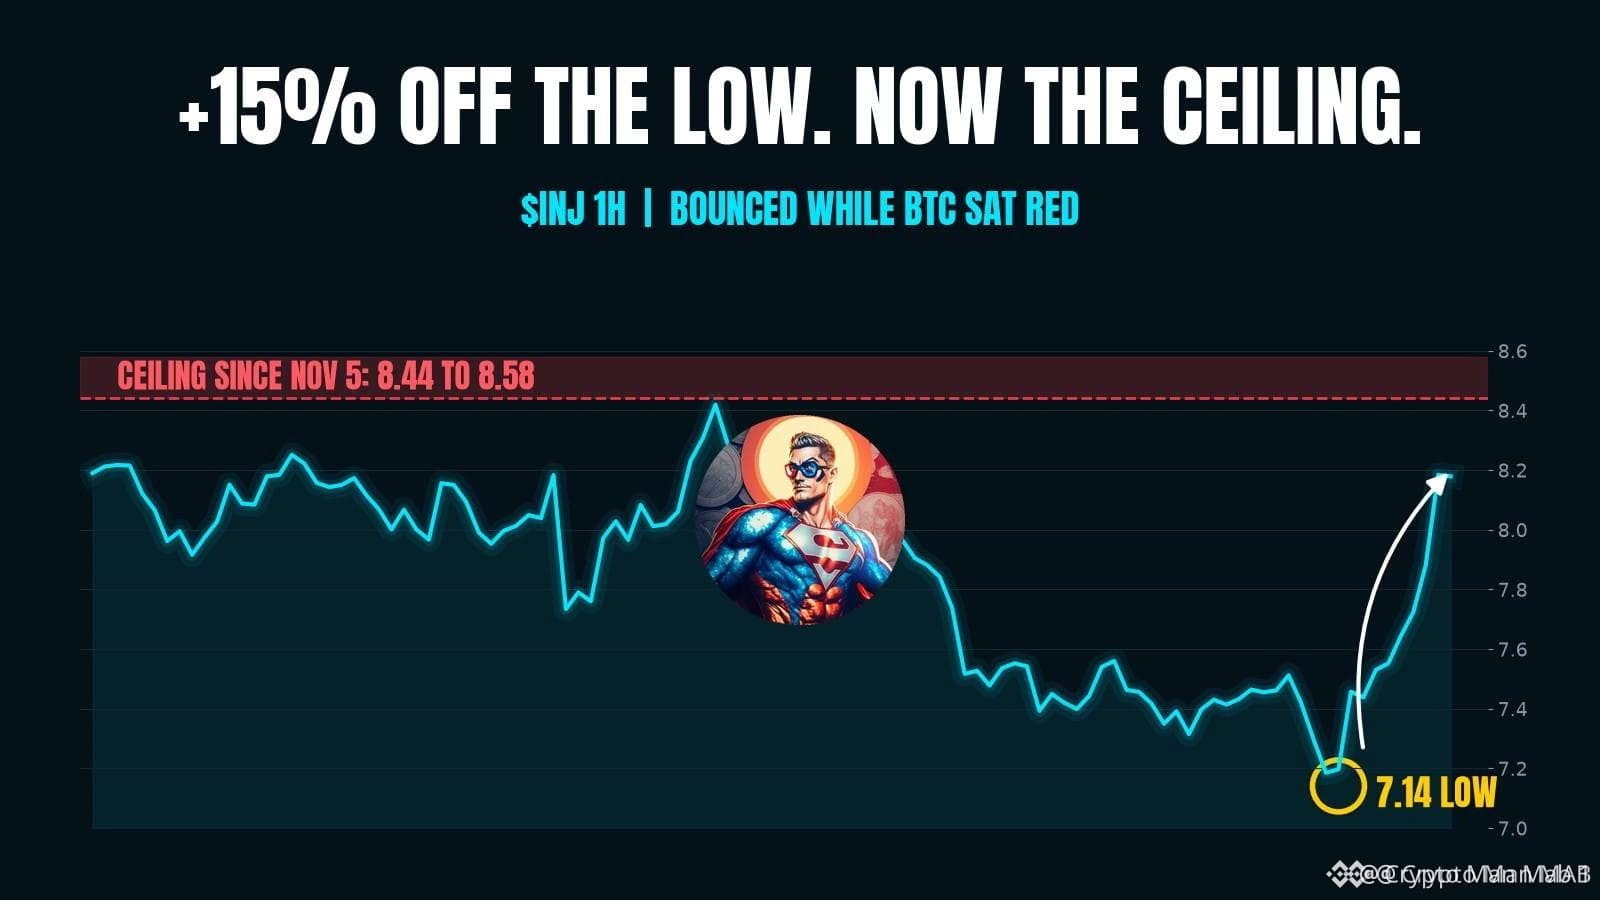
$INJ went from 7.14 this morning to around 8.18 now, about 15% off the low. And this on a day $BTC is still down near 4%.
Nice bounce but honestly the easy part is done. 8.44 to 8.58 has capped every push since Nov 5, sellers showed up there four times already.
For me it only gets interesting on a daily close over 8.58, then the October highs near 9.4 come back in view. If it gets rejected again and slips under 7.7, this was just a relief bounce and 7.14 is the line it has to hold.
$INJ went from 7.14 this morning to around 8.18 now, about 15% off the low. And this on a day $BTC is still down near 4%.
Nice bounce but honestly the easy part is done. 8.44 to 8.58 has capped every push since Nov 5, sellers showed up there four times already.
For me it only gets interesting on a daily close over 8.58, then the October highs near 9.4 come back in view. If it gets rejected again and slips under 7.7, this was just a relief bounce and 7.14 is the line it has to hold.
Nice bounce but honestly the easy part is done. 8.44 to 8.58 has capped every push since Nov 5, sellers showed up there four times already.
For me it only gets interesting on a daily close over 8.58, then the October highs near 9.4 come back in view. If it gets rejected again and slips under 7.7, this was just a relief bounce and 7.14 is the line it has to hold.
Ver traducción
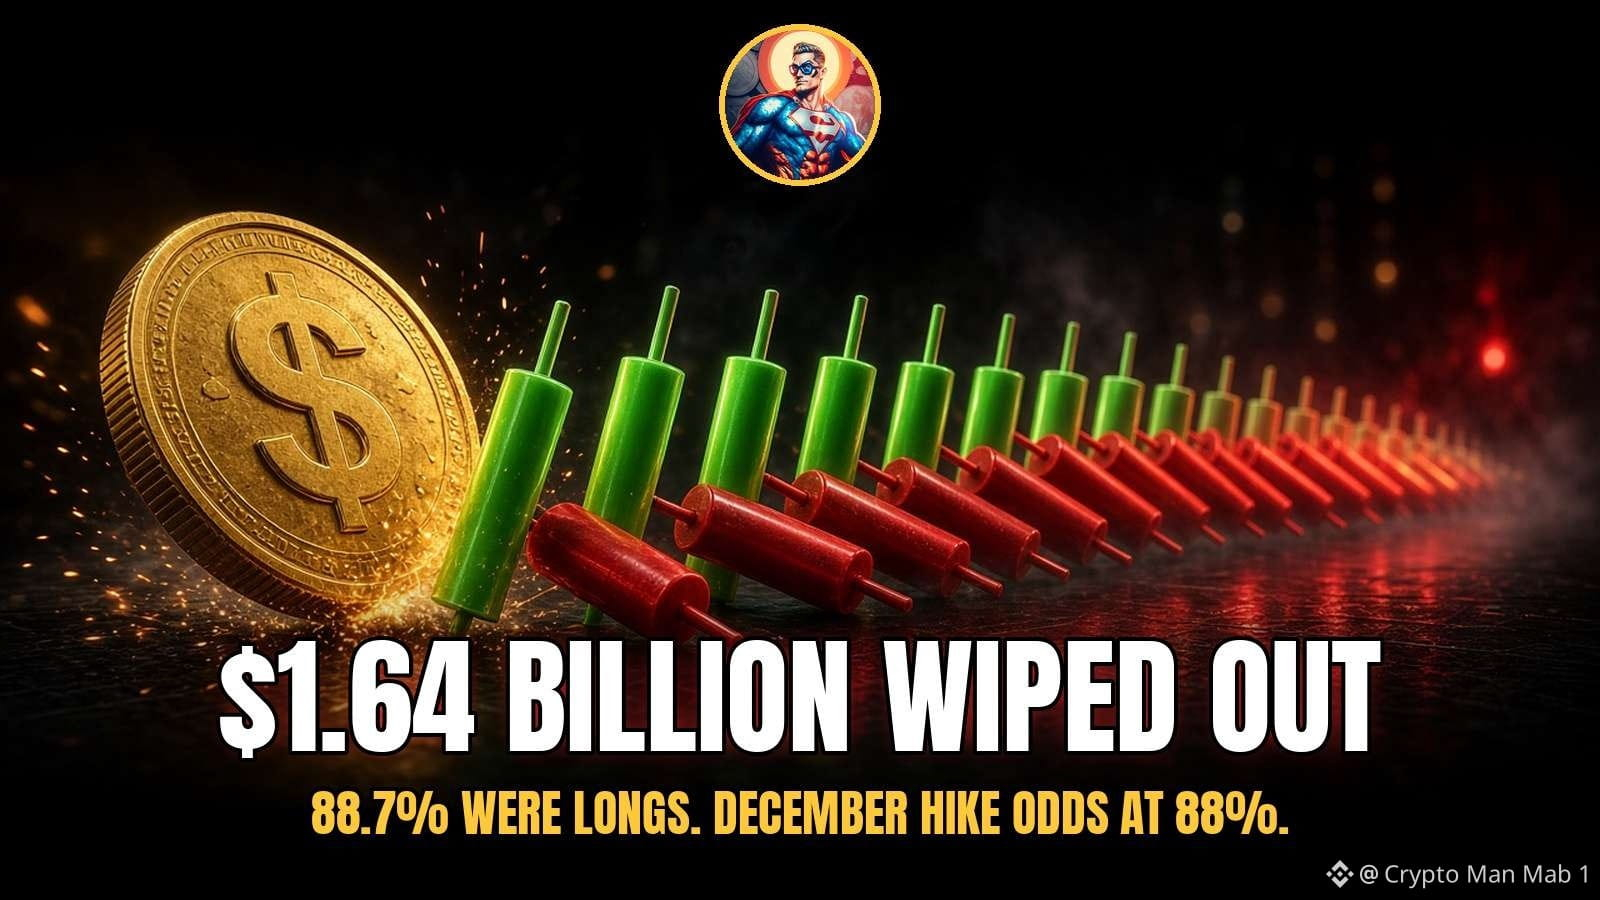
$1.64 billion in leveraged positions got liquidated in the last 24 hours, going by CoinGlass data reported by CoinDesk. Almost 89% of it was longs, about $916M on $BTC alone and $289M on $ETH.
The push came from macro. US inflation printed hotter than expected and CME FedWatch now shows around 88% odds of a rate hike in December. Dollar index went above 103, highest since April 2025, and the US 10 year yield is sitting over 5.1%.
Glassnode also says average BTC funding turned negative for the first time in a month, so shorts are the ones paying now.
Honestly this feels like a rates story more than a crypto story today.
$1.64 billion in leveraged positions got liquidated in the last 24 hours, going by CoinGlass data reported by CoinDesk. Almost 89% of it was longs, about $916M on $BTC alone and $289M on $ETH.
The push came from macro. US inflation printed hotter than expected and CME FedWatch now shows around 88% odds of a rate hike in December. Dollar index went above 103, highest since April 2025, and the US 10 year yield is sitting over 5.1%.
Glassnode also says average BTC funding turned negative for the first time in a month, so shorts are the ones paying now.
Honestly this feels like a rates story more than a crypto story today.
The push came from macro. US inflation printed hotter than expected and CME FedWatch now shows around 88% odds of a rate hike in December. Dollar index went above 103, highest since April 2025, and the US 10 year yield is sitting over 5.1%.
Glassnode also says average BTC funding turned negative for the first time in a month, so shorts are the ones paying now.
Honestly this feels like a rates story more than a crypto story today.
Ver traducción
This day five years ago $DOGE closed at 0.261.
Today it's sitting around 0.065. That's under where it was on this same date in 2022 and 2023 too, and those were supposed to be the bad years.
The low today was 0.0630, the lowest price since October 2023. Five years later and it's about a quarter of what it was.
Memes run hard both ways.
This day five years ago $DOGE closed at 0.261.
Today it's sitting around 0.065. That's under where it was on this same date in 2022 and 2023 too, and those were supposed to be the bad years.
The low today was 0.0630, the lowest price since October 2023. Five years later and it's about a quarter of what it was.
Memes run hard both ways.
Today it's sitting around 0.065. That's under where it was on this same date in 2022 and 2023 too, and those were supposed to be the bad years.
The low today was 0.0630, the lowest price since October 2023. Five years later and it's about a quarter of what it was.
Memes run hard both ways.

23
Ver traducción
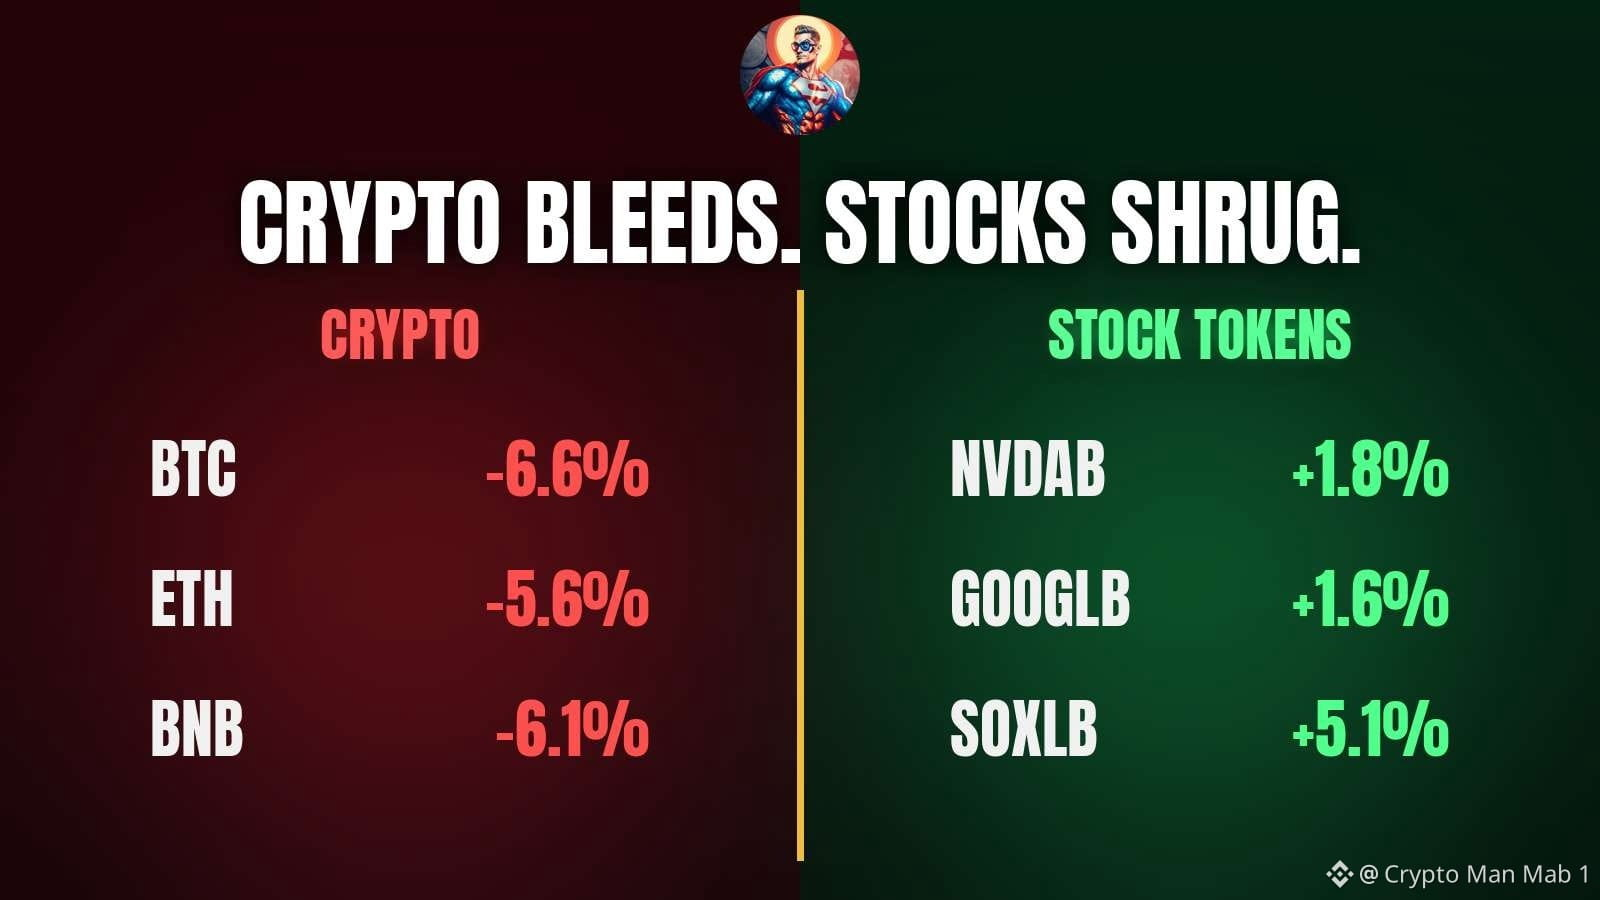
Crypto is getting hit everywhere. $BTC is down 6.5% and sitting under 69k, and $ETH finally let go of 2,000, trading around 1,935 now.
Then you open the stock tokens and it's a different world. $NVDAB is green, the Google token is green, and the 3x chip ETF token is up 5%.
The only stock token bleeding with crypto is MSTR, which makes sense since it basically trades like a BTC proxy.
Money hasn't run from risk completely. It's just stepping away from crypto for now.
Crypto is getting hit everywhere. $BTC is down 6.5% and sitting under 69k, and $ETH finally let go of 2,000, trading around 1,935 now.
Then you open the stock tokens and it's a different world. $NVDAB is green, the Google token is green, and the 3x chip ETF token is up 5%.
The only stock token bleeding with crypto is MSTR, which makes sense since it basically trades like a BTC proxy.
Money hasn't run from risk completely. It's just stepping away from crypto for now.
Then you open the stock tokens and it's a different world. $NVDAB is green, the Google token is green, and the 3x chip ETF token is up 5%.
The only stock token bleeding with crypto is MSTR, which makes sense since it basically trades like a BTC proxy.
Money hasn't run from risk completely. It's just stepping away from crypto for now.
31
Ver traducción
$BTC lost 70k overnight and honestly it didn't even put up a fight.
Slipped under around 02:00 UTC, then the 03:00 UTC hourly did close to 300M volume on Binance alone and dumped to 68.5k. Low so far 68,307, lowest print since August 19.
Every bounce this month got sold from a lower spot. 81.2k on Nov 4, 75.6k on Nov 9, 74.8k on Nov 11.
For me 70k is the line now. Daily close back over it and this starts looking like a flush that caught late sellers. Stay under and the August low near 64,166 is the next big reference on the chart.
Still about 44% off the 122.5k top from last October.
$BTC lost 70k overnight and honestly it didn't even put up a fight.
Slipped under around 02:00 UTC, then the 03:00 UTC hourly did close to 300M volume on Binance alone and dumped to 68.5k. Low so far 68,307, lowest print since August 19.
Every bounce this month got sold from a lower spot. 81.2k on Nov 4, 75.6k on Nov 9, 74.8k on Nov 11.
For me 70k is the line now. Daily close back over it and this starts looking like a flush that caught late sellers. Stay under and the August low near 64,166 is the next big reference on the chart.
Still about 44% off the 122.5k top from last October.
Slipped under around 02:00 UTC, then the 03:00 UTC hourly did close to 300M volume on Binance alone and dumped to 68.5k. Low so far 68,307, lowest print since August 19.
Every bounce this month got sold from a lower spot. 81.2k on Nov 4, 75.6k on Nov 9, 74.8k on Nov 11.
For me 70k is the line now. Daily close back over it and this starts looking like a flush that caught late sellers. Stay under and the August low near 64,166 is the next big reference on the chart.
Still about 44% off the 122.5k top from last October.

39
Ver traducción
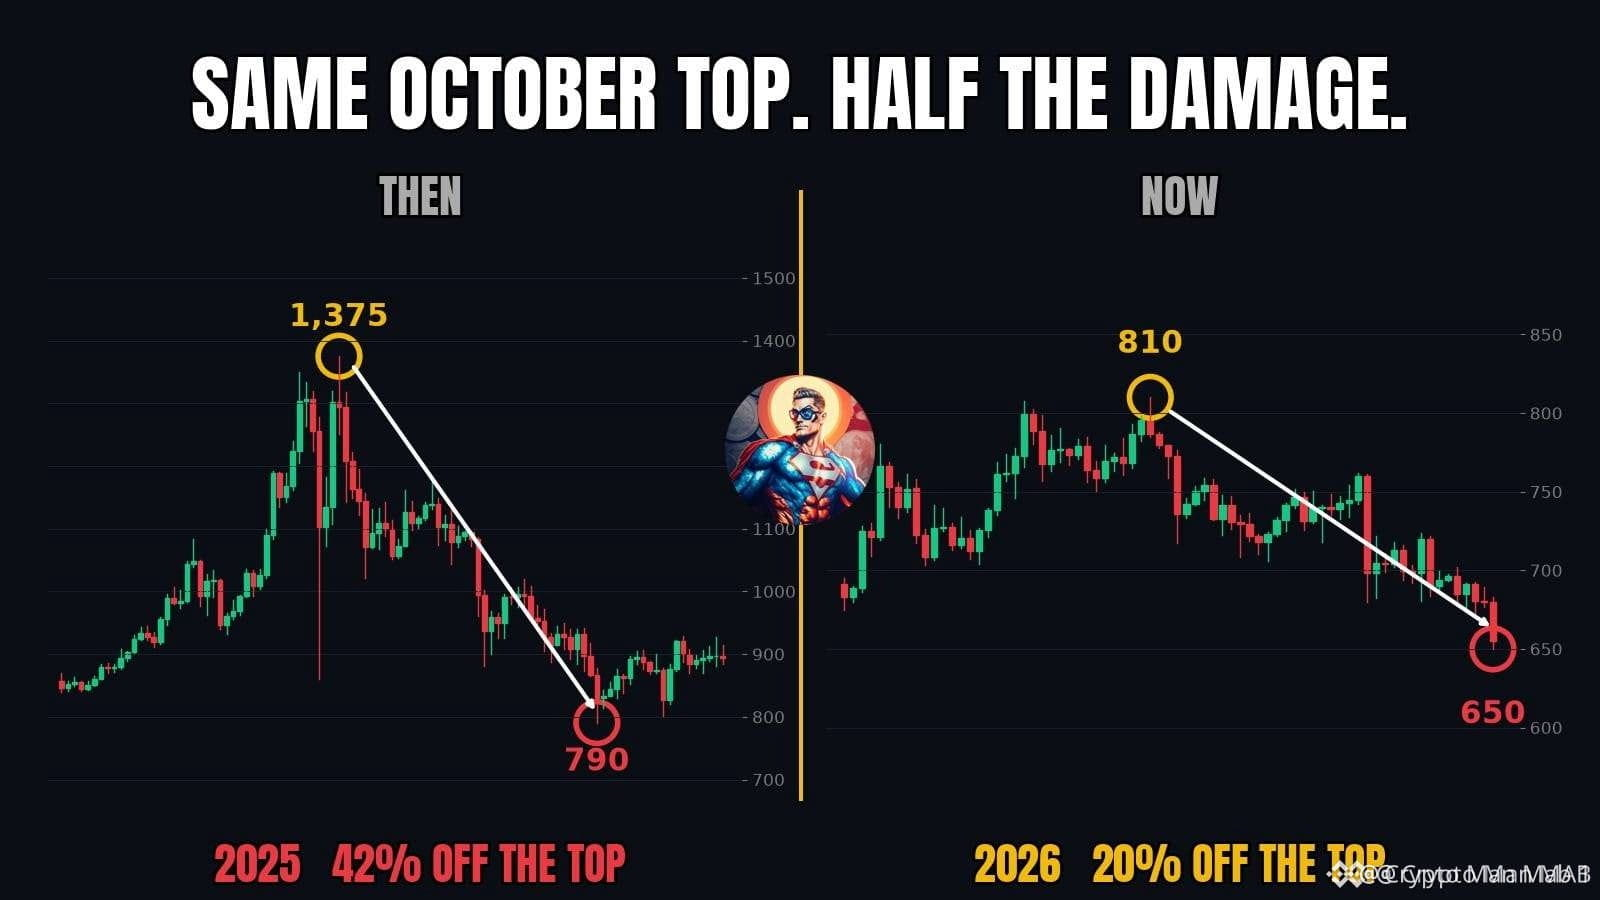
$BNB topped in October last year at 1,375. About five weeks later it was sitting at 790, roughly 42% lower.
This October it topped at 810. Five weeks later, today, it tagged 650. Around 20% off.
Same calendar, same slow bleed, less than half the damage so far. Last time the real flush only came in February, down near 570. Doesn't have to play out the same, but the shape is hard to ignore.
$BNB topped in October last year at 1,375. About five weeks later it was sitting at 790, roughly 42% lower.
This October it topped at 810. Five weeks later, today, it tagged 650. Around 20% off.
Same calendar, same slow bleed, less than half the damage so far. Last time the real flush only came in February, down near 570. Doesn't have to play out the same, but the shape is hard to ignore.
This October it topped at 810. Five weeks later, today, it tagged 650. Around 20% off.
Same calendar, same slow bleed, less than half the damage so far. Last time the real flush only came in February, down near 570. Doesn't have to play out the same, but the shape is hard to ignore.
70
Ver traducción
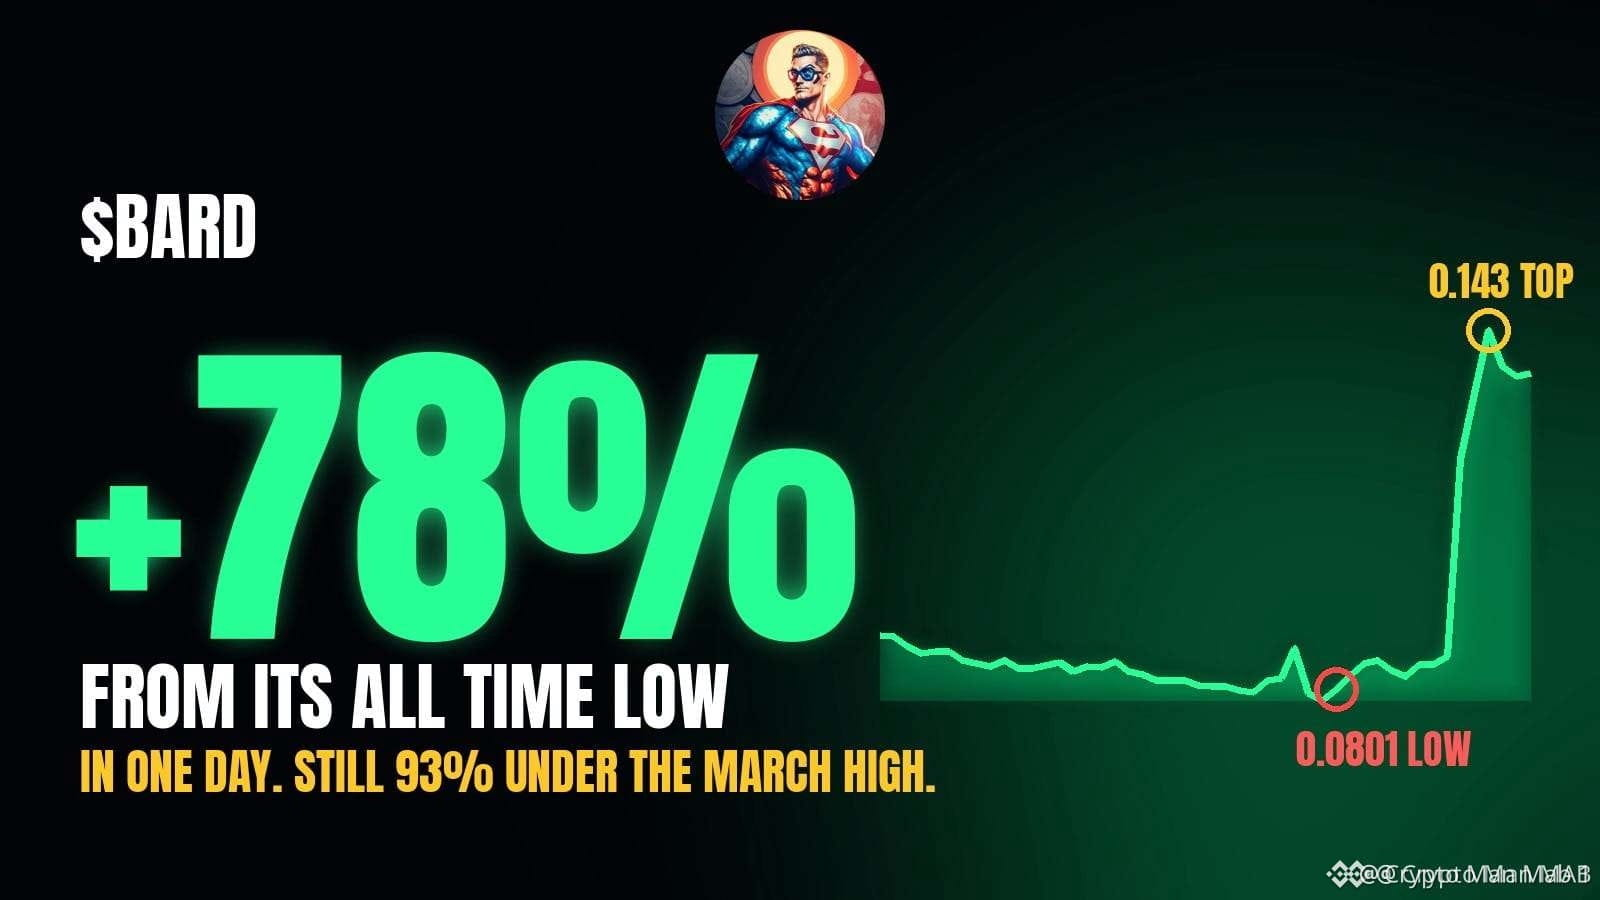
$BARD made a brand new all time low at 0.0801 earlier today. A few hours later it was trading at 0.143.
That's about 78% off the bottom in one session. Volume did around 10M on the day, while the previous seven days did roughly 2.4M combined.
Still sitting near 0.128 now, which is about 93% under the 1.73 high from March. So the bounce is loud, but the bigger picture is a coin that bled for eight months straight.
A spike off a dead low means a lot more if it can hold for a few days instead of a few hours.
$BARD made a brand new all time low at 0.0801 earlier today. A few hours later it was trading at 0.143.
That's about 78% off the bottom in one session. Volume did around 10M on the day, while the previous seven days did roughly 2.4M combined.
Still sitting near 0.128 now, which is about 93% under the 1.73 high from March. So the bounce is loud, but the bigger picture is a coin that bled for eight months straight.
A spike off a dead low means a lot more if it can hold for a few days instead of a few hours.
That's about 78% off the bottom in one session. Volume did around 10M on the day, while the previous seven days did roughly 2.4M combined.
Still sitting near 0.128 now, which is about 93% under the 1.73 high from March. So the bounce is loud, but the bigger picture is a coin that bled for eight months straight.
A spike off a dead low means a lot more if it can hold for a few days instead of a few hours.
80
Ver traducción
$SOL just printed another lower low. 80.46 today, under the 81.34 from Tuesday.
Same story since early October honestly. 121 on Oct 4, then 105, then 95, then 88, now low 80s. Every bounce gets sold a little lower than the one before.
Yesterday's push to 85.85 was the latest one and it lasted about a day.
For me nothing changes until a daily close back over 86. Lose 80 on a daily close and the round 75 area is where my eyes go next. Not trying to catch this one until then.
$SOL just printed another lower low. 80.46 today, under the 81.34 from Tuesday.
Same story since early October honestly. 121 on Oct 4, then 105, then 95, then 88, now low 80s. Every bounce gets sold a little lower than the one before.
Yesterday's push to 85.85 was the latest one and it lasted about a day.
For me nothing changes until a daily close back over 86. Lose 80 on a daily close and the round 75 area is where my eyes go next. Not trying to catch this one until then.
Same story since early October honestly. 121 on Oct 4, then 105, then 95, then 88, now low 80s. Every bounce gets sold a little lower than the one before.
Yesterday's push to 85.85 was the latest one and it lasted about a day.
For me nothing changes until a daily close back over 86. Lose 80 on a daily close and the round 75 area is where my eyes go next. Not trying to catch this one until then.

41
Inicia sesión para explorar más contenidos
Únete a usuarios de criptomonedas de todo el mundo en Binance Square
⚡️ Obtén la información más reciente y útil sobre criptomonedas.
💬 Confía en el mayor exchange de criptomonedas del mundo.
👍 Descubre opiniones reales de creadores verificados.
Correo electrónico/número de teléfono
Temas en tendencia
A Packed Week of Earnings and Data Tests Markets
544 visualizaciones
32 participa(n) en el debate
Los resultados de Nvidia, las actas de la Fed y la OPV de Anthropic pondrán a prueba las acciones de IA y las criptomonedas
Binance News
·137 «Me gusta»
·12.3k visualizaciones
HuangReportedlyConsidersReturnToNvidia
7,852 visualizaciones
154 participa(n) en el debate
CryptoSelloffTriggersMultipleWhaleLiquidations
256,464 visualizaciones
2,182 participa(n) en el debate