
Huutruong
10.5k Publicaciones

Huutruong
Denunciar
Bloquear usuario
💰 Theo dõi Crypto | Tìm kiếm cơ hội mỗi ngày ( KITE-277880 )
Abrir trade
Traders de alta frecuencia
5.5 año(s)
3.6K+ Siguiendo
2.4K+ Seguidores
847 Me gusta
Publicaciones
Cartera
Todo
Citas
Videos
Live
·
--
Alcista
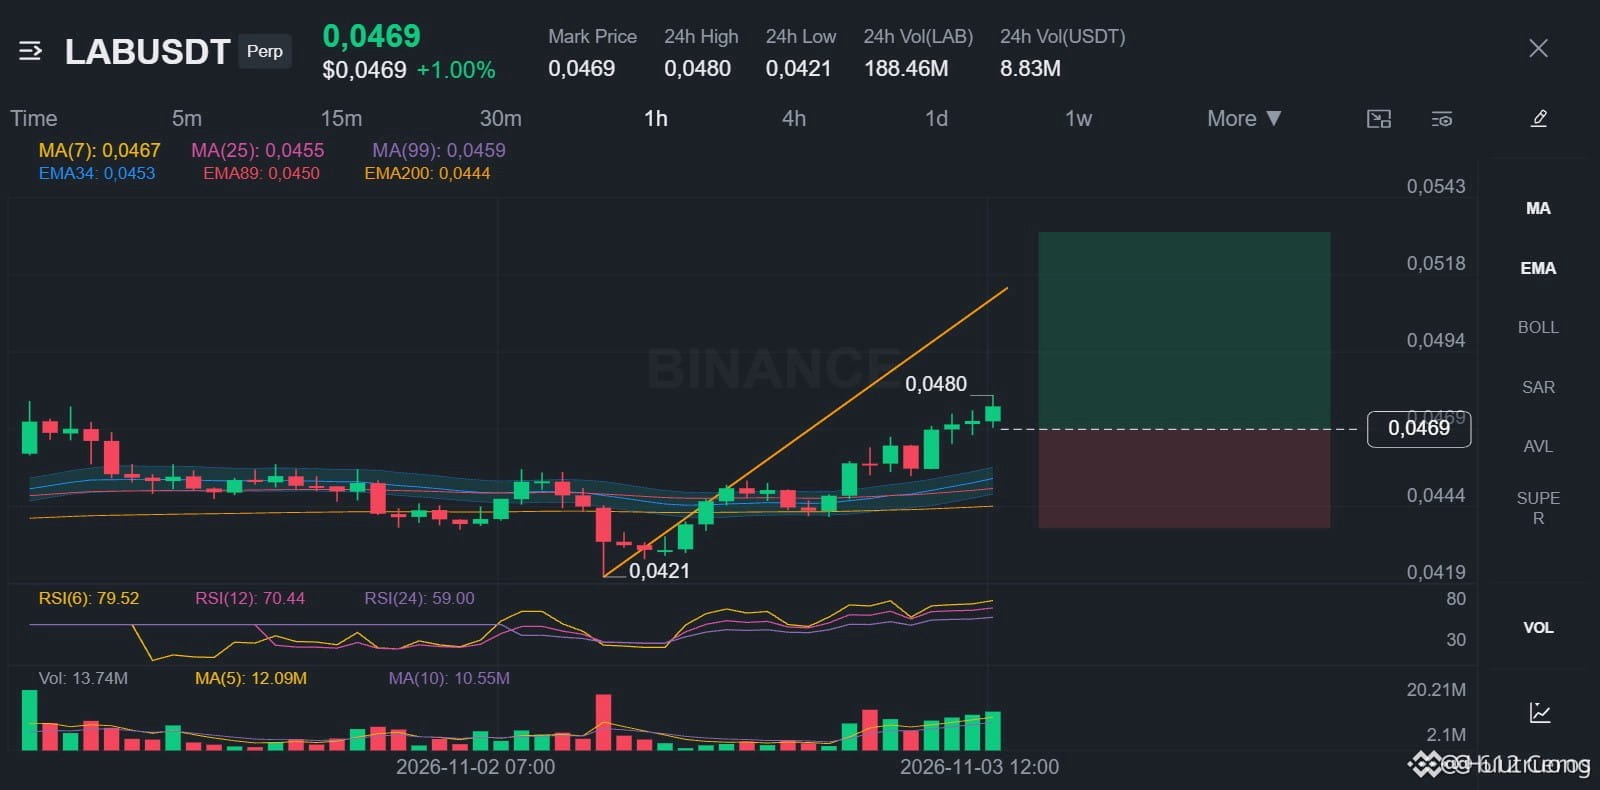
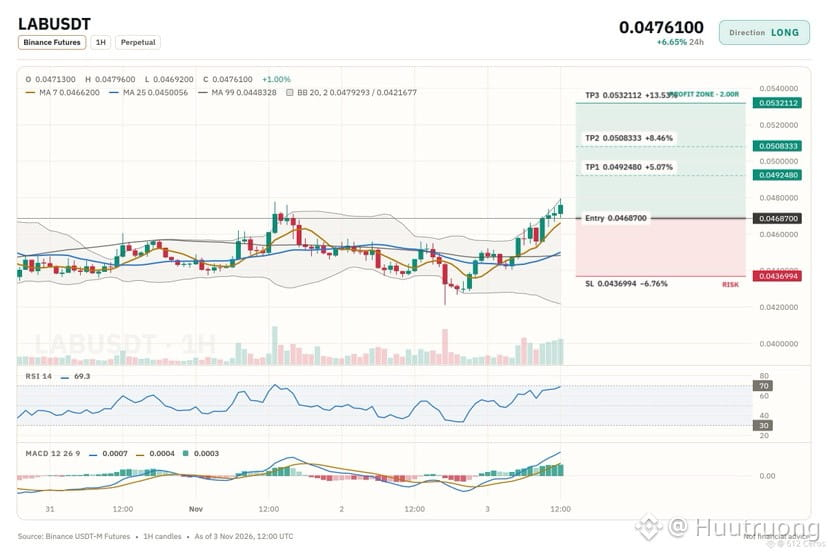
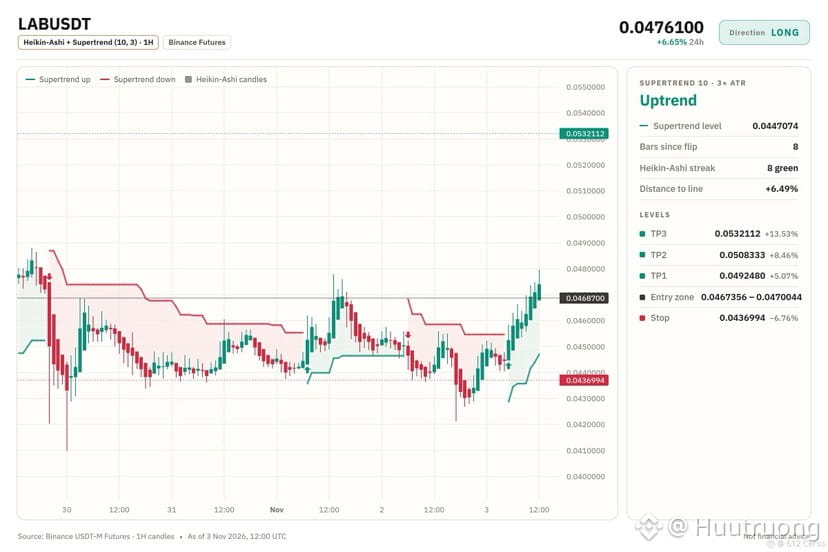
Largo contracorriente en LAB: pequeña ventaja, riesgo real
🟢 LARGO $LAB /USDT: se espera que el precio SUBA
Sesgo: LARGO · Tendencia
Entrada: 0.0467356 – 0.0470044
Objetivo 1: 0.0492480 (+5.1%)
Objetivo 2: 0.0508333 (+8.5%)
Objetivo 3: 0.0532112 (+13.5%)
Stop loss: 0.0436994 (-6.8%)
Plan: entrar solo dentro de la zona, cerrar el 50% en el objetivo 1, el 25% en el objetivo 2, el 25% en el objetivo 3 y mover el stop al precio de entrada después del objetivo 1.
Precaución: idea contracorriente respaldada por solo 5 señales. Tamaño menor, stop estricto.
¿Por qué LARGO? 5/12 señales están de acuerdo, 1 en contra.
• Tendencia alcista en 1h (por encima de EMA50 y EMA200)
• Los compradores impulsan el movimiento (ADX de 15m: 45.8)
• Los compradores tienen el impulso (RSI de 4h: 58.7)
Riesgo: tendencia diaria bajista (por debajo de EMA50 y EMA200)
Nota de operación: LAB
Estoy observando LAB para una posición larga contracorriente. La tendencia diaria es bajista, así que esta es una apuesta por un giro en contra de un marco temporal mayor, lo que la hace más arriesgada que una operación a favor de la tendencia. Quiero ver que el precio en 1h se mantenga por encima del conjunto de EMA50 y EMA200, y respetaré el stop en 0.0468700 si lo rompe. La configuración se inclina hacia una posición larga con convicción moderada, porque solo 5 de 12 señales están de acuerdo, así que reduciré el tamaño de la posición.
¿Cuál es tu nivel de invalidación para esta posición larga?
{future}(LABUSDT)
Largo contracorriente en LAB: pequeña ventaja, riesgo real
🟢 LARGO $LAB /USDT: se espera que el precio SUBA
Sesgo: LARGO · Tendencia
Entrada: 0.0467356 – 0.0470044
Objetivo 1: 0.0492480 (+5.1%)
Objetivo 2: 0.0508333 (+8.5%)
Objetivo 3: 0.0532112 (+13.5%)
Stop loss: 0.0436994 (-6.8%)
Plan: entrar solo dentro de la zona, cerrar el 50% en el objetivo 1, el 25% en el objetivo 2, el 25% en el objetivo 3 y mover el stop al precio de entrada después del objetivo 1.
Precaución: idea contracorriente respaldada por solo 5 señales. Tamaño menor, stop estricto.
¿Por qué LARGO? 5/12 señales están de acuerdo, 1 en contra.
• Tendencia alcista en 1h (por encima de EMA50 y EMA200)
• Los compradores impulsan el movimiento (ADX de 15m: 45.8)
• Los compradores tienen el impulso (RSI de 4h: 58.7)
Riesgo: tendencia diaria bajista (por debajo de EMA50 y EMA200)
Nota de operación: LAB
Estoy observando LAB para una posición larga contracorriente. La tendencia diaria es bajista, así que esta es una apuesta por un giro en contra de un marco temporal mayor, lo que la hace más arriesgada que una operación a favor de la tendencia. Quiero ver que el precio en 1h se mantenga por encima del conjunto de EMA50 y EMA200, y respetaré el stop en 0.0468700 si lo rompe. La configuración se inclina hacia una posición larga con convicción moderada, porque solo 5 de 12 señales están de acuerdo, así que reduciré el tamaño de la posición.
¿Cuál es tu nivel de invalidación para esta posición larga?
🟢 LARGO $LAB /USDT: se espera que el precio SUBA
Sesgo: LARGO · Tendencia
Entrada: 0.0467356 – 0.0470044
Objetivo 1: 0.0492480 (+5.1%)
Objetivo 2: 0.0508333 (+8.5%)
Objetivo 3: 0.0532112 (+13.5%)
Stop loss: 0.0436994 (-6.8%)
Plan: entrar solo dentro de la zona, cerrar el 50% en el objetivo 1, el 25% en el objetivo 2, el 25% en el objetivo 3 y mover el stop al precio de entrada después del objetivo 1.
Precaución: idea contracorriente respaldada por solo 5 señales. Tamaño menor, stop estricto.
¿Por qué LARGO? 5/12 señales están de acuerdo, 1 en contra.
• Tendencia alcista en 1h (por encima de EMA50 y EMA200)
• Los compradores impulsan el movimiento (ADX de 15m: 45.8)
• Los compradores tienen el impulso (RSI de 4h: 58.7)
Riesgo: tendencia diaria bajista (por debajo de EMA50 y EMA200)
Nota de operación: LAB
Estoy observando LAB para una posición larga contracorriente. La tendencia diaria es bajista, así que esta es una apuesta por un giro en contra de un marco temporal mayor, lo que la hace más arriesgada que una operación a favor de la tendencia. Quiero ver que el precio en 1h se mantenga por encima del conjunto de EMA50 y EMA200, y respetaré el stop en 0.0468700 si lo rompe. La configuración se inclina hacia una posición larga con convicción moderada, porque solo 5 de 12 señales están de acuerdo, así que reduciré el tamaño de la posición.
¿Cuál es tu nivel de invalidación para esta posición larga?
1
8
·
--
Bajista
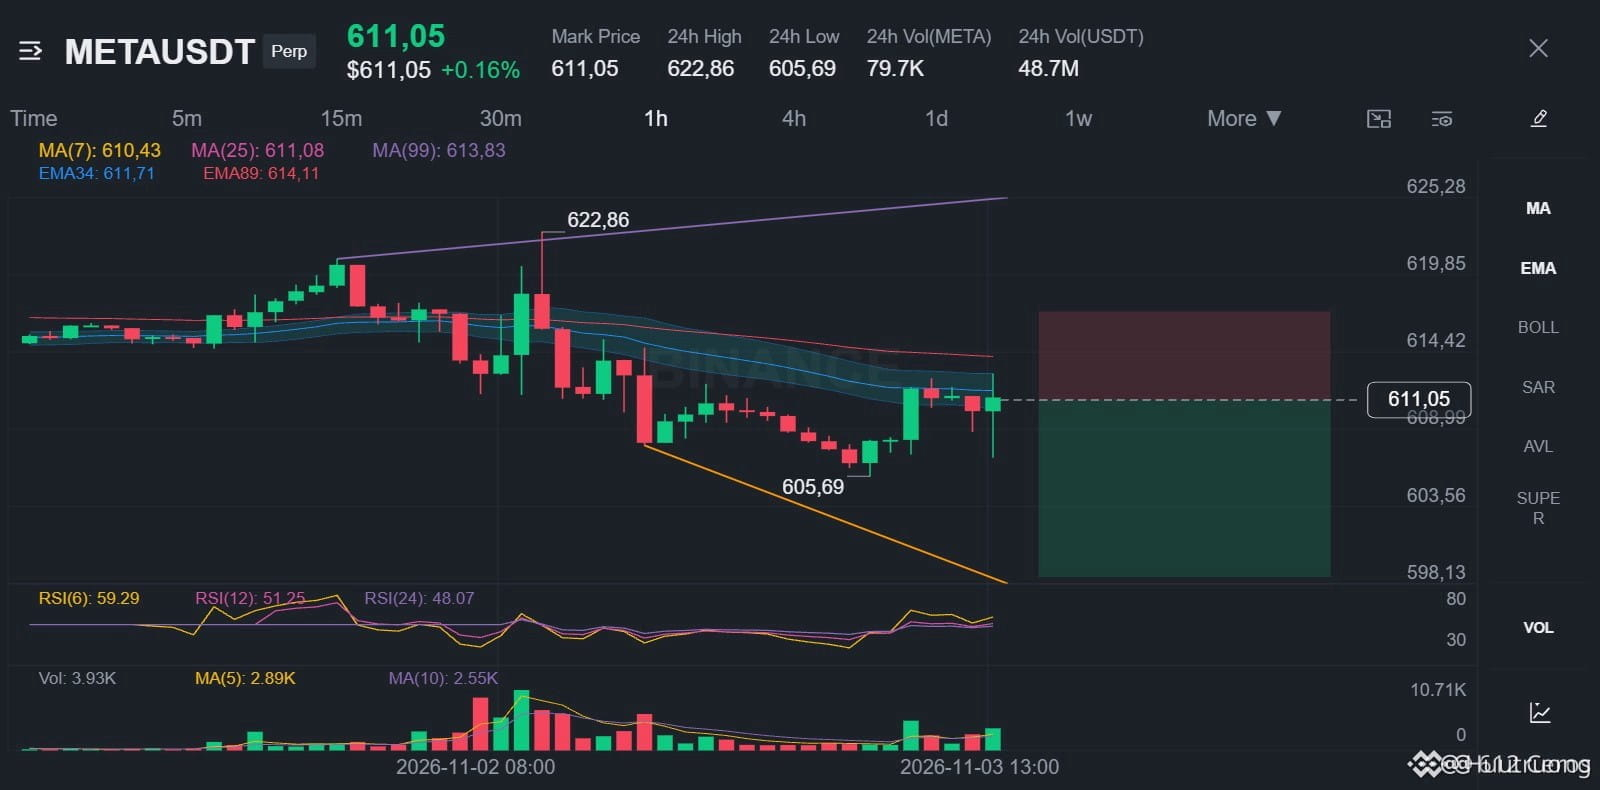
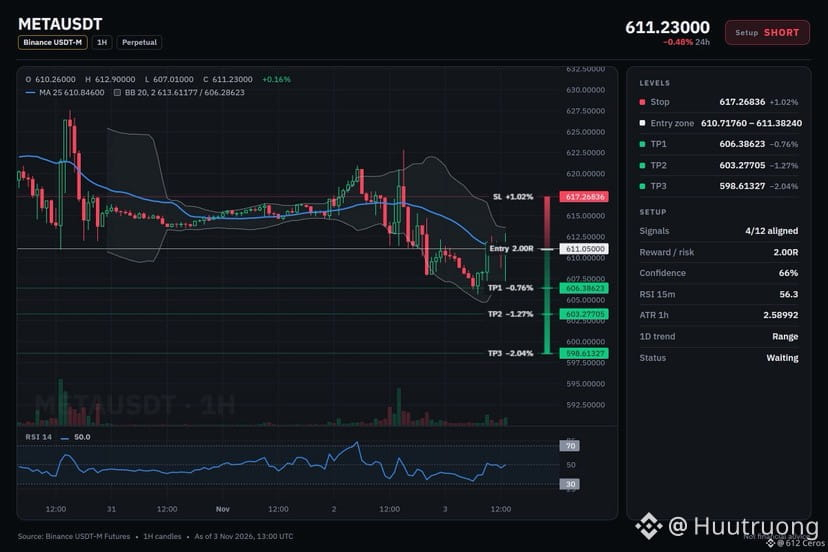
META parece más débil en todos los marcos temporales, excepto en rango.
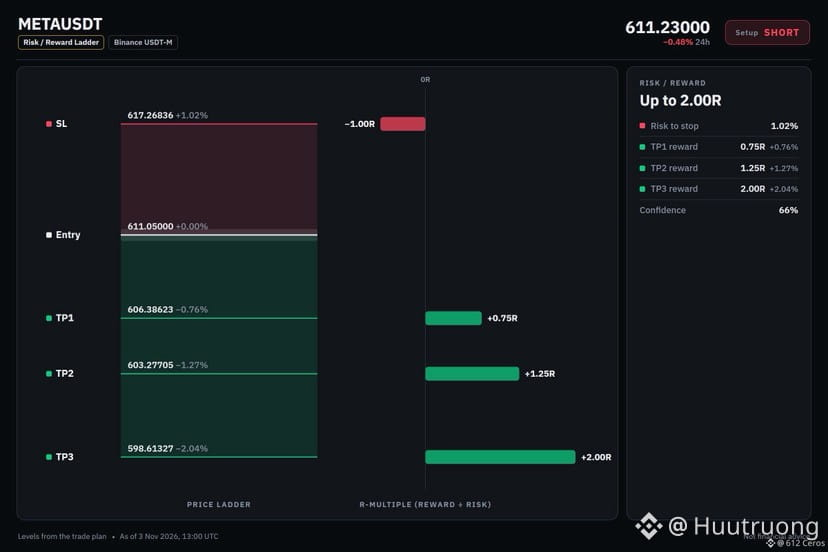
🔴 VENTA EN CORTO $META /USDT: se espera que el precio BAJE
Sesgo: VENTA EN CORTO · Tendencia
Entrada: 610.71760 – 611.38240
TP1: 606.38623 (-0.8%)
TP2: 603.27705 (-1.3%)
TP3: 598.61327 (-2.0%)
SL: 617.26836 (+1.0%)
Plan: entra solo dentro de la zona, cierra el 50% en TP1, el 25% en TP2 y el 25% en TP3, y mueve el stop al precio de entrada después de TP1.
Nota: convicción moderada; mantén un tamaño de posición pequeño.
¿Por qué VENTA EN CORTO? 4/12 señales están de acuerdo, 0 en contra.
• Tendencia bajista en 4h (por debajo de EMA50 y EMA200)
• Tendencia bajista en 1h (por debajo de EMA50 y EMA200)
• Los vendedores están impulsando el movimiento (ADX de 15m: 25.2)
P: ¿Por qué vender en corto cuando la tendencia diaria está en rango?
R: La estructura de 4h es bajista, lo que prevalece sobre el rango diario.
P: ¿Cuándo deja de ser válida esta operación?
R: Una ruptura por encima de 617.26836 invalida la configuración.
¿Cuál es tu nivel de META para posiciones cortas?
{future}(METAUSDT)
META parece más débil en todos los marcos temporales, excepto en rango.
🔴 VENTA EN CORTO $META /USDT: se espera que el precio BAJE
Sesgo: VENTA EN CORTO · Tendencia
Entrada: 610.71760 – 611.38240
TP1: 606.38623 (-0.8%)
TP2: 603.27705 (-1.3%)
TP3: 598.61327 (-2.0%)
SL: 617.26836 (+1.0%)
Plan: entra solo dentro de la zona, cierra el 50% en TP1, el 25% en TP2 y el 25% en TP3, y mueve el stop al precio de entrada después de TP1.
Nota: convicción moderada; mantén un tamaño de posición pequeño.
¿Por qué VENTA EN CORTO? 4/12 señales están de acuerdo, 0 en contra.
• Tendencia bajista en 4h (por debajo de EMA50 y EMA200)
• Tendencia bajista en 1h (por debajo de EMA50 y EMA200)
• Los vendedores están impulsando el movimiento (ADX de 15m: 25.2)
P: ¿Por qué vender en corto cuando la tendencia diaria está en rango?
R: La estructura de 4h es bajista, lo que prevalece sobre el rango diario.
P: ¿Cuándo deja de ser válida esta operación?
R: Una ruptura por encima de 617.26836 invalida la configuración.
¿Cuál es tu nivel de META para posiciones cortas?
🔴 VENTA EN CORTO $META /USDT: se espera que el precio BAJE
Sesgo: VENTA EN CORTO · Tendencia
Entrada: 610.71760 – 611.38240
TP1: 606.38623 (-0.8%)
TP2: 603.27705 (-1.3%)
TP3: 598.61327 (-2.0%)
SL: 617.26836 (+1.0%)
Plan: entra solo dentro de la zona, cierra el 50% en TP1, el 25% en TP2 y el 25% en TP3, y mueve el stop al precio de entrada después de TP1.
Nota: convicción moderada; mantén un tamaño de posición pequeño.
¿Por qué VENTA EN CORTO? 4/12 señales están de acuerdo, 0 en contra.
• Tendencia bajista en 4h (por debajo de EMA50 y EMA200)
• Tendencia bajista en 1h (por debajo de EMA50 y EMA200)
• Los vendedores están impulsando el movimiento (ADX de 15m: 25.2)
P: ¿Por qué vender en corto cuando la tendencia diaria está en rango?
R: La estructura de 4h es bajista, lo que prevalece sobre el rango diario.
P: ¿Cuándo deja de ser válida esta operación?
R: Una ruptura por encima de 617.26836 invalida la configuración.
¿Cuál es tu nivel de META para posiciones cortas?
12
·
--
Alcista
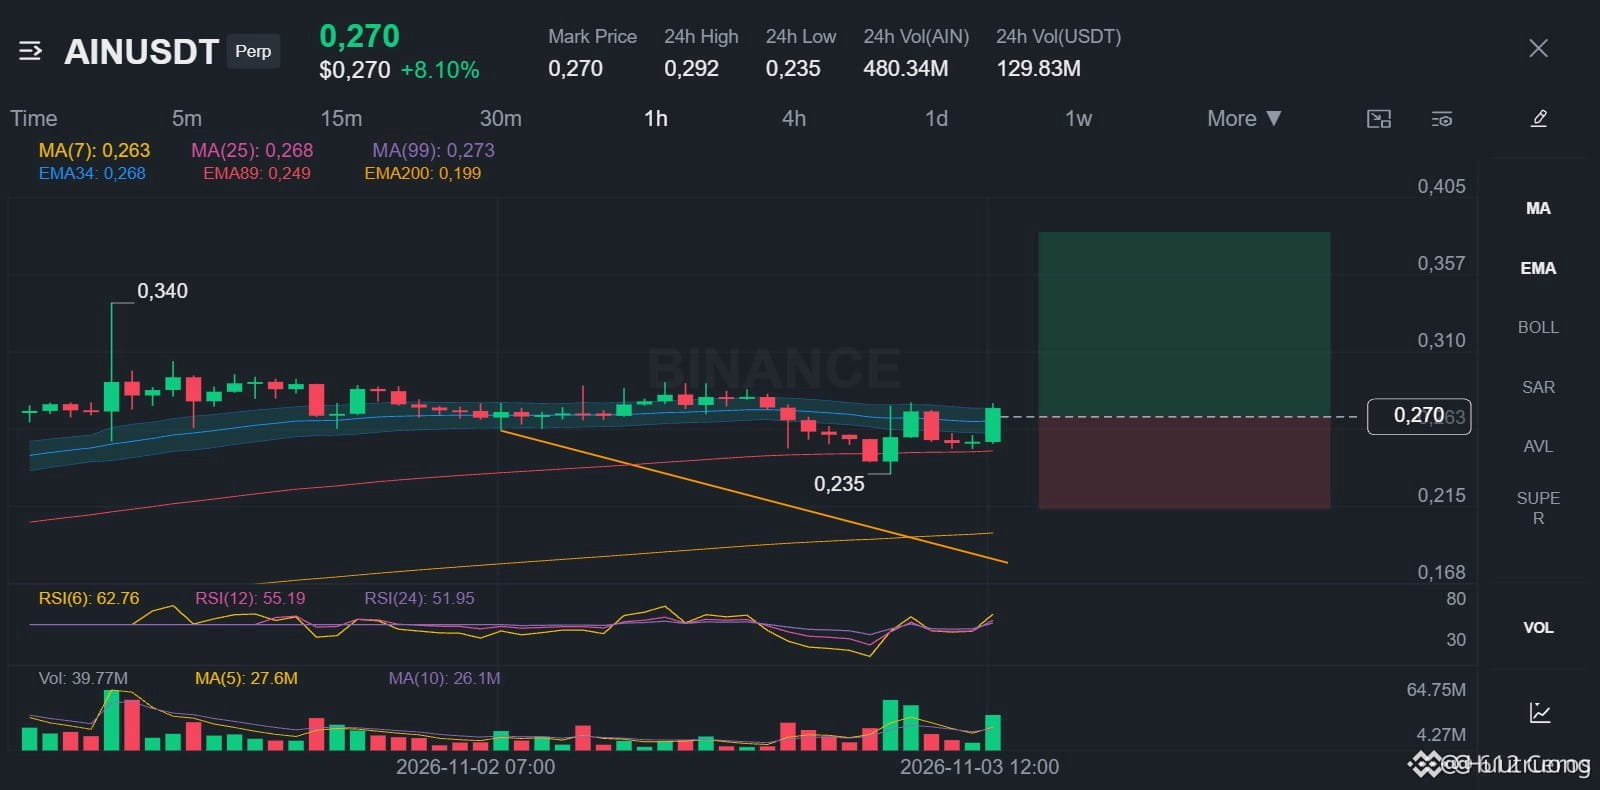
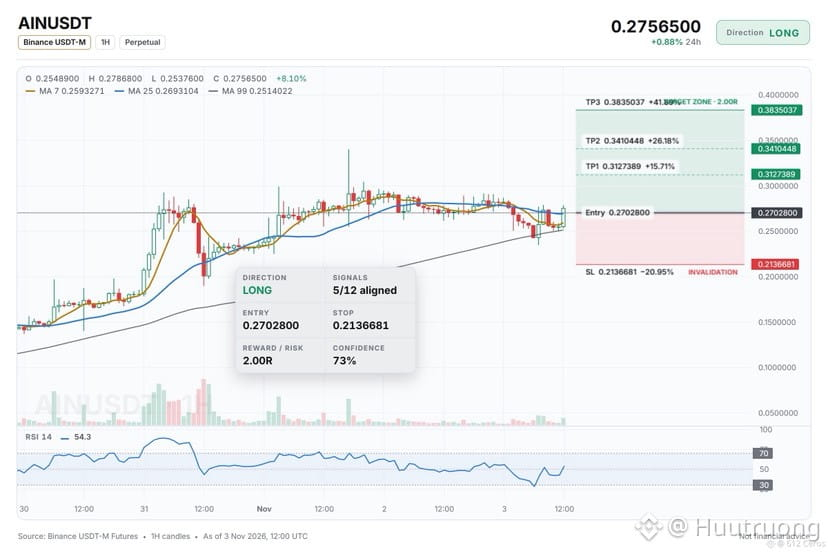
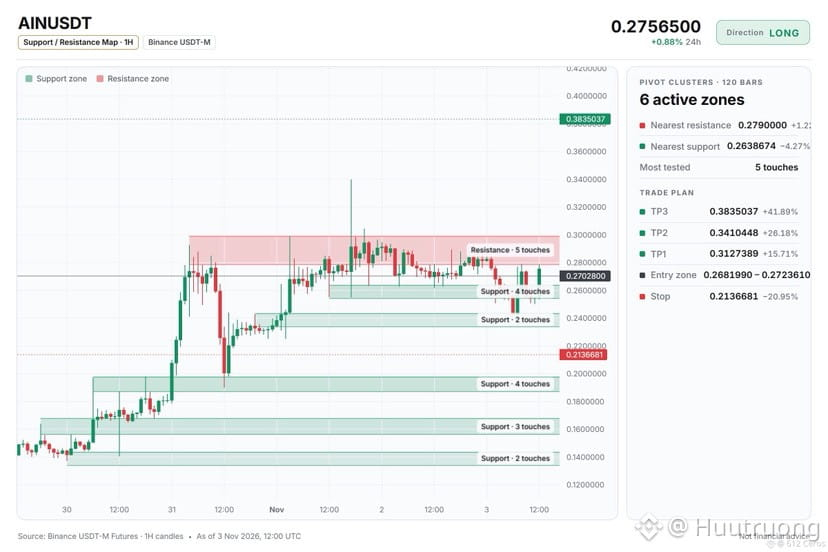
Ain presenta una configuración alcista en todos los marcos temporales ahora mismo.
🟢 LARGO $AIN /USDT: se espera que el precio SUBA
Sesgo: LARGO · Con inclinación alcista
Entrada: 0.2681990 – 0.2723610
TP1: 0.3127389 (+15.7%)
TP2: 0.3410448 (+26.2%)
TP3: 0.3835037 (+41.9%)
SL: 0.2136681 (-20.9%)
Plan: entra solo dentro de la zona, cierra el 50% en TP1, el 25% en TP2 y el 25% en TP3, y mueve el stop al precio de entrada después de TP1.
Nota: la convicción es moderada; mantén una posición pequeña.
¿Por qué LARGO? Esto es lo que comprobé: 5/12 están de acuerdo, 0 en contra.
• Tendencia diaria alcista (por encima de EMA50 y EMA200)
• Tendencia de 4 h alcista (por encima de EMA50 y EMA200)
• Tendencia de 1 h alcista (por encima de EMA50 y EMA200)
Atención: La idea queda invalidada si el precio alcanza el stop en 0.2136681
En resumen: Las señales alcistas diarias y de 4 h respaldan una posición larga, pero el RSI de 1 h es neutral y la convicción es solo moderada.
¿Dónde colocarías el stop en esta operación?
{future}(AINUSDT)
Ain presenta una configuración alcista en todos los marcos temporales ahora mismo.
🟢 LARGO $AIN /USDT: se espera que el precio SUBA
Sesgo: LARGO · Con inclinación alcista
Entrada: 0.2681990 – 0.2723610
TP1: 0.3127389 (+15.7%)
TP2: 0.3410448 (+26.2%)
TP3: 0.3835037 (+41.9%)
SL: 0.2136681 (-20.9%)
Plan: entra solo dentro de la zona, cierra el 50% en TP1, el 25% en TP2 y el 25% en TP3, y mueve el stop al precio de entrada después de TP1.
Nota: la convicción es moderada; mantén una posición pequeña.
¿Por qué LARGO? Esto es lo que comprobé: 5/12 están de acuerdo, 0 en contra.
• Tendencia diaria alcista (por encima de EMA50 y EMA200)
• Tendencia de 4 h alcista (por encima de EMA50 y EMA200)
• Tendencia de 1 h alcista (por encima de EMA50 y EMA200)
Atención: La idea queda invalidada si el precio alcanza el stop en 0.2136681
En resumen: Las señales alcistas diarias y de 4 h respaldan una posición larga, pero el RSI de 1 h es neutral y la convicción es solo moderada.
¿Dónde colocarías el stop en esta operación?
🟢 LARGO $AIN /USDT: se espera que el precio SUBA
Sesgo: LARGO · Con inclinación alcista
Entrada: 0.2681990 – 0.2723610
TP1: 0.3127389 (+15.7%)
TP2: 0.3410448 (+26.2%)
TP3: 0.3835037 (+41.9%)
SL: 0.2136681 (-20.9%)
Plan: entra solo dentro de la zona, cierra el 50% en TP1, el 25% en TP2 y el 25% en TP3, y mueve el stop al precio de entrada después de TP1.
Nota: la convicción es moderada; mantén una posición pequeña.
¿Por qué LARGO? Esto es lo que comprobé: 5/12 están de acuerdo, 0 en contra.
• Tendencia diaria alcista (por encima de EMA50 y EMA200)
• Tendencia de 4 h alcista (por encima de EMA50 y EMA200)
• Tendencia de 1 h alcista (por encima de EMA50 y EMA200)
Atención: La idea queda invalidada si el precio alcanza el stop en 0.2136681
En resumen: Las señales alcistas diarias y de 4 h respaldan una posición larga, pero el RSI de 1 h es neutral y la convicción es solo moderada.
¿Dónde colocarías el stop en esta operación?
16
·
--
Bajista
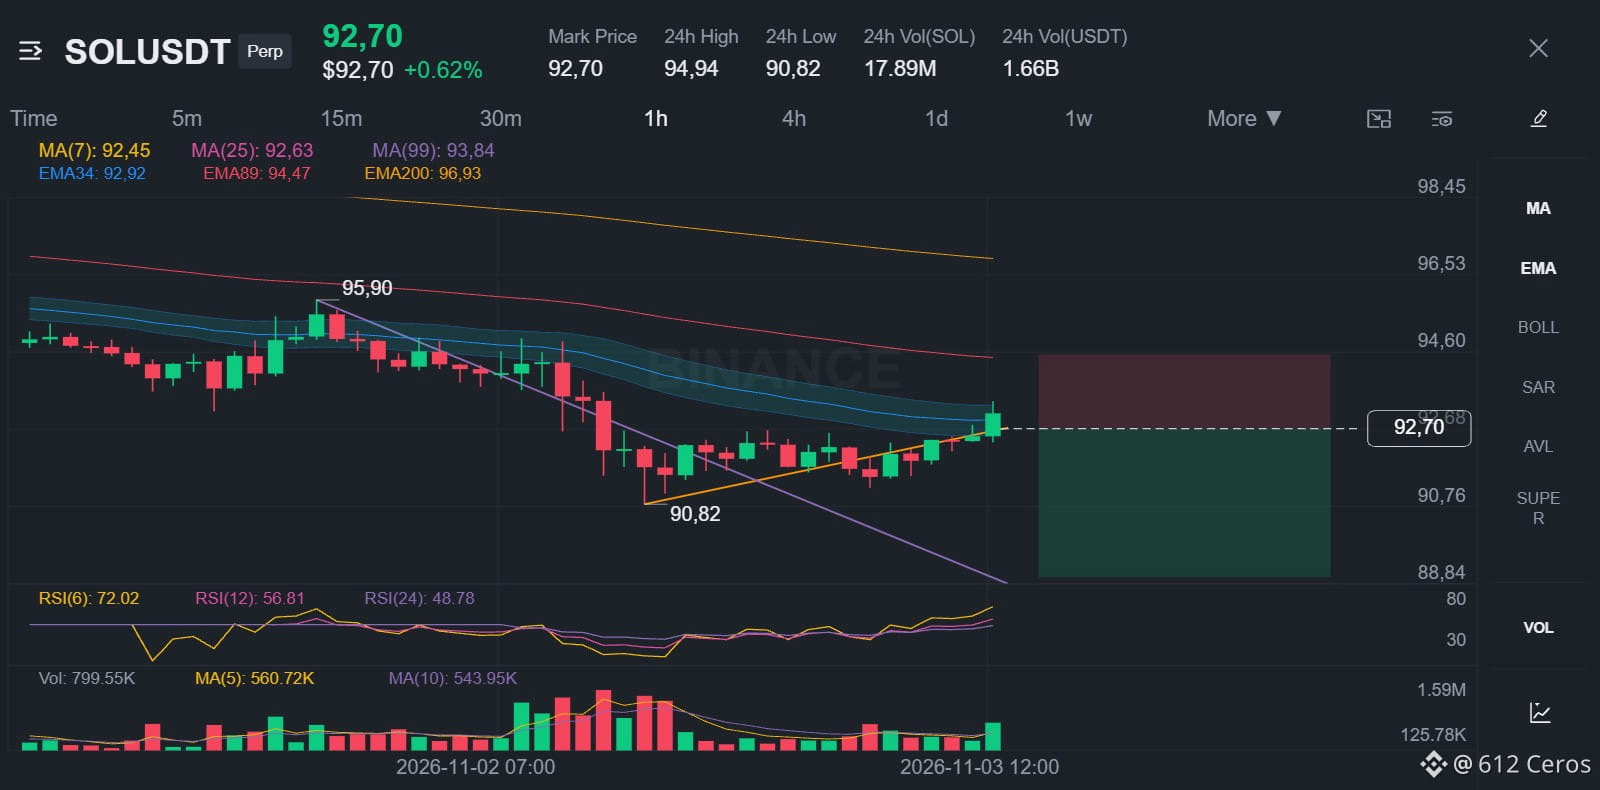
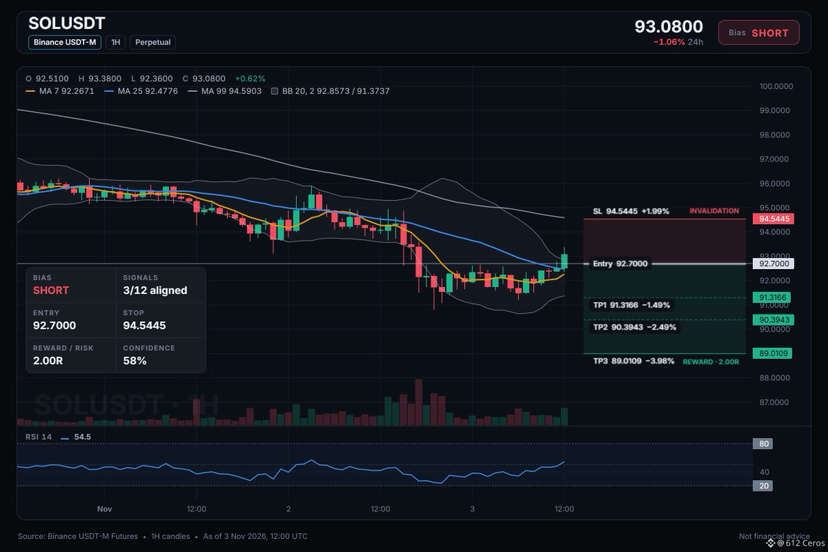
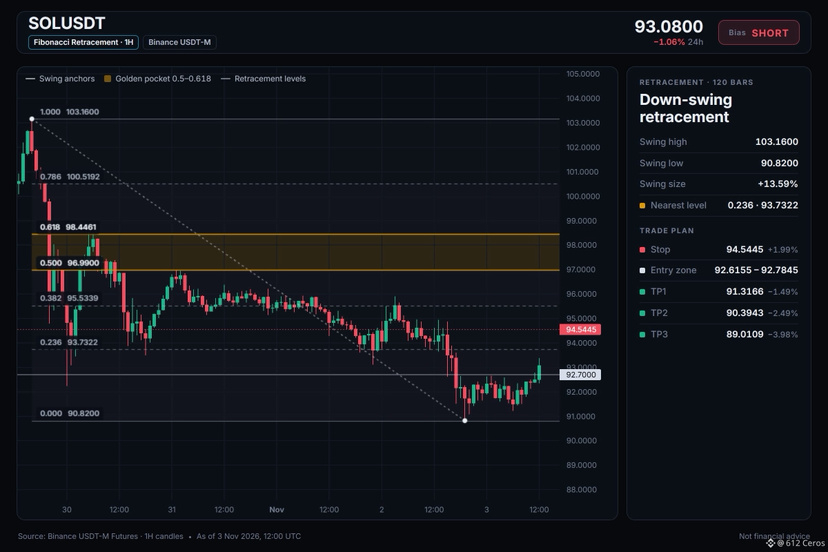
Configuración en corto de SOL: los niveles que estoy vigilando
🔴 CORTO $SOL /USDT: espero que el precio BAJE
Sesgo: CORTO · Tendencia
Entrada: 92.6155 – 92.7845
TP1: 91.3166 (-1.5%)
TP2: 90.3943 (-2.5%)
TP3: 89.0109 (-4.0%)
SL: 94.5445 (+2.0%)
Plan: entrar solo dentro de la zona, cerrar el 50% en TP1, el 25% en TP2, el 25% en TP3 y mover el stop al precio de entrada después de TP1.
Nota: la convicción es moderada; mantén un tamaño pequeño.
¿Por qué en CORTO? 3/12 señales coinciden, 1 está en contra.
• Tendencia bajista en 4 h (por debajo de EMA50 y EMA200)
• Tendencia bajista en 1 h (por debajo de EMA50 y EMA200)
• Los vendedores tienen el impulso (RSI de 4 h: 35.3)
Riesgo: BTC está subiendo y esta moneda lo sigue (correlación 0.89)
¿Por qué ahora?
La tendencia diaria indica un rango, y 3/12 señales alineadas favorecen la posición en corto. El plan es operar en la zona de 92.6155 – 92.7845, recoger beneficios en 91.3166 y 90.3943, y tener paciencia para llegar a 89.0109. Un movimiento por encima de 94.5445 significaría que la idea es incorrecta y el stop cumpliría su función.
¿SOL llega primero a 91.3166 o al stop?
{spot}(SOLUSDT)
Configuración en corto de SOL: los niveles que estoy vigilando
🔴 CORTO $SOL /USDT: espero que el precio BAJE
Sesgo: CORTO · Tendencia
Entrada: 92.6155 – 92.7845
TP1: 91.3166 (-1.5%)
TP2: 90.3943 (-2.5%)
TP3: 89.0109 (-4.0%)
SL: 94.5445 (+2.0%)
Plan: entrar solo dentro de la zona, cerrar el 50% en TP1, el 25% en TP2, el 25% en TP3 y mover el stop al precio de entrada después de TP1.
Nota: la convicción es moderada; mantén un tamaño pequeño.
¿Por qué en CORTO? 3/12 señales coinciden, 1 está en contra.
• Tendencia bajista en 4 h (por debajo de EMA50 y EMA200)
• Tendencia bajista en 1 h (por debajo de EMA50 y EMA200)
• Los vendedores tienen el impulso (RSI de 4 h: 35.3)
Riesgo: BTC está subiendo y esta moneda lo sigue (correlación 0.89)
¿Por qué ahora?
La tendencia diaria indica un rango, y 3/12 señales alineadas favorecen la posición en corto. El plan es operar en la zona de 92.6155 – 92.7845, recoger beneficios en 91.3166 y 90.3943, y tener paciencia para llegar a 89.0109. Un movimiento por encima de 94.5445 significaría que la idea es incorrecta y el stop cumpliría su función.
¿SOL llega primero a 91.3166 o al stop?
🔴 CORTO $SOL /USDT: espero que el precio BAJE
Sesgo: CORTO · Tendencia
Entrada: 92.6155 – 92.7845
TP1: 91.3166 (-1.5%)
TP2: 90.3943 (-2.5%)
TP3: 89.0109 (-4.0%)
SL: 94.5445 (+2.0%)
Plan: entrar solo dentro de la zona, cerrar el 50% en TP1, el 25% en TP2, el 25% en TP3 y mover el stop al precio de entrada después de TP1.
Nota: la convicción es moderada; mantén un tamaño pequeño.
¿Por qué en CORTO? 3/12 señales coinciden, 1 está en contra.
• Tendencia bajista en 4 h (por debajo de EMA50 y EMA200)
• Tendencia bajista en 1 h (por debajo de EMA50 y EMA200)
• Los vendedores tienen el impulso (RSI de 4 h: 35.3)
Riesgo: BTC está subiendo y esta moneda lo sigue (correlación 0.89)
¿Por qué ahora?
La tendencia diaria indica un rango, y 3/12 señales alineadas favorecen la posición en corto. El plan es operar en la zona de 92.6155 – 92.7845, recoger beneficios en 91.3166 y 90.3943, y tener paciencia para llegar a 89.0109. Un movimiento por encima de 94.5445 significaría que la idea es incorrecta y el stop cumpliría su función.
¿SOL llega primero a 91.3166 o al stop?
15
·
--
Bajista
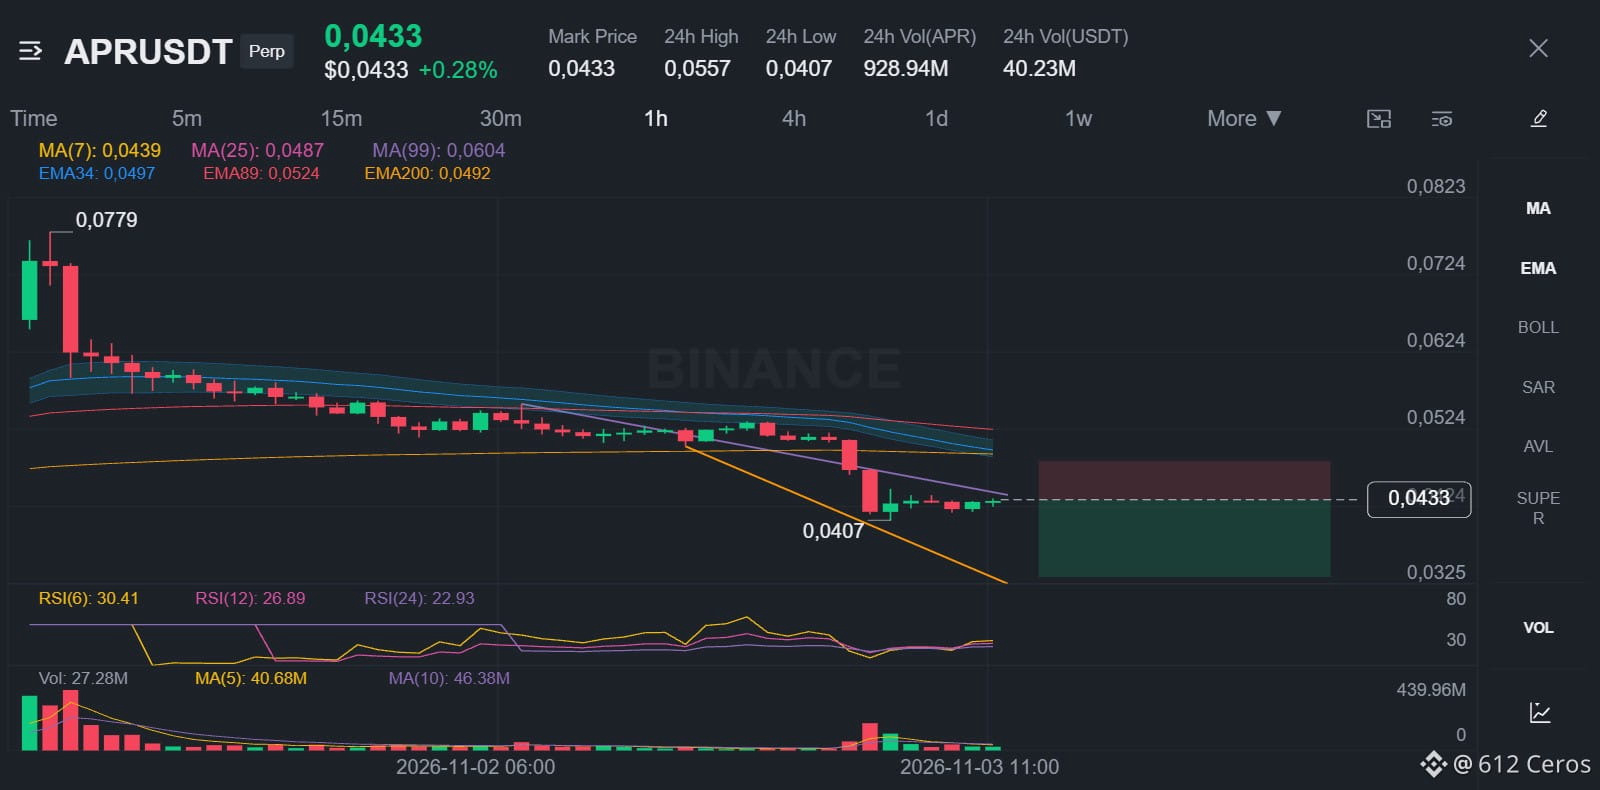
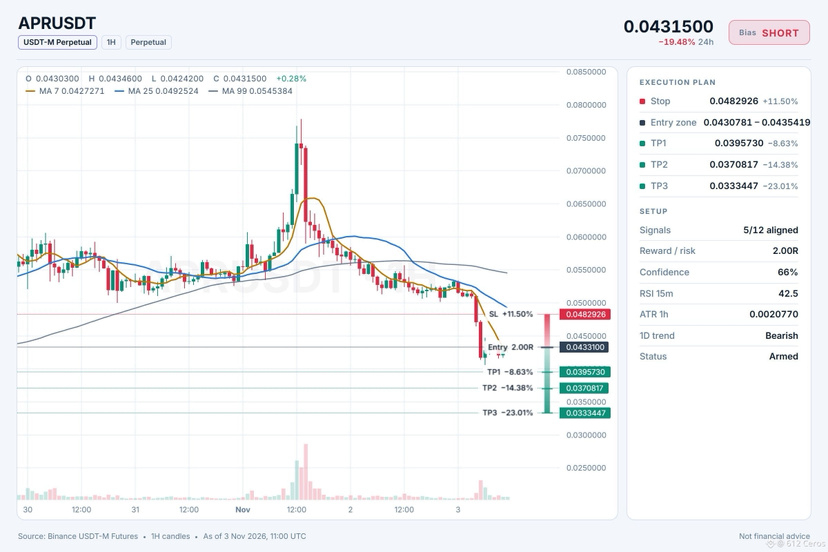
Configuración de venta en corto de APR: niveles que estoy observando
🔴 CORTO $APR /USDT: espero que el precio BAJE
Sesgo: CORTO · Inclinado
Entrada: 0.0430781 – 0.0435419
TP1: 0.0395730 (-8.6%)
TP2: 0.0370817 (-14.4%)
TP3: 0.0333447 (-23.0%)
SL: 0.0482926 (+11.5%)
Plan: entrar solo dentro de la zona, cerrar el 50% en TP1, el 25% en TP2, el 25% en TP3 y mover el stop al precio de entrada después de TP1.
Nota: convicción moderada; mantén un tamaño de posición reducido.
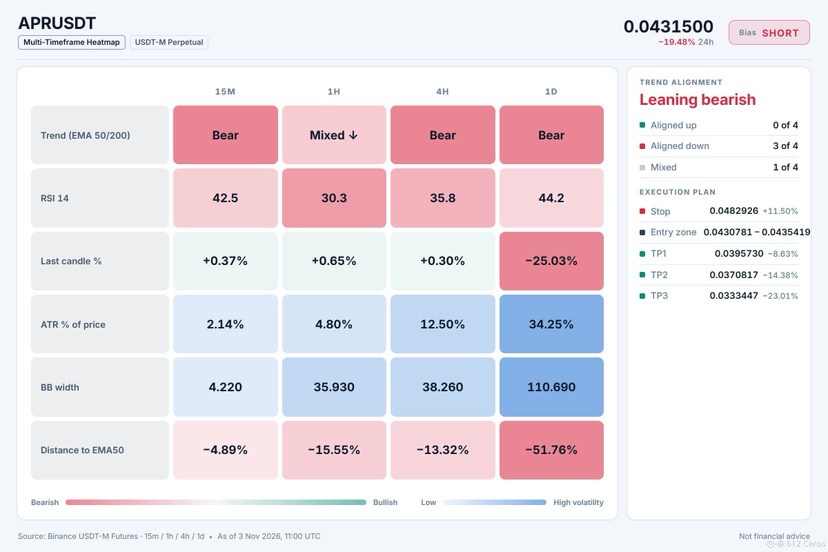
¿Por qué CORTO? 5/12 señales coinciden, 1 está en contra.
• Tendencia diaria bajista (por debajo de EMA50 y EMA200)
• Tendencia de 4 h bajista (por debajo de EMA50 y EMA200)
• Los vendedores tienen el impulso (RSI de 4 h: 35.8)
Riesgo: muy por debajo de su promedio; es probable un rebote (−3.8 ATR desde EMA50 de 1 h)
El razonamiento:
La tendencia diaria es bajista y 5/12 señales alineadas favorecen las posiciones cortas. El plan es operar en la zona de 0.0430781 – 0.0435419, reducir la posición en 0.0395730 y 0.0370817, y tener paciencia hasta 0.0333447. Si el precio supera 0.0482926, la idea deja de ser válida y el stop cumplirá su función.
¿APR alcanza primero 0.0395730 o el stop?
{future}(APRUSDT)
Configuración de venta en corto de APR: niveles que estoy observando
🔴 CORTO $APR /USDT: espero que el precio BAJE
Sesgo: CORTO · Inclinado
Entrada: 0.0430781 – 0.0435419
TP1: 0.0395730 (-8.6%)
TP2: 0.0370817 (-14.4%)
TP3: 0.0333447 (-23.0%)
SL: 0.0482926 (+11.5%)
Plan: entrar solo dentro de la zona, cerrar el 50% en TP1, el 25% en TP2, el 25% en TP3 y mover el stop al precio de entrada después de TP1.
Nota: convicción moderada; mantén un tamaño de posición reducido.
¿Por qué CORTO? 5/12 señales coinciden, 1 está en contra.
• Tendencia diaria bajista (por debajo de EMA50 y EMA200)
• Tendencia de 4 h bajista (por debajo de EMA50 y EMA200)
• Los vendedores tienen el impulso (RSI de 4 h: 35.8)
Riesgo: muy por debajo de su promedio; es probable un rebote (−3.8 ATR desde EMA50 de 1 h)
El razonamiento:
La tendencia diaria es bajista y 5/12 señales alineadas favorecen las posiciones cortas. El plan es operar en la zona de 0.0430781 – 0.0435419, reducir la posición en 0.0395730 y 0.0370817, y tener paciencia hasta 0.0333447. Si el precio supera 0.0482926, la idea deja de ser válida y el stop cumplirá su función.
¿APR alcanza primero 0.0395730 o el stop?
🔴 CORTO $APR /USDT: espero que el precio BAJE
Sesgo: CORTO · Inclinado
Entrada: 0.0430781 – 0.0435419
TP1: 0.0395730 (-8.6%)
TP2: 0.0370817 (-14.4%)
TP3: 0.0333447 (-23.0%)
SL: 0.0482926 (+11.5%)
Plan: entrar solo dentro de la zona, cerrar el 50% en TP1, el 25% en TP2, el 25% en TP3 y mover el stop al precio de entrada después de TP1.
Nota: convicción moderada; mantén un tamaño de posición reducido.
¿Por qué CORTO? 5/12 señales coinciden, 1 está en contra.
• Tendencia diaria bajista (por debajo de EMA50 y EMA200)
• Tendencia de 4 h bajista (por debajo de EMA50 y EMA200)
• Los vendedores tienen el impulso (RSI de 4 h: 35.8)
Riesgo: muy por debajo de su promedio; es probable un rebote (−3.8 ATR desde EMA50 de 1 h)
El razonamiento:
La tendencia diaria es bajista y 5/12 señales alineadas favorecen las posiciones cortas. El plan es operar en la zona de 0.0430781 – 0.0435419, reducir la posición en 0.0395730 y 0.0370817, y tener paciencia hasta 0.0333447. Si el precio supera 0.0482926, la idea deja de ser válida y el stop cumplirá su función.
¿APR alcanza primero 0.0395730 o el stop?
16
·
--
Bajista
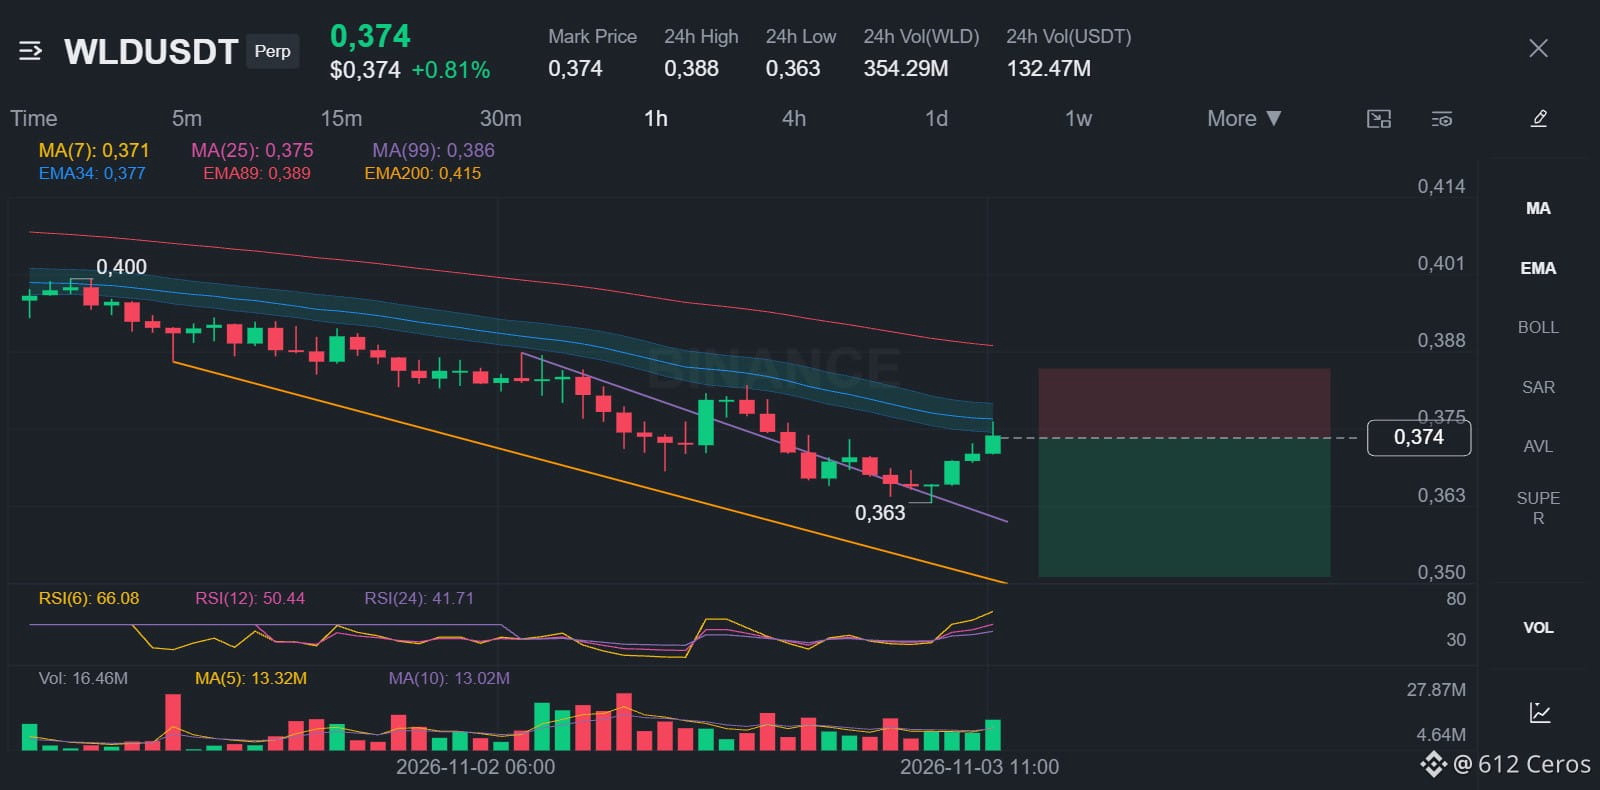
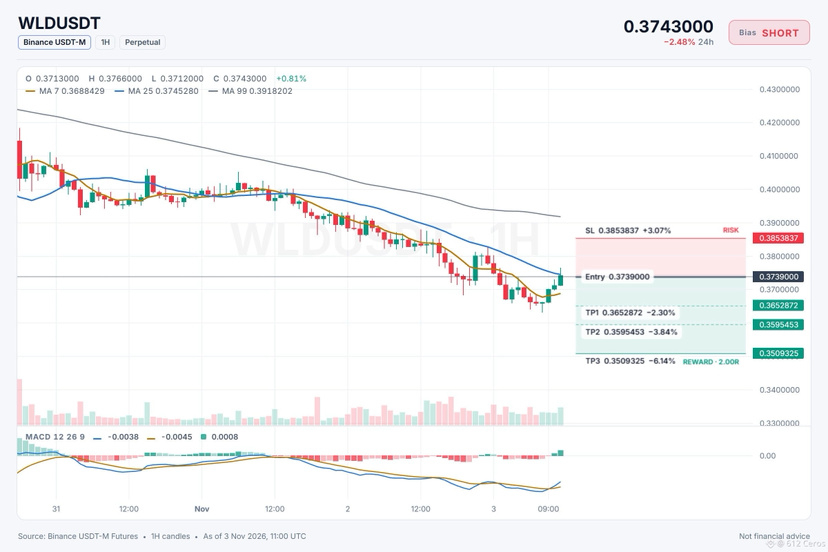
WLD en rango aún puede caer con fuerza.
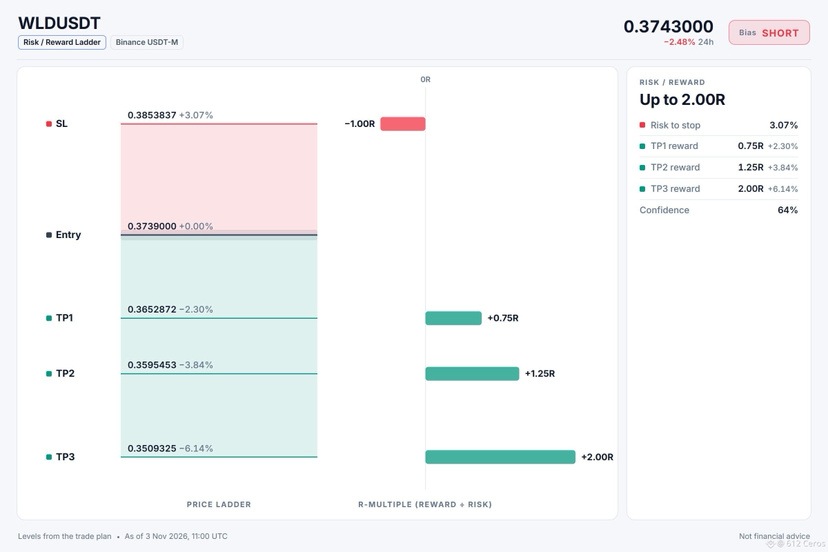
🔴 CORTO $WLD /USDT: se espera que el precio BAJE
Sesgo: CORTO · Tendencia
Entrada: 0.3733584 – 0.3744416
TP1: 0.3652872 (-2.3%)
TP2: 0.3595453 (-3.8%)
TP3: 0.3509325 (-6.1%)
SL: 0.3853837 (+3.1%)
Plan: entra solo dentro de la zona, cierra el 50% en TP1, el 25% en TP2, el 25% en TP3 y mueve el stop al precio de entrada después de TP1.
Nota: convicción moderada; mantén un tamaño de posición reducido.
¿Por qué CORTO? 5/12 señales están de acuerdo, 1 en contra.
• Tendencia bajista en 4h (por debajo de EMA50 y EMA200)
• Tendencia bajista en 1h (por debajo de EMA50 y EMA200)
• Los vendedores tienen el impulso (RSI de 4h: 36.3)
Riesgo: Los compradores están impulsando el movimiento (ADX de 15m: 23.9)
P: ¿Por qué abrir una posición corta aquí si los compradores llevan la delantera?
R: La estructura de 4h es bajista, lo que significa que la tendencia oscilante es descendente.
P: ¿Cuándo sería errónea esta configuración?
R: Una lectura del ADX de 15m de 23.9 con DI+ por encima de DI- significa que los compradores están impulsando el movimiento.
¿Cuál es tu nivel de WLD si esto falla?
{spot}(WLDUSDT)
WLD en rango aún puede caer con fuerza.
🔴 CORTO $WLD /USDT: se espera que el precio BAJE
Sesgo: CORTO · Tendencia
Entrada: 0.3733584 – 0.3744416
TP1: 0.3652872 (-2.3%)
TP2: 0.3595453 (-3.8%)
TP3: 0.3509325 (-6.1%)
SL: 0.3853837 (+3.1%)
Plan: entra solo dentro de la zona, cierra el 50% en TP1, el 25% en TP2, el 25% en TP3 y mueve el stop al precio de entrada después de TP1.
Nota: convicción moderada; mantén un tamaño de posición reducido.
¿Por qué CORTO? 5/12 señales están de acuerdo, 1 en contra.
• Tendencia bajista en 4h (por debajo de EMA50 y EMA200)
• Tendencia bajista en 1h (por debajo de EMA50 y EMA200)
• Los vendedores tienen el impulso (RSI de 4h: 36.3)
Riesgo: Los compradores están impulsando el movimiento (ADX de 15m: 23.9)
P: ¿Por qué abrir una posición corta aquí si los compradores llevan la delantera?
R: La estructura de 4h es bajista, lo que significa que la tendencia oscilante es descendente.
P: ¿Cuándo sería errónea esta configuración?
R: Una lectura del ADX de 15m de 23.9 con DI+ por encima de DI- significa que los compradores están impulsando el movimiento.
¿Cuál es tu nivel de WLD si esto falla?
🔴 CORTO $WLD /USDT: se espera que el precio BAJE
Sesgo: CORTO · Tendencia
Entrada: 0.3733584 – 0.3744416
TP1: 0.3652872 (-2.3%)
TP2: 0.3595453 (-3.8%)
TP3: 0.3509325 (-6.1%)
SL: 0.3853837 (+3.1%)
Plan: entra solo dentro de la zona, cierra el 50% en TP1, el 25% en TP2, el 25% en TP3 y mueve el stop al precio de entrada después de TP1.
Nota: convicción moderada; mantén un tamaño de posición reducido.
¿Por qué CORTO? 5/12 señales están de acuerdo, 1 en contra.
• Tendencia bajista en 4h (por debajo de EMA50 y EMA200)
• Tendencia bajista en 1h (por debajo de EMA50 y EMA200)
• Los vendedores tienen el impulso (RSI de 4h: 36.3)
Riesgo: Los compradores están impulsando el movimiento (ADX de 15m: 23.9)
P: ¿Por qué abrir una posición corta aquí si los compradores llevan la delantera?
R: La estructura de 4h es bajista, lo que significa que la tendencia oscilante es descendente.
P: ¿Cuándo sería errónea esta configuración?
R: Una lectura del ADX de 15m de 23.9 con DI+ por encima de DI- significa que los compradores están impulsando el movimiento.
¿Cuál es tu nivel de WLD si esto falla?
7
·
--
Bajista
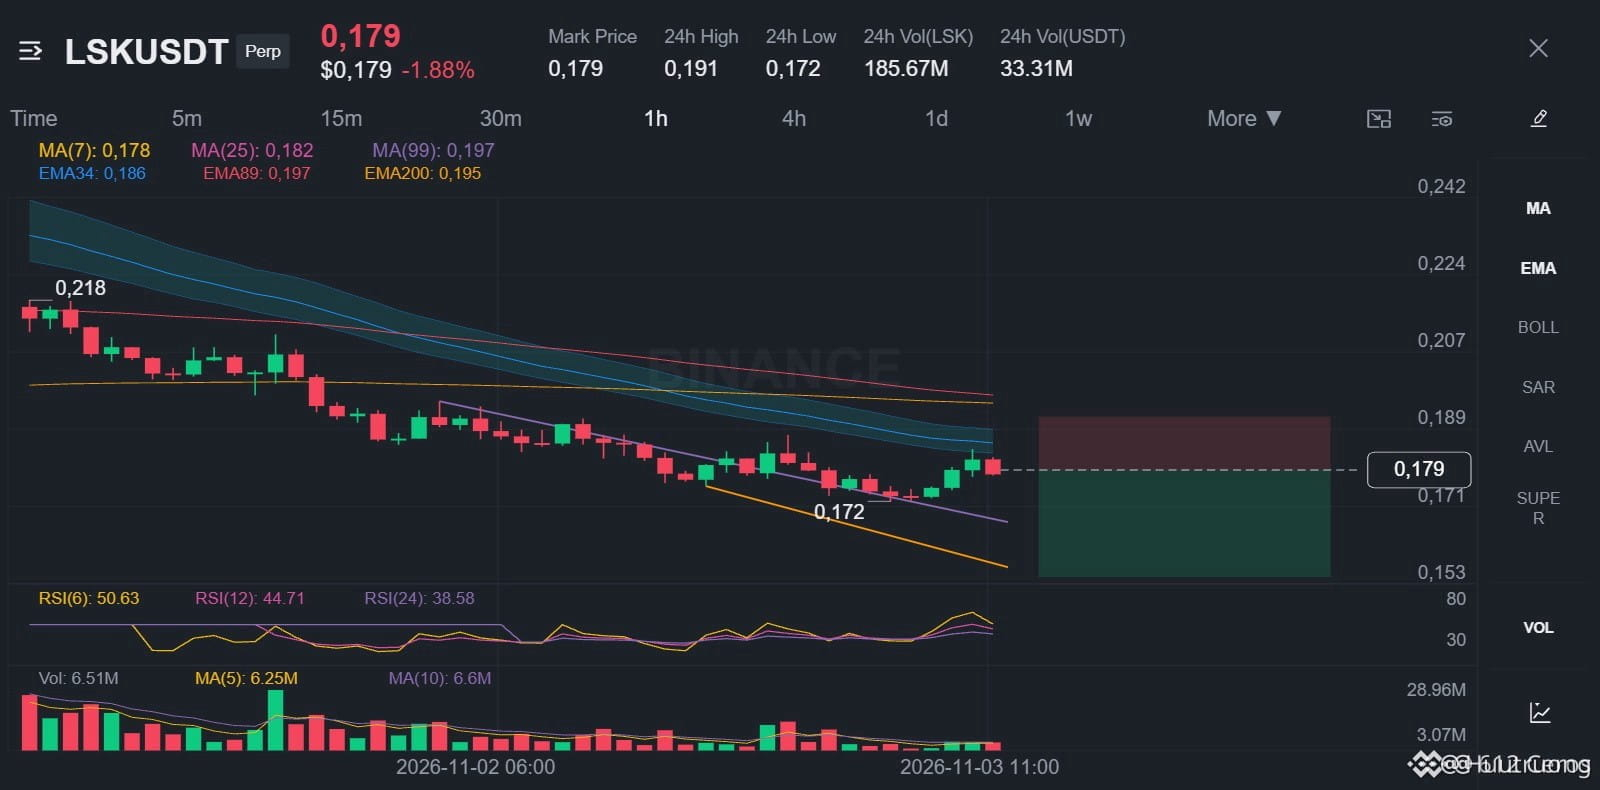
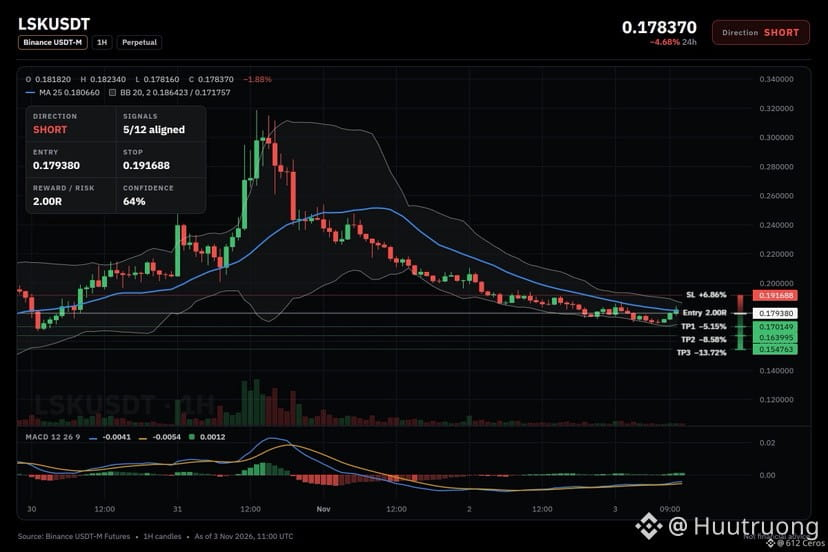
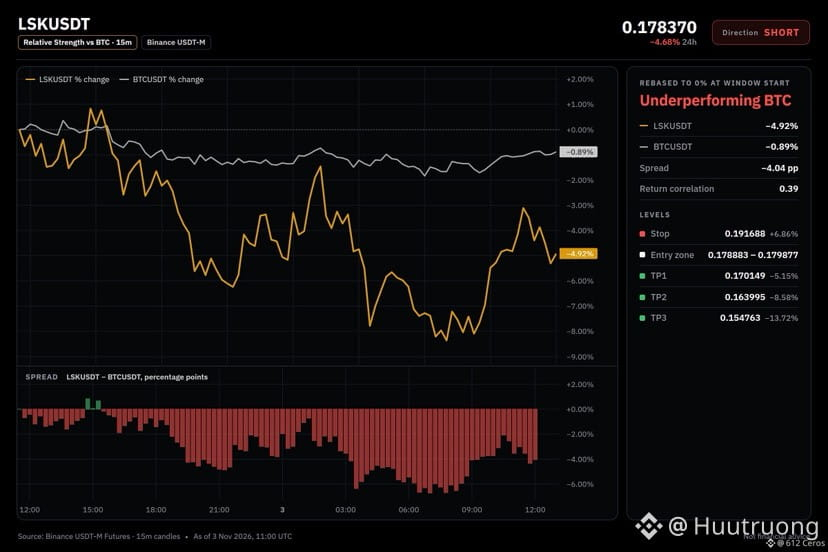
🔴 CORTO $LSK /USDT: se espera que el precio BAJE
Sesgo: CORTO · inclinación
Entrada: 0.178883 – 0.179877
TP1: 0.170149 (-5.1%)
TP2: 0.163995 (-8.6%)
TP3: 0.154763 (-13.7%)
SL: 0.191688 (+6.9%)
Plan: entra solo dentro de la zona, cierra el 50% en TP1, el 25% en TP2 y el 25% en TP3, y mueve el stop al precio de entrada después de TP1.
Nota: convicción moderada; mantén una posición pequeña.
LSK está por debajo de ambas EMA en la estructura de 4h
¿Por qué CORTO? 5/12 señales coinciden; 1 está en contra.
• Tendencia bajista en 4h (por debajo de EMA50 y EMA200)
• Tendencia bajista en 1h (por debajo de EMA50 y EMA200)
• Los vendedores llevan el impulso (RSI de 4h: 41.5)
Riesgo: los compradores están impulsando el movimiento (ADX de 15m: 23.8)
El precio en 4h está por debajo de EMA50 y EMA200, formando una estructura bajista, y el RSI de 4h está en 41.5, lo que muestra un impulso bajista por debajo de 45.
¿Dónde crees que LSK encontrará soporte?
{spot}(LSKUSDT)
🔴 CORTO $LSK /USDT: se espera que el precio BAJE
Sesgo: CORTO · inclinación
Entrada: 0.178883 – 0.179877
TP1: 0.170149 (-5.1%)
TP2: 0.163995 (-8.6%)
TP3: 0.154763 (-13.7%)
SL: 0.191688 (+6.9%)
Plan: entra solo dentro de la zona, cierra el 50% en TP1, el 25% en TP2 y el 25% en TP3, y mueve el stop al precio de entrada después de TP1.
Nota: convicción moderada; mantén una posición pequeña.
LSK está por debajo de ambas EMA en la estructura de 4h
¿Por qué CORTO? 5/12 señales coinciden; 1 está en contra.
• Tendencia bajista en 4h (por debajo de EMA50 y EMA200)
• Tendencia bajista en 1h (por debajo de EMA50 y EMA200)
• Los vendedores llevan el impulso (RSI de 4h: 41.5)
Riesgo: los compradores están impulsando el movimiento (ADX de 15m: 23.8)
El precio en 4h está por debajo de EMA50 y EMA200, formando una estructura bajista, y el RSI de 4h está en 41.5, lo que muestra un impulso bajista por debajo de 45.
¿Dónde crees que LSK encontrará soporte?
Sesgo: CORTO · inclinación
Entrada: 0.178883 – 0.179877
TP1: 0.170149 (-5.1%)
TP2: 0.163995 (-8.6%)
TP3: 0.154763 (-13.7%)
SL: 0.191688 (+6.9%)
Plan: entra solo dentro de la zona, cierra el 50% en TP1, el 25% en TP2 y el 25% en TP3, y mueve el stop al precio de entrada después de TP1.
Nota: convicción moderada; mantén una posición pequeña.
LSK está por debajo de ambas EMA en la estructura de 4h
¿Por qué CORTO? 5/12 señales coinciden; 1 está en contra.
• Tendencia bajista en 4h (por debajo de EMA50 y EMA200)
• Tendencia bajista en 1h (por debajo de EMA50 y EMA200)
• Los vendedores llevan el impulso (RSI de 4h: 41.5)
Riesgo: los compradores están impulsando el movimiento (ADX de 15m: 23.8)
El precio en 4h está por debajo de EMA50 y EMA200, formando una estructura bajista, y el RSI de 4h está en 41.5, lo que muestra un impulso bajista por debajo de 45.
¿Dónde crees que LSK encontrará soporte?
12
·
--
Alcista
La tendencia diaria se alinea al alza para HYPE.
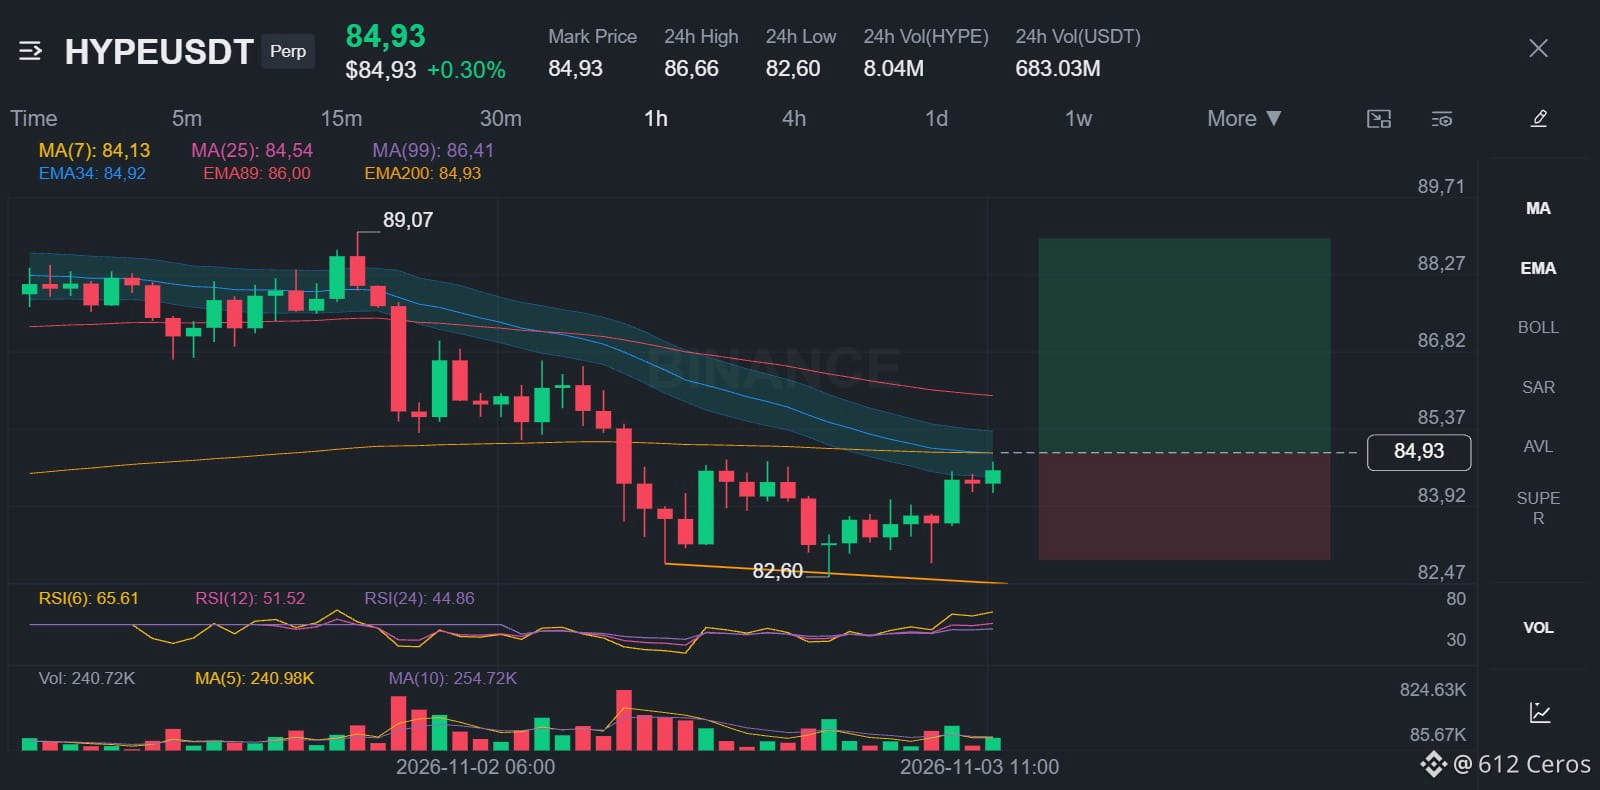
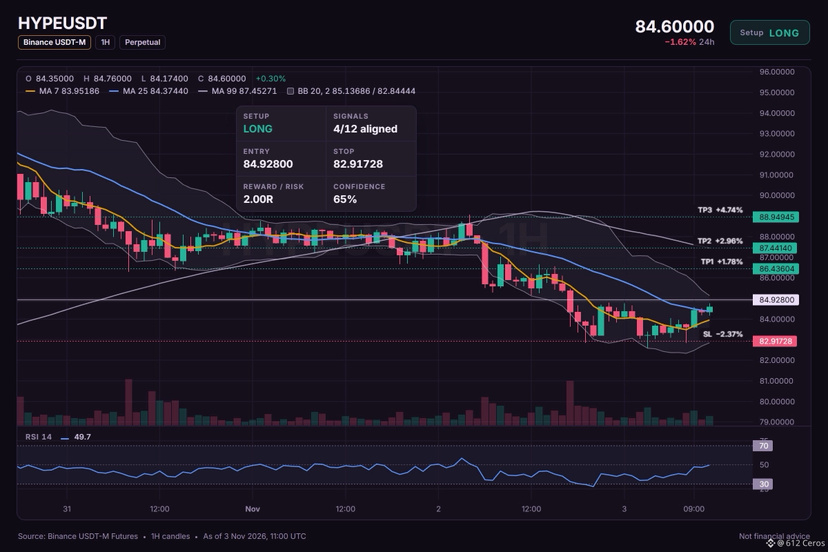
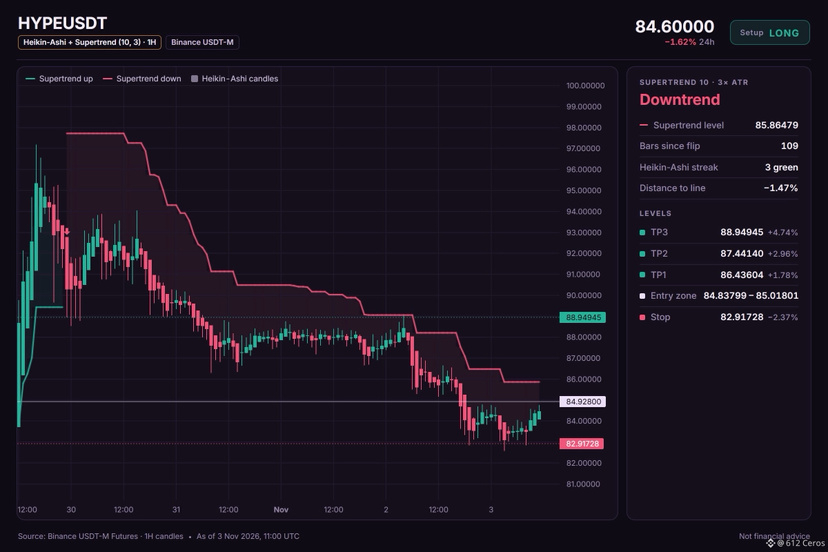
🟢 LARGO $HYPE /USDT: se espera que el precio SUBA
Sesgo: LARGO · Moderado
Entrada: 84.83799 – 85.01801
TP1: 86.43604 (+1.8%)
TP2: 87.44140 (+3.0%)
TP3: 88.94945 (+4.7%)
SL: 82.91728 (-2.4%)
Plan: entra solo dentro de la zona, cierra el 50% en TP1, el 25% en TP2 y el 25% en TP3, y mueve el stop al precio de entrada después de TP1.
Nota: convicción moderada; mantén una posición pequeña.
¿Por qué LARGO? 4/12 señales están de acuerdo y 1 en contra.
• Tendencia diaria alcista (por encima de EMA50 y EMA200)
• Tendencia de 4 h alcista (por encima de EMA50 y EMA200)
• Los compradores impulsan el movimiento (ADX de 15 min: 21.2)
Riesgo: Los vendedores tienen el impulso (RSI de 4 h: 44.8)
Mi análisis de HYPE hoy
Estoy siguiendo HYPE porque la tendencia diaria es alcista y la tendencia de 4 h también lo es. El precio de 1 h es 84.92800, cerca de la zona de entrada, y el RSI de 15 min es 64.34, lo que significa que los compradores están presionando, pero sin llegar a niveles excesivos. El soporte más fuerte es la alineación alcista diaria, mientras que el principal riesgo es el RSI de 4 h en 44.8, lo que significa que los vendedores tienen impulso en ese marco temporal.
¿Dónde fijarías el nivel de invalidación para HYPE?
{spot}(HYPEUSDT)
La tendencia diaria se alinea al alza para HYPE.
🟢 LARGO $HYPE /USDT: se espera que el precio SUBA
Sesgo: LARGO · Moderado
Entrada: 84.83799 – 85.01801
TP1: 86.43604 (+1.8%)
TP2: 87.44140 (+3.0%)
TP3: 88.94945 (+4.7%)
SL: 82.91728 (-2.4%)
Plan: entra solo dentro de la zona, cierra el 50% en TP1, el 25% en TP2 y el 25% en TP3, y mueve el stop al precio de entrada después de TP1.
Nota: convicción moderada; mantén una posición pequeña.
¿Por qué LARGO? 4/12 señales están de acuerdo y 1 en contra.
• Tendencia diaria alcista (por encima de EMA50 y EMA200)
• Tendencia de 4 h alcista (por encima de EMA50 y EMA200)
• Los compradores impulsan el movimiento (ADX de 15 min: 21.2)
Riesgo: Los vendedores tienen el impulso (RSI de 4 h: 44.8)
Mi análisis de HYPE hoy
Estoy siguiendo HYPE porque la tendencia diaria es alcista y la tendencia de 4 h también lo es. El precio de 1 h es 84.92800, cerca de la zona de entrada, y el RSI de 15 min es 64.34, lo que significa que los compradores están presionando, pero sin llegar a niveles excesivos. El soporte más fuerte es la alineación alcista diaria, mientras que el principal riesgo es el RSI de 4 h en 44.8, lo que significa que los vendedores tienen impulso en ese marco temporal.
¿Dónde fijarías el nivel de invalidación para HYPE?
🟢 LARGO $HYPE /USDT: se espera que el precio SUBA
Sesgo: LARGO · Moderado
Entrada: 84.83799 – 85.01801
TP1: 86.43604 (+1.8%)
TP2: 87.44140 (+3.0%)
TP3: 88.94945 (+4.7%)
SL: 82.91728 (-2.4%)
Plan: entra solo dentro de la zona, cierra el 50% en TP1, el 25% en TP2 y el 25% en TP3, y mueve el stop al precio de entrada después de TP1.
Nota: convicción moderada; mantén una posición pequeña.
¿Por qué LARGO? 4/12 señales están de acuerdo y 1 en contra.
• Tendencia diaria alcista (por encima de EMA50 y EMA200)
• Tendencia de 4 h alcista (por encima de EMA50 y EMA200)
• Los compradores impulsan el movimiento (ADX de 15 min: 21.2)
Riesgo: Los vendedores tienen el impulso (RSI de 4 h: 44.8)
Mi análisis de HYPE hoy
Estoy siguiendo HYPE porque la tendencia diaria es alcista y la tendencia de 4 h también lo es. El precio de 1 h es 84.92800, cerca de la zona de entrada, y el RSI de 15 min es 64.34, lo que significa que los compradores están presionando, pero sin llegar a niveles excesivos. El soporte más fuerte es la alineación alcista diaria, mientras que el principal riesgo es el RSI de 4 h en 44.8, lo que significa que los vendedores tienen impulso en ese marco temporal.
¿Dónde fijarías el nivel de invalidación para HYPE?
5
·
--
Alcista
Ver traducción
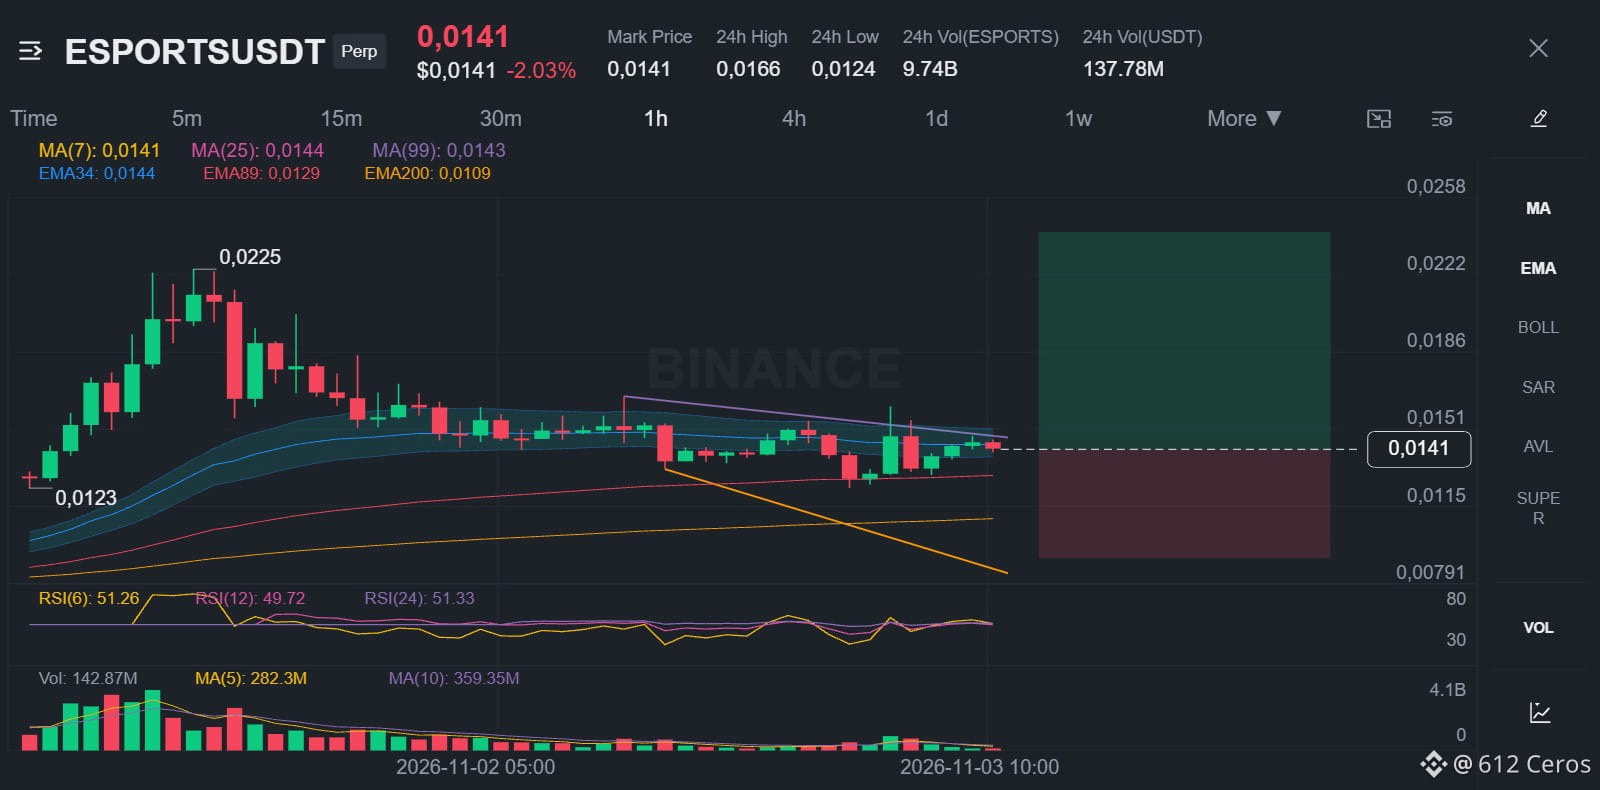
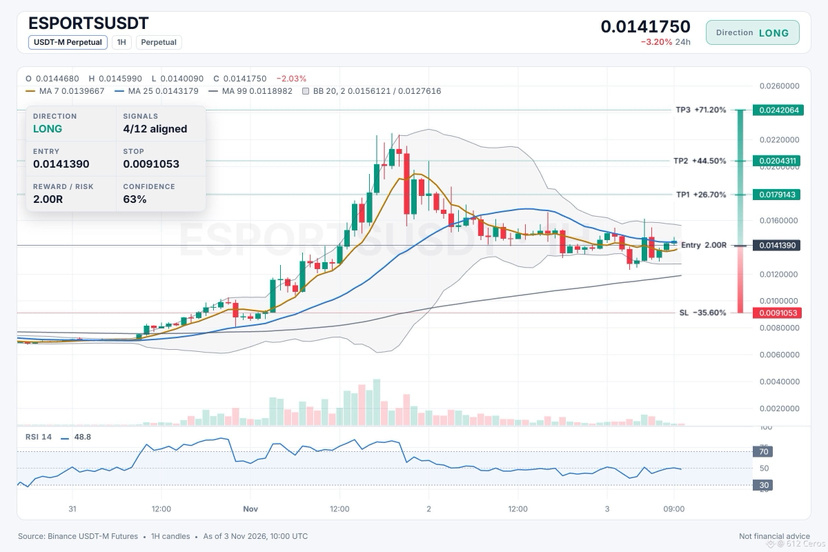
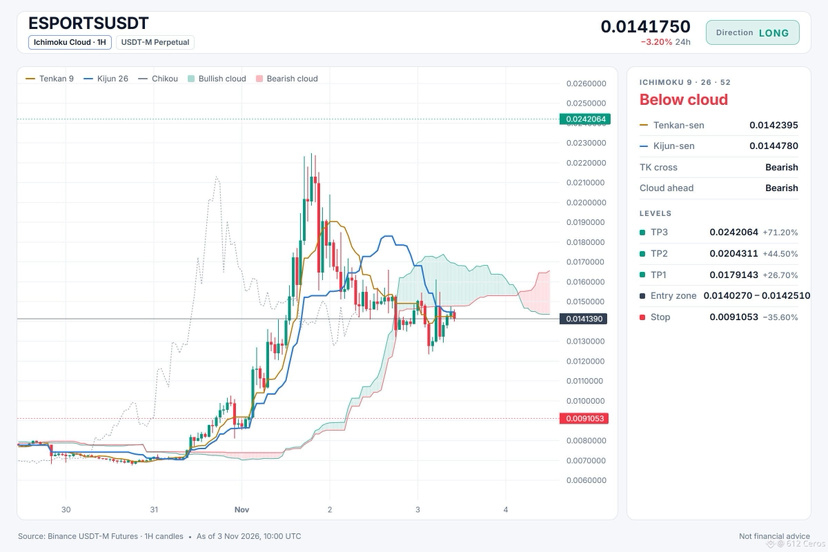
ESPORTS long setup: the levels I'm watching
🟢 LONG $ESPORTS /USDT: expecting price to go UP
Bias: LONG · Leaning
Entry: 0.0140270 – 0.0142510
TP1: 0.0179143 (+26.7%)
TP2: 0.0204311 (+44.5%)
TP3: 0.0242064 (+71.2%)
SL: 0.0091053 (-35.6%)
Plan: enter only inside the zone, close 50% at TP1, 25% at TP2, 25% at TP3, and move the stop to entry after TP1.
Note: moderate conviction only, keep size light.
Why LONG? 4/12 signals agree, 1 against.
• 4h trend up (above EMA50 & EMA200)
• 1h trend up (above EMA50 & EMA200)
• Buyers are driving the move (15m ADX 20.6)
Risk: Weaker than BTC (−2.46% 24h vs BTC)
The reasoning:
The daily trend reads range, and 4/12 signals aligned favour the long side. The plan is to work the 0.0140270 – 0.0142510 zone, scale out at 0.0179143 and 0.0204311, and stay patient for 0.0242064. A move through 0.0091053 means the idea is wrong and the stop does its job.
Does ESPORTS tag 0.0179143 first, or the stop?
{future}(ESPORTSUSDT)
ESPORTS long setup: the levels I'm watching
🟢 LONG $ESPORTS /USDT: expecting price to go UP
Bias: LONG · Leaning
Entry: 0.0140270 – 0.0142510
TP1: 0.0179143 (+26.7%)
TP2: 0.0204311 (+44.5%)
TP3: 0.0242064 (+71.2%)
SL: 0.0091053 (-35.6%)
Plan: enter only inside the zone, close 50% at TP1, 25% at TP2, 25% at TP3, and move the stop to entry after TP1.
Note: moderate conviction only, keep size light.
Why LONG? 4/12 signals agree, 1 against.
• 4h trend up (above EMA50 & EMA200)
• 1h trend up (above EMA50 & EMA200)
• Buyers are driving the move (15m ADX 20.6)
Risk: Weaker than BTC (−2.46% 24h vs BTC)
The reasoning:
The daily trend reads range, and 4/12 signals aligned favour the long side. The plan is to work the 0.0140270 – 0.0142510 zone, scale out at 0.0179143 and 0.0204311, and stay patient for 0.0242064. A move through 0.0091053 means the idea is wrong and the stop does its job.
Does ESPORTS tag 0.0179143 first, or the stop?
🟢 LONG $ESPORTS /USDT: expecting price to go UP
Bias: LONG · Leaning
Entry: 0.0140270 – 0.0142510
TP1: 0.0179143 (+26.7%)
TP2: 0.0204311 (+44.5%)
TP3: 0.0242064 (+71.2%)
SL: 0.0091053 (-35.6%)
Plan: enter only inside the zone, close 50% at TP1, 25% at TP2, 25% at TP3, and move the stop to entry after TP1.
Note: moderate conviction only, keep size light.
Why LONG? 4/12 signals agree, 1 against.
• 4h trend up (above EMA50 & EMA200)
• 1h trend up (above EMA50 & EMA200)
• Buyers are driving the move (15m ADX 20.6)
Risk: Weaker than BTC (−2.46% 24h vs BTC)
The reasoning:
The daily trend reads range, and 4/12 signals aligned favour the long side. The plan is to work the 0.0140270 – 0.0142510 zone, scale out at 0.0179143 and 0.0204311, and stay patient for 0.0242064. A move through 0.0091053 means the idea is wrong and the stop does its job.
Does ESPORTS tag 0.0179143 first, or the stop?
4
·
--
Bajista
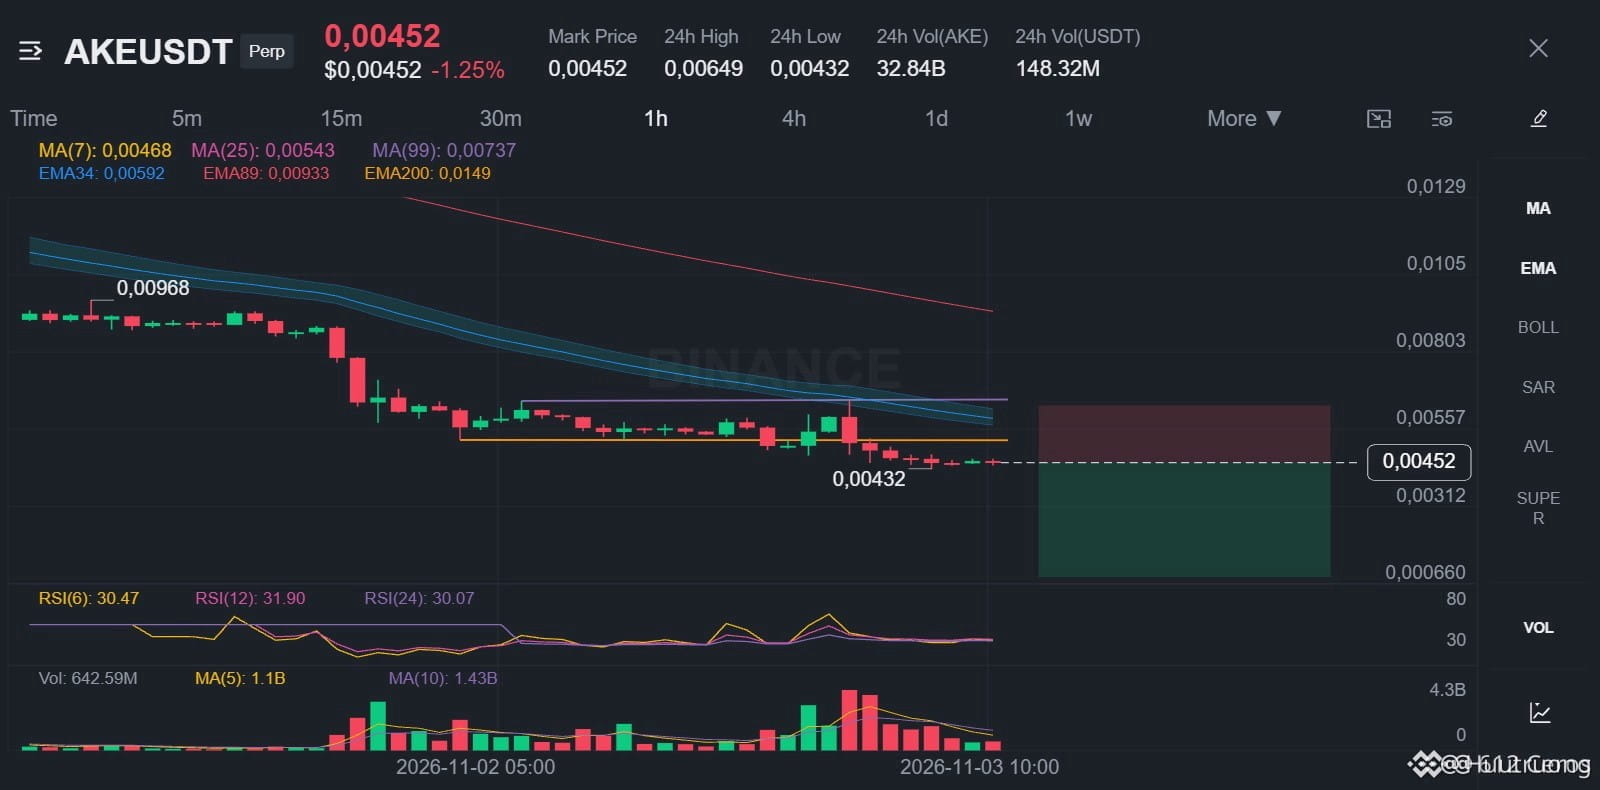
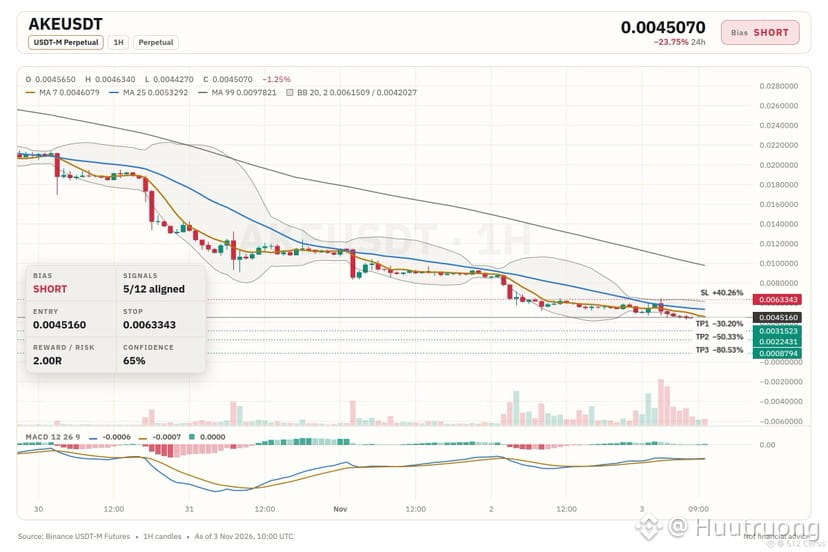
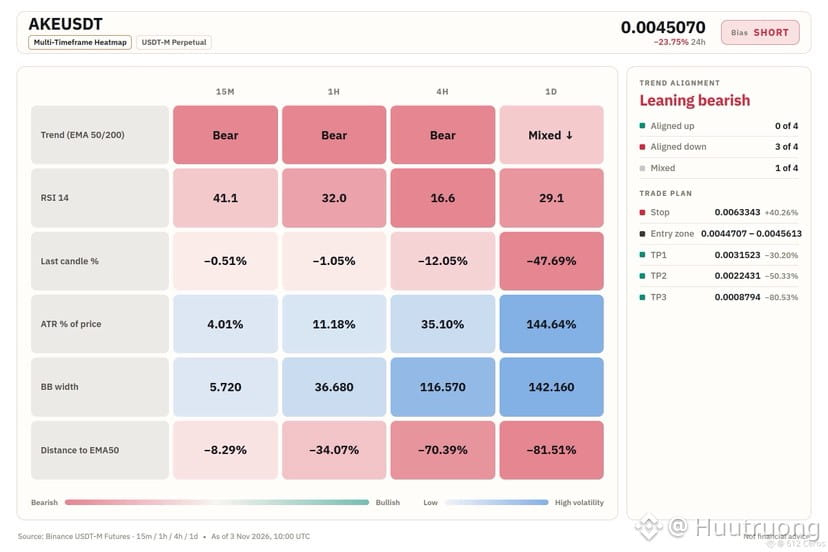
¿Está AKE atrapado dentro de una estructura bajista en 4h?
🔴 CORTO $AKE /USDT: se espera que el precio BAJE
Sesgo: CORTO · Tendencia
Entrada: 0.0044707 – 0.0045613
TP1: 0.0031523 (-30.2%)
TP2: 0.0022431 (-50.3%)
TP3: 0.0008794 (-80.5%)
SL: 0.0063343 (+40.3%)
Plan: entra solo dentro de la zona, cierra el 50% en TP1, el 25% en TP2 y el 25% en TP3, y mueve el stop al precio de entrada después de TP1.
Nota: convicción moderada; mantén un tamaño de posición pequeño.
¿Por qué CORTO? 5/12 señales coinciden, 1 está en contra.
• Tendencia bajista en 4h (por debajo de EMA50 y EMA200)
• Tendencia bajista en 1h (por debajo de EMA50 y EMA200)
• Los vendedores impulsan el movimiento (ADX de 15m: 22.9)
Riesgo: El precio está muy debilitado; desde aquí son comunes los rebotes (RSI de 4h: 16.6, sobrevendido)
P: ¿Por qué abrir una posición corta en AKE aquí?
R: La tendencia de 4h muestra que el precio está por debajo de EMA50 y EMA200: una estructura bajista.
P: ¿Cuándo sería errónea esta operación?
R: Es probable un rebote porque el precio en 1h está 4.6 ATR por debajo de su EMA50.
¿Qué nivel te haría tomar la posición opuesta?
{future}(AKEUSDT)
¿Está AKE atrapado dentro de una estructura bajista en 4h?
🔴 CORTO $AKE /USDT: se espera que el precio BAJE
Sesgo: CORTO · Tendencia
Entrada: 0.0044707 – 0.0045613
TP1: 0.0031523 (-30.2%)
TP2: 0.0022431 (-50.3%)
TP3: 0.0008794 (-80.5%)
SL: 0.0063343 (+40.3%)
Plan: entra solo dentro de la zona, cierra el 50% en TP1, el 25% en TP2 y el 25% en TP3, y mueve el stop al precio de entrada después de TP1.
Nota: convicción moderada; mantén un tamaño de posición pequeño.
¿Por qué CORTO? 5/12 señales coinciden, 1 está en contra.
• Tendencia bajista en 4h (por debajo de EMA50 y EMA200)
• Tendencia bajista en 1h (por debajo de EMA50 y EMA200)
• Los vendedores impulsan el movimiento (ADX de 15m: 22.9)
Riesgo: El precio está muy debilitado; desde aquí son comunes los rebotes (RSI de 4h: 16.6, sobrevendido)
P: ¿Por qué abrir una posición corta en AKE aquí?
R: La tendencia de 4h muestra que el precio está por debajo de EMA50 y EMA200: una estructura bajista.
P: ¿Cuándo sería errónea esta operación?
R: Es probable un rebote porque el precio en 1h está 4.6 ATR por debajo de su EMA50.
¿Qué nivel te haría tomar la posición opuesta?
🔴 CORTO $AKE /USDT: se espera que el precio BAJE
Sesgo: CORTO · Tendencia
Entrada: 0.0044707 – 0.0045613
TP1: 0.0031523 (-30.2%)
TP2: 0.0022431 (-50.3%)
TP3: 0.0008794 (-80.5%)
SL: 0.0063343 (+40.3%)
Plan: entra solo dentro de la zona, cierra el 50% en TP1, el 25% en TP2 y el 25% en TP3, y mueve el stop al precio de entrada después de TP1.
Nota: convicción moderada; mantén un tamaño de posición pequeño.
¿Por qué CORTO? 5/12 señales coinciden, 1 está en contra.
• Tendencia bajista en 4h (por debajo de EMA50 y EMA200)
• Tendencia bajista en 1h (por debajo de EMA50 y EMA200)
• Los vendedores impulsan el movimiento (ADX de 15m: 22.9)
Riesgo: El precio está muy debilitado; desde aquí son comunes los rebotes (RSI de 4h: 16.6, sobrevendido)
P: ¿Por qué abrir una posición corta en AKE aquí?
R: La tendencia de 4h muestra que el precio está por debajo de EMA50 y EMA200: una estructura bajista.
P: ¿Cuándo sería errónea esta operación?
R: Es probable un rebote porque el precio en 1h está 4.6 ATR por debajo de su EMA50.
¿Qué nivel te haría tomar la posición opuesta?
12
·
--
Bajista
Ver traducción
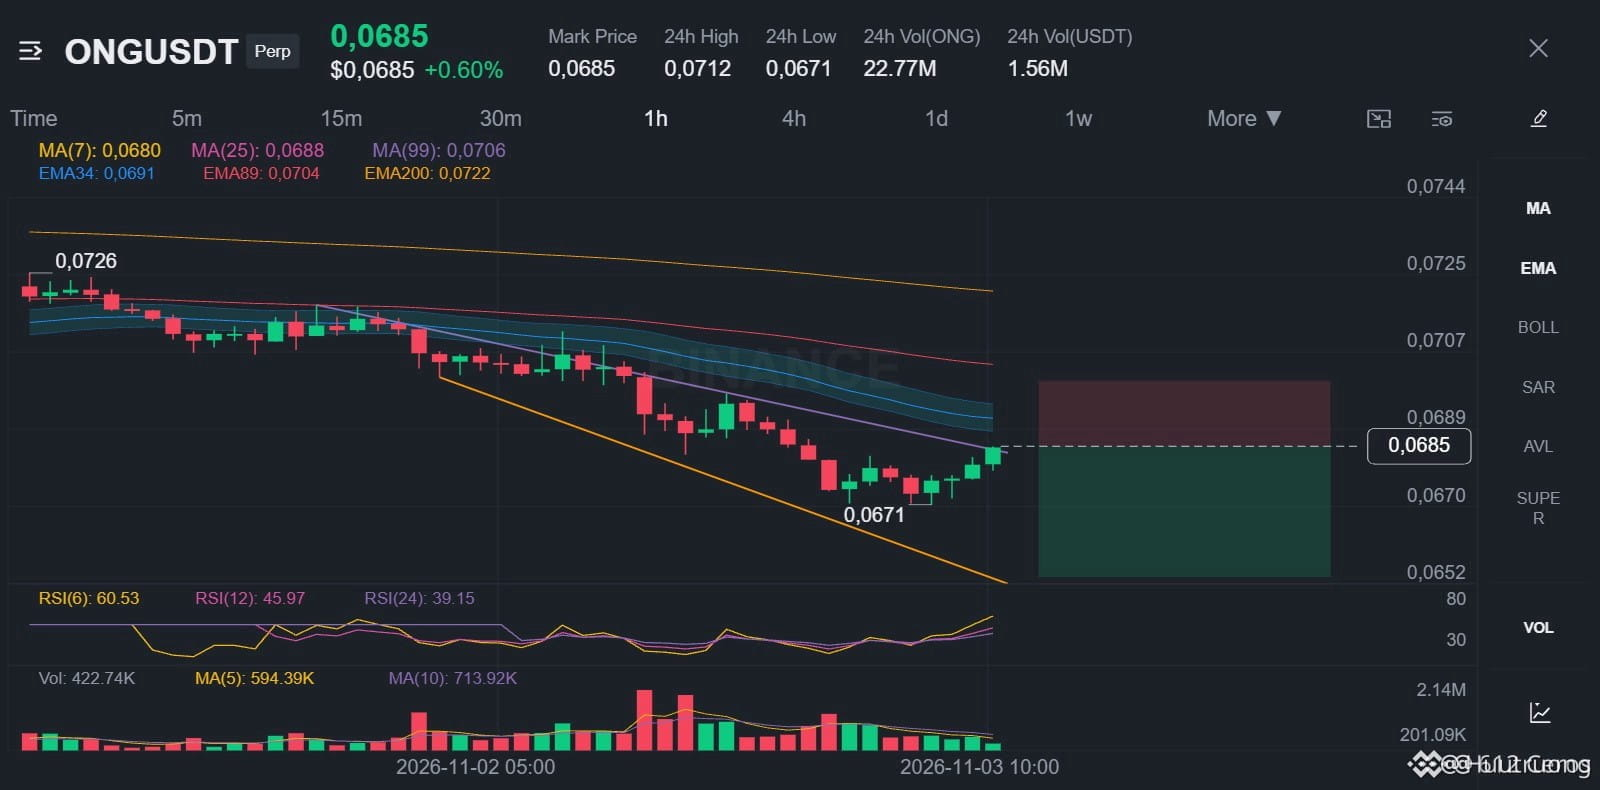
ONG keeps rallying while the stack says down.
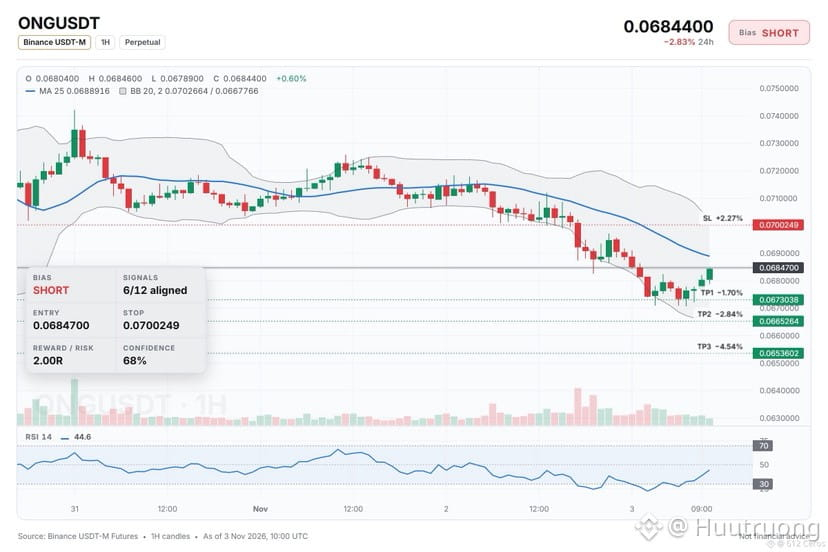
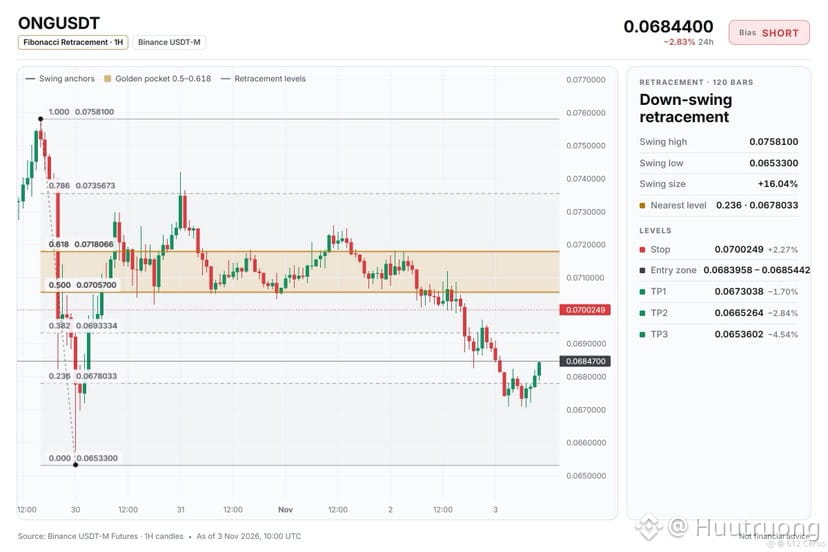
🔴 SHORT $ONG /USDT: expecting price to go DOWN
Bias: SHORT · Strong
Entry: 0.0683958 – 0.0685442
TP1: 0.0673038 (-1.7%)
TP2: 0.0665264 (-2.8%)
TP3: 0.0653602 (-4.5%)
SL: 0.0700249 (+2.3%)
Plan: enter only inside the zone, close 50% at TP1, 25% at TP2, 25% at TP3, and move the stop to entry after TP1.
Why SHORT? 6/12 signals agree, 1 against.
• 4h trend down (below EMA50 & EMA200)
• 1h trend down (below EMA50 & EMA200)
• Sellers have the momentum (4h RSI 31.6)
Risk: Buyers are pushing right now (+0.10% 15m candle)
Why I like it:
The 4h price sits below a bearish stack, and the 1h trend is also down. The 4h RSI is at 31.6, meaning sellers have momentum, while the 1h RSI is at 44.6, still favoring sellers. ONG is underperforming BTC by 2.00% over the last day, confirming relative weakness.
Where do you set your invalidation for this short?
{spot}(ONGUSDT)
ONG keeps rallying while the stack says down.
🔴 SHORT $ONG /USDT: expecting price to go DOWN
Bias: SHORT · Strong
Entry: 0.0683958 – 0.0685442
TP1: 0.0673038 (-1.7%)
TP2: 0.0665264 (-2.8%)
TP3: 0.0653602 (-4.5%)
SL: 0.0700249 (+2.3%)
Plan: enter only inside the zone, close 50% at TP1, 25% at TP2, 25% at TP3, and move the stop to entry after TP1.
Why SHORT? 6/12 signals agree, 1 against.
• 4h trend down (below EMA50 & EMA200)
• 1h trend down (below EMA50 & EMA200)
• Sellers have the momentum (4h RSI 31.6)
Risk: Buyers are pushing right now (+0.10% 15m candle)
Why I like it:
The 4h price sits below a bearish stack, and the 1h trend is also down. The 4h RSI is at 31.6, meaning sellers have momentum, while the 1h RSI is at 44.6, still favoring sellers. ONG is underperforming BTC by 2.00% over the last day, confirming relative weakness.
Where do you set your invalidation for this short?
🔴 SHORT $ONG /USDT: expecting price to go DOWN
Bias: SHORT · Strong
Entry: 0.0683958 – 0.0685442
TP1: 0.0673038 (-1.7%)
TP2: 0.0665264 (-2.8%)
TP3: 0.0653602 (-4.5%)
SL: 0.0700249 (+2.3%)
Plan: enter only inside the zone, close 50% at TP1, 25% at TP2, 25% at TP3, and move the stop to entry after TP1.
Why SHORT? 6/12 signals agree, 1 against.
• 4h trend down (below EMA50 & EMA200)
• 1h trend down (below EMA50 & EMA200)
• Sellers have the momentum (4h RSI 31.6)
Risk: Buyers are pushing right now (+0.10% 15m candle)
Why I like it:
The 4h price sits below a bearish stack, and the 1h trend is also down. The 4h RSI is at 31.6, meaning sellers have momentum, while the 1h RSI is at 44.6, still favoring sellers. ONG is underperforming BTC by 2.00% over the last day, confirming relative weakness.
Where do you set your invalidation for this short?
11
·
--
Bajista
Ver traducción
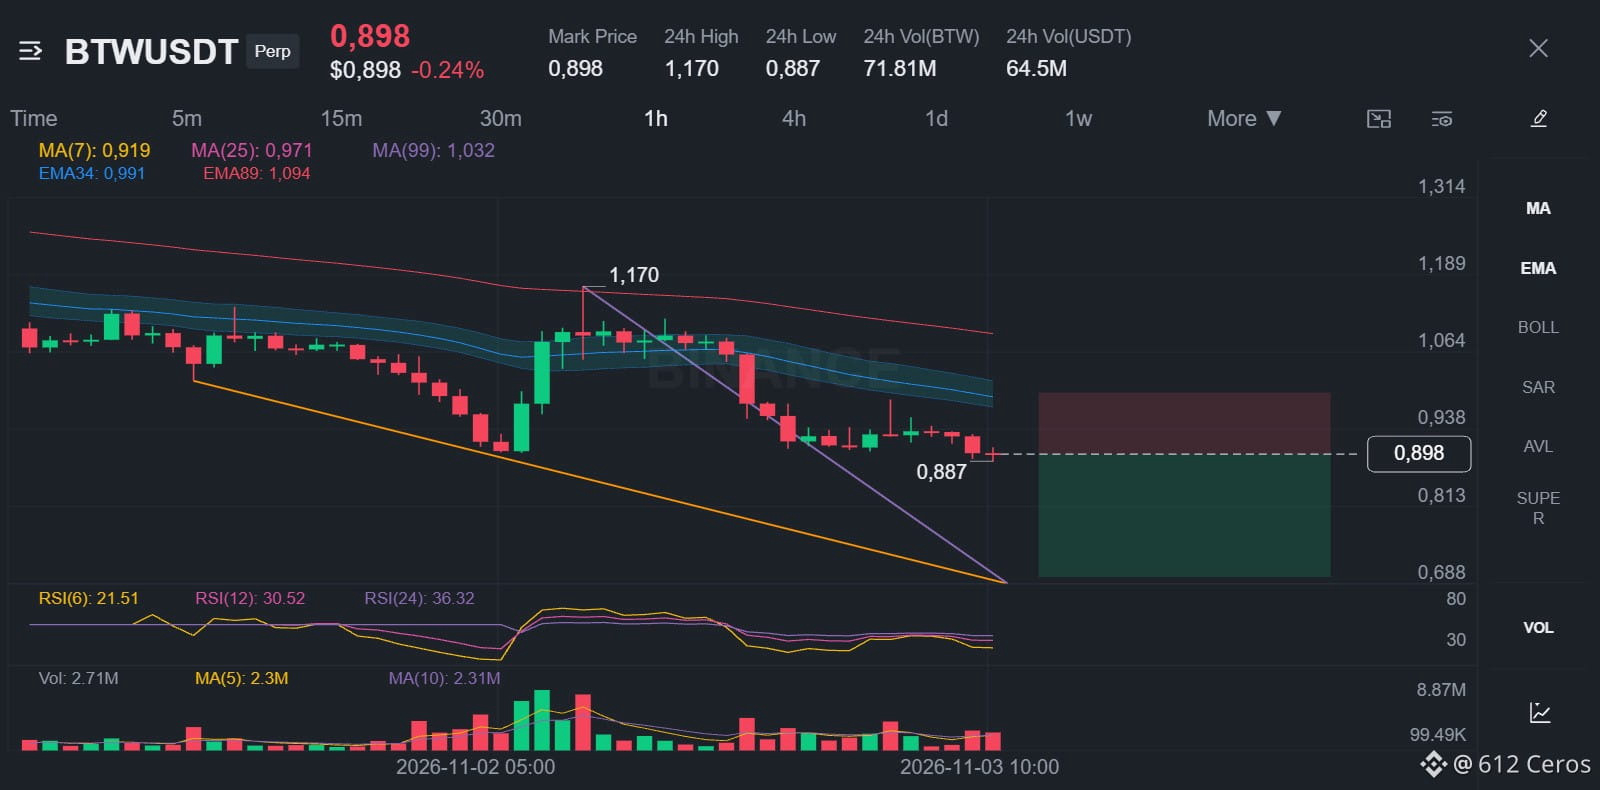
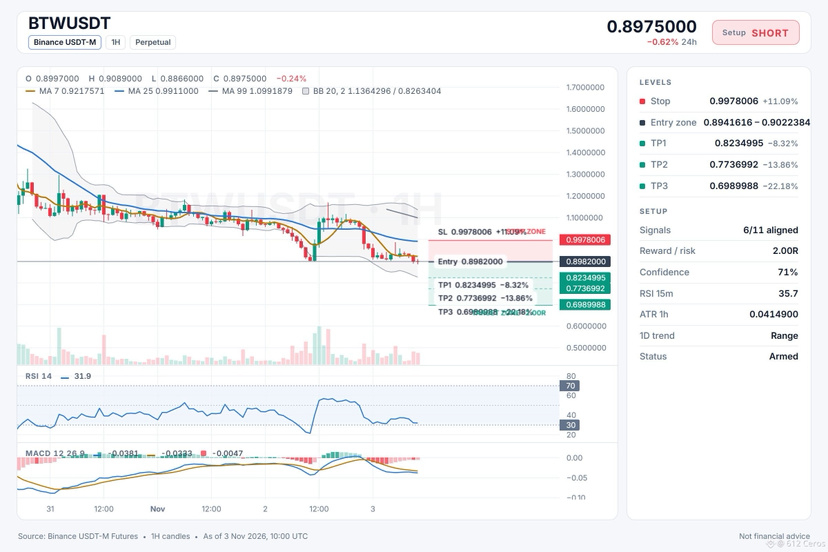
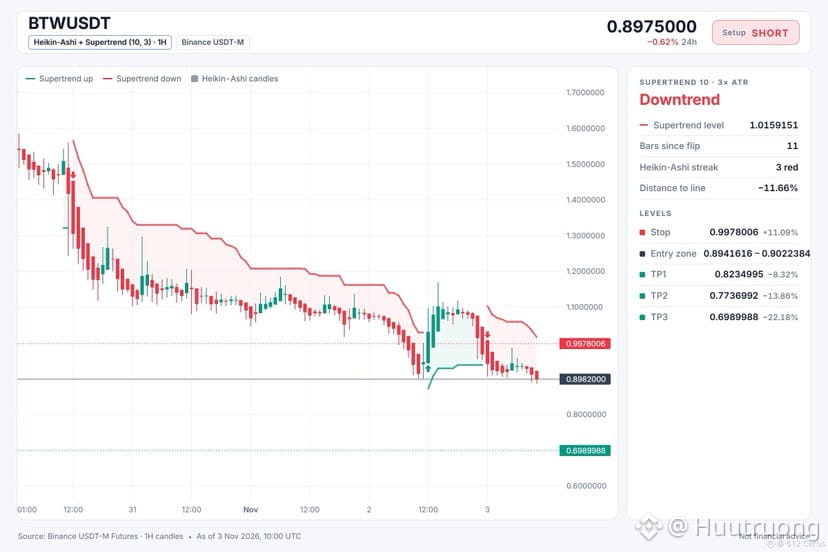
🔴 SHORT $BTW /USDT: expecting price to go DOWN
Bias: SHORT · Strong
Entry: 0.8941616 – 0.9022384
TP1: 0.8234995 (-8.3%)
TP2: 0.7736992 (-13.9%)
TP3: 0.6989988 (-22.2%)
SL: 0.9978006 (+11.1%)
Plan: enter only inside the zone, close 50% at TP1, 25% at TP2, 25% at TP3, and move the stop to entry after TP1.
Range-bound coins can still drop hard.
Why SHORT? 6/11 signals agree, 1 against.
• 4h trend down (below EMA50 & EMA200)
• 1h trend down (below EMA50 & EMA200)
• Sellers are driving the move (15m ADX 23.3)
Risk: Far below its average, bounce likely (−3.0 ATR from 1h EMA50)
The 4h trend shows price below both EMAs in a bearish stack, with 1h RSI at 31.9 confirming sellers are in control.
Where would you set your invalidation level?
{future}(BTWUSDT)
🔴 SHORT $BTW /USDT: expecting price to go DOWN
Bias: SHORT · Strong
Entry: 0.8941616 – 0.9022384
TP1: 0.8234995 (-8.3%)
TP2: 0.7736992 (-13.9%)
TP3: 0.6989988 (-22.2%)
SL: 0.9978006 (+11.1%)
Plan: enter only inside the zone, close 50% at TP1, 25% at TP2, 25% at TP3, and move the stop to entry after TP1.
Range-bound coins can still drop hard.
Why SHORT? 6/11 signals agree, 1 against.
• 4h trend down (below EMA50 & EMA200)
• 1h trend down (below EMA50 & EMA200)
• Sellers are driving the move (15m ADX 23.3)
Risk: Far below its average, bounce likely (−3.0 ATR from 1h EMA50)
The 4h trend shows price below both EMAs in a bearish stack, with 1h RSI at 31.9 confirming sellers are in control.
Where would you set your invalidation level?
Bias: SHORT · Strong
Entry: 0.8941616 – 0.9022384
TP1: 0.8234995 (-8.3%)
TP2: 0.7736992 (-13.9%)
TP3: 0.6989988 (-22.2%)
SL: 0.9978006 (+11.1%)
Plan: enter only inside the zone, close 50% at TP1, 25% at TP2, 25% at TP3, and move the stop to entry after TP1.
Range-bound coins can still drop hard.
Why SHORT? 6/11 signals agree, 1 against.
• 4h trend down (below EMA50 & EMA200)
• 1h trend down (below EMA50 & EMA200)
• Sellers are driving the move (15m ADX 23.3)
Risk: Far below its average, bounce likely (−3.0 ATR from 1h EMA50)
The 4h trend shows price below both EMAs in a bearish stack, with 1h RSI at 31.9 confirming sellers are in control.
Where would you set your invalidation level?
8
·
--
Bajista
La moneda está atrapada debajo de una alineación bajista.
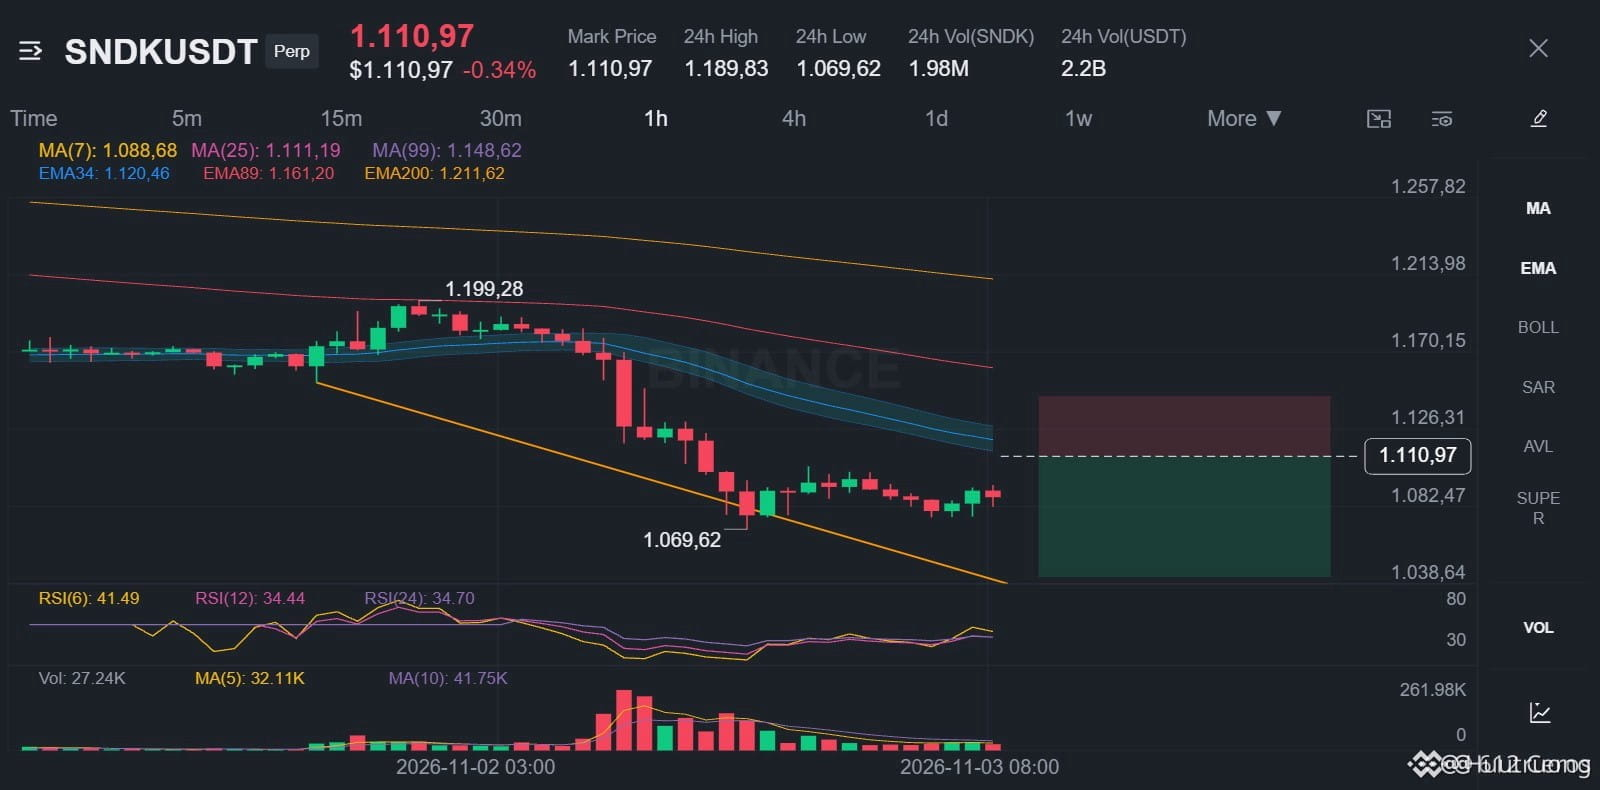
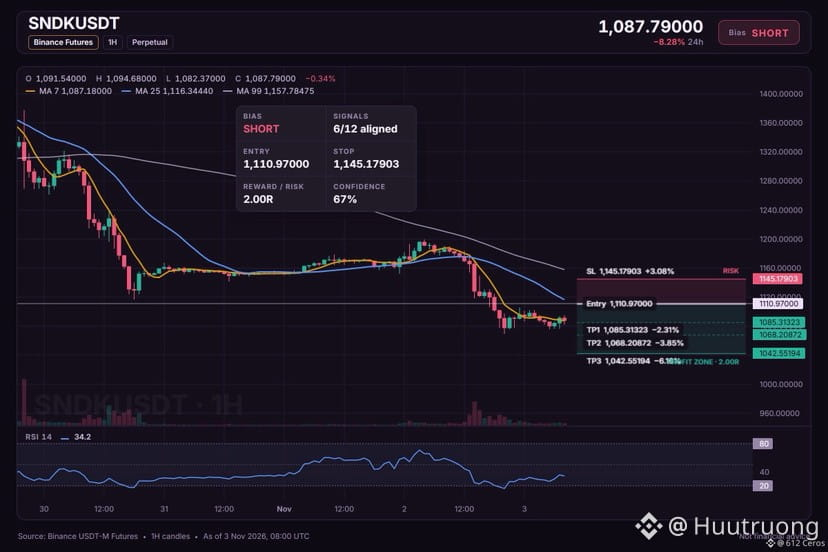
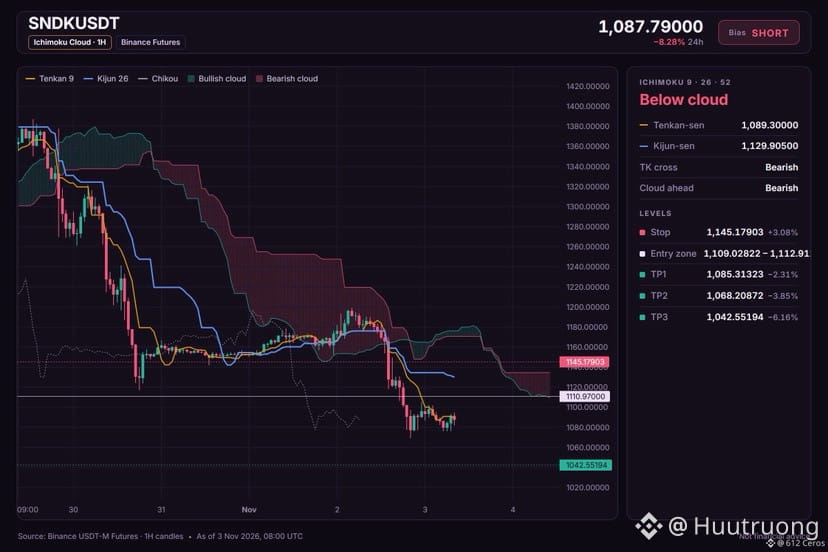
🔴 CORTO $SNDK /USDT: se espera que el precio BAJE
Sesgo: CORTO · Fuerte
Entrada: 1109.02822 – 1112.91178
TP1: 1085.31323 (-2.3%)
TP2: 1068.20872 (-3.8%)
TP3: 1042.55194 (-6.2%)
SL: 1145.17903 (+3.1%)
Plan: entrar solo dentro de la zona, cerrar el 50% en TP1, el 25% en TP2 y el 25% en TP3, y mover el stop al precio de entrada después de TP1.
¿Por qué CORTO? Lista de verificación de SNDK: 6/12 están de acuerdo, 2 en contra.
• Tendencia diaria bajista (por debajo de EMA50 y EMA200)
• Tendencia de 4 h bajista (por debajo de EMA50 y EMA200)
• Tendencia de 1 h bajista (por debajo de EMA50 y EMA200)
Atención: Los compradores están impulsando el movimiento (ADX de 15 min: 25.2)
Atención: La idea queda invalidada si el precio alcanza el stop en 1145.17903
En resumen: Las alineaciones bajistas diaria, de 4 h y de 1 h muestran que la tendencia es bajista, pero el ADX de 15 min indica que los compradores están impulsando el movimiento.
¿Qué nivel te haría tomar la posición contraria?
{future}(SNDKUSDT)
La moneda está atrapada debajo de una alineación bajista.
🔴 CORTO $SNDK /USDT: se espera que el precio BAJE
Sesgo: CORTO · Fuerte
Entrada: 1109.02822 – 1112.91178
TP1: 1085.31323 (-2.3%)
TP2: 1068.20872 (-3.8%)
TP3: 1042.55194 (-6.2%)
SL: 1145.17903 (+3.1%)
Plan: entrar solo dentro de la zona, cerrar el 50% en TP1, el 25% en TP2 y el 25% en TP3, y mover el stop al precio de entrada después de TP1.
¿Por qué CORTO? Lista de verificación de SNDK: 6/12 están de acuerdo, 2 en contra.
• Tendencia diaria bajista (por debajo de EMA50 y EMA200)
• Tendencia de 4 h bajista (por debajo de EMA50 y EMA200)
• Tendencia de 1 h bajista (por debajo de EMA50 y EMA200)
Atención: Los compradores están impulsando el movimiento (ADX de 15 min: 25.2)
Atención: La idea queda invalidada si el precio alcanza el stop en 1145.17903
En resumen: Las alineaciones bajistas diaria, de 4 h y de 1 h muestran que la tendencia es bajista, pero el ADX de 15 min indica que los compradores están impulsando el movimiento.
¿Qué nivel te haría tomar la posición contraria?
🔴 CORTO $SNDK /USDT: se espera que el precio BAJE
Sesgo: CORTO · Fuerte
Entrada: 1109.02822 – 1112.91178
TP1: 1085.31323 (-2.3%)
TP2: 1068.20872 (-3.8%)
TP3: 1042.55194 (-6.2%)
SL: 1145.17903 (+3.1%)
Plan: entrar solo dentro de la zona, cerrar el 50% en TP1, el 25% en TP2 y el 25% en TP3, y mover el stop al precio de entrada después de TP1.
¿Por qué CORTO? Lista de verificación de SNDK: 6/12 están de acuerdo, 2 en contra.
• Tendencia diaria bajista (por debajo de EMA50 y EMA200)
• Tendencia de 4 h bajista (por debajo de EMA50 y EMA200)
• Tendencia de 1 h bajista (por debajo de EMA50 y EMA200)
Atención: Los compradores están impulsando el movimiento (ADX de 15 min: 25.2)
Atención: La idea queda invalidada si el precio alcanza el stop en 1145.17903
En resumen: Las alineaciones bajistas diaria, de 4 h y de 1 h muestran que la tendencia es bajista, pero el ADX de 15 min indica que los compradores están impulsando el movimiento.
¿Qué nivel te haría tomar la posición contraria?
8
·
--
Bajista
Ver traducción
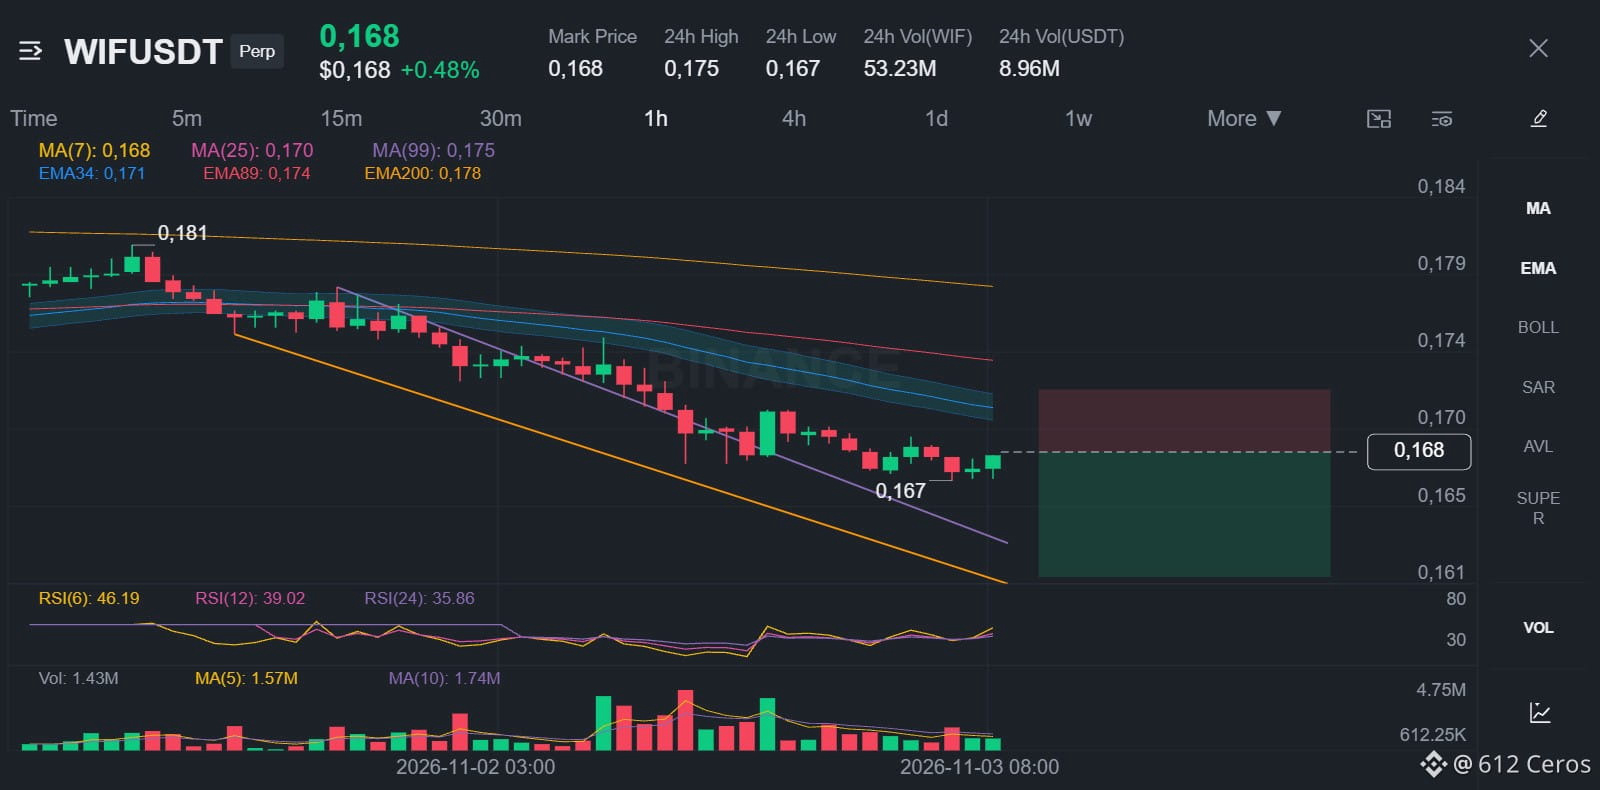
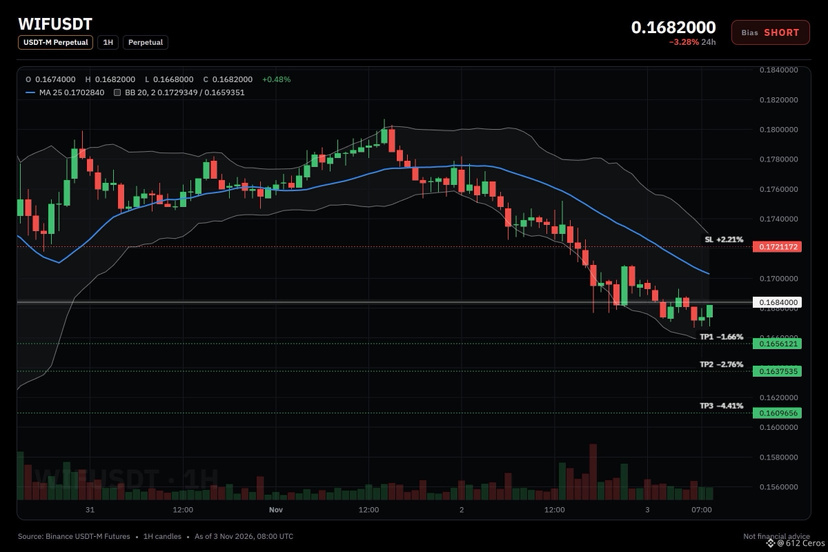
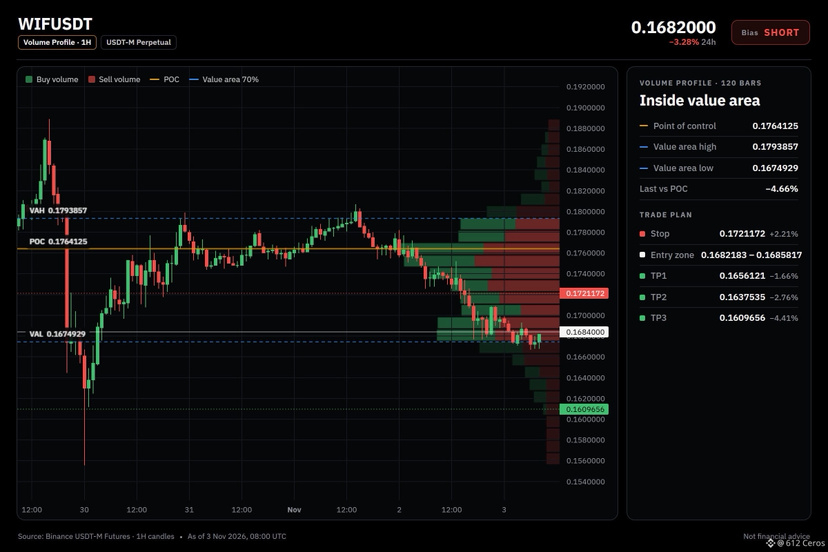
WIF short setup: the levels I'm watching
🔴 SHORT $WIF /USDT: expecting price to go DOWN
Bias: SHORT · Strong
Entry: 0.1682183 – 0.1685817
TP1: 0.1656121 (-1.7%)
TP2: 0.1637535 (-2.8%)
TP3: 0.1609656 (-4.4%)
SL: 0.1721172 (+2.2%)
Plan: enter only inside the zone, close 50% at TP1, 25% at TP2, 25% at TP3, and move the stop to entry after TP1.
Why SHORT? 7/12 signals agree, 0 against.
• Daily trend down (below EMA50 & EMA200)
• 4h trend down (below EMA50 & EMA200)
• 1h trend down (below EMA50 & EMA200)
In plain words:
The daily trend reads bearish, and 7/12 signals aligned favour the short side. The plan is to work the 0.1682183 – 0.1685817 zone, scale out at 0.1656121 and 0.1637535, and stay patient for 0.1609656. A move through 0.1721172 means the idea is wrong and the stop does its job.
Does WIF tag 0.1656121 first, or the stop?
{spot}(WIFUSDT)
WIF short setup: the levels I'm watching
🔴 SHORT $WIF /USDT: expecting price to go DOWN
Bias: SHORT · Strong
Entry: 0.1682183 – 0.1685817
TP1: 0.1656121 (-1.7%)
TP2: 0.1637535 (-2.8%)
TP3: 0.1609656 (-4.4%)
SL: 0.1721172 (+2.2%)
Plan: enter only inside the zone, close 50% at TP1, 25% at TP2, 25% at TP3, and move the stop to entry after TP1.
Why SHORT? 7/12 signals agree, 0 against.
• Daily trend down (below EMA50 & EMA200)
• 4h trend down (below EMA50 & EMA200)
• 1h trend down (below EMA50 & EMA200)
In plain words:
The daily trend reads bearish, and 7/12 signals aligned favour the short side. The plan is to work the 0.1682183 – 0.1685817 zone, scale out at 0.1656121 and 0.1637535, and stay patient for 0.1609656. A move through 0.1721172 means the idea is wrong and the stop does its job.
Does WIF tag 0.1656121 first, or the stop?
🔴 SHORT $WIF /USDT: expecting price to go DOWN
Bias: SHORT · Strong
Entry: 0.1682183 – 0.1685817
TP1: 0.1656121 (-1.7%)
TP2: 0.1637535 (-2.8%)
TP3: 0.1609656 (-4.4%)
SL: 0.1721172 (+2.2%)
Plan: enter only inside the zone, close 50% at TP1, 25% at TP2, 25% at TP3, and move the stop to entry after TP1.
Why SHORT? 7/12 signals agree, 0 against.
• Daily trend down (below EMA50 & EMA200)
• 4h trend down (below EMA50 & EMA200)
• 1h trend down (below EMA50 & EMA200)
In plain words:
The daily trend reads bearish, and 7/12 signals aligned favour the short side. The plan is to work the 0.1682183 – 0.1685817 zone, scale out at 0.1656121 and 0.1637535, and stay patient for 0.1609656. A move through 0.1721172 means the idea is wrong and the stop does its job.
Does WIF tag 0.1656121 first, or the stop?
39
·
--
Bajista
Ver traducción
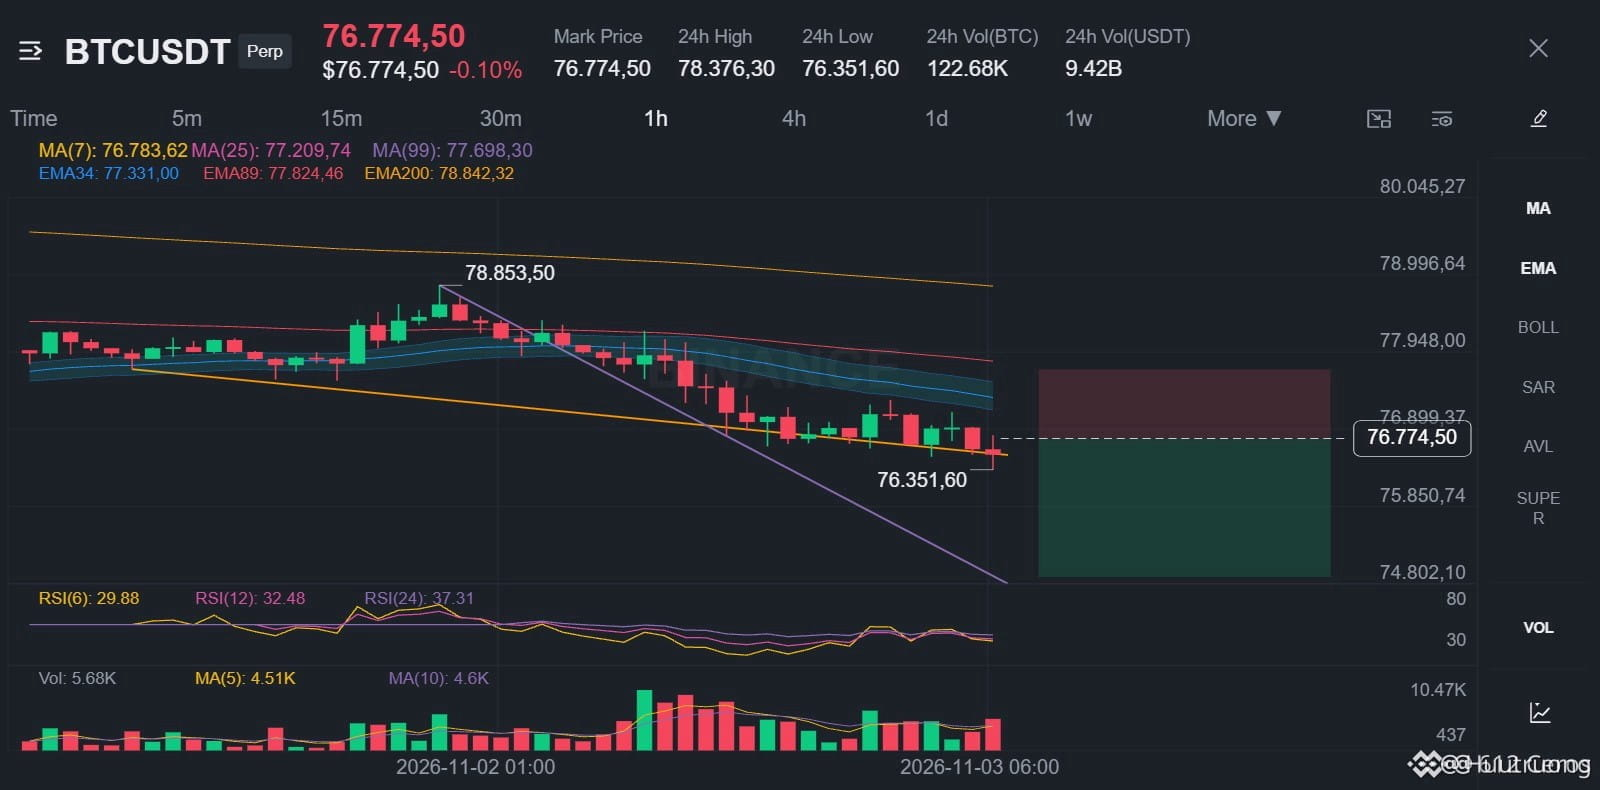
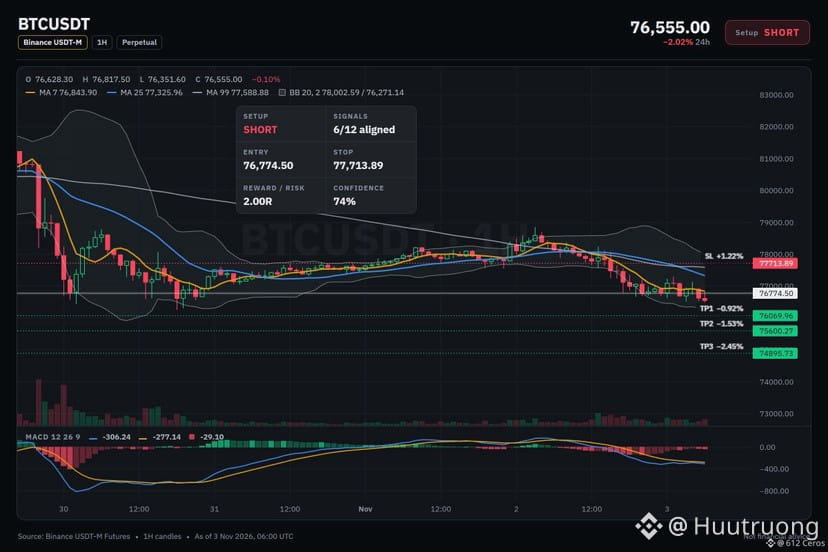
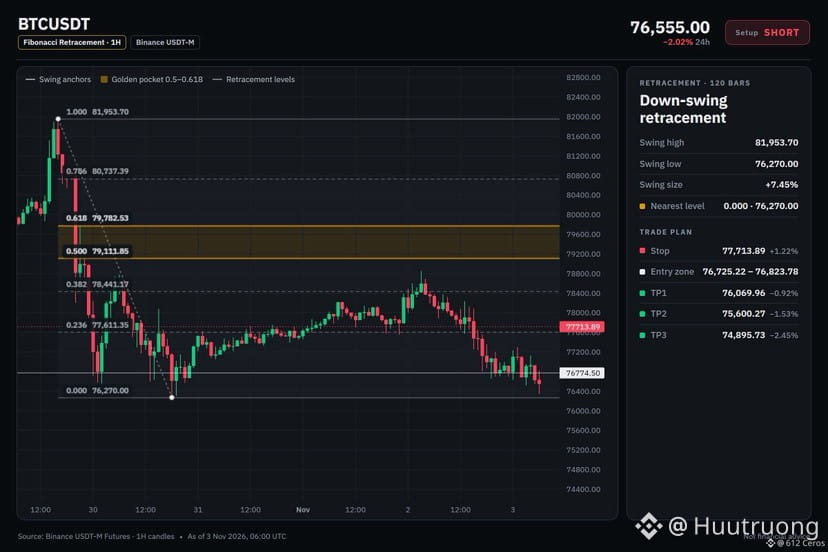
🔴 SHORT $BTC /USDT: expecting price to go DOWN
Bias: SHORT · Strong
Entry: 76725.22 – 76823.78
TP1: 76069.96 (-0.9%)
TP2: 75600.27 (-1.5%)
TP3: 74895.73 (-2.4%)
SL: 77713.89 (+1.2%)
Plan: enter only inside the zone, close 50% at TP1, 25% at TP2, 25% at TP3, and move the stop to entry after TP1.
4h bearish stack holds on BTC
Why SHORT? 6/12 signals agree, 0 against.
• 4h trend down (below EMA50 & EMA200)
• 1h trend down (below EMA50 & EMA200)
• Sellers are driving the move (15m ADX 24.5)
BTC is below the EMA50 and EMA200 on the 4h chart, confirming the swing trend is down. The 1h chart shows the same bearish stack and sellers are in control with ADX 24.5 and DI− at 30.7.
Where do you want your invalidation on BTC?
{spot}(BTCUSDT)
🔴 SHORT $BTC /USDT: expecting price to go DOWN
Bias: SHORT · Strong
Entry: 76725.22 – 76823.78
TP1: 76069.96 (-0.9%)
TP2: 75600.27 (-1.5%)
TP3: 74895.73 (-2.4%)
SL: 77713.89 (+1.2%)
Plan: enter only inside the zone, close 50% at TP1, 25% at TP2, 25% at TP3, and move the stop to entry after TP1.
4h bearish stack holds on BTC
Why SHORT? 6/12 signals agree, 0 against.
• 4h trend down (below EMA50 & EMA200)
• 1h trend down (below EMA50 & EMA200)
• Sellers are driving the move (15m ADX 24.5)
BTC is below the EMA50 and EMA200 on the 4h chart, confirming the swing trend is down. The 1h chart shows the same bearish stack and sellers are in control with ADX 24.5 and DI− at 30.7.
Where do you want your invalidation on BTC?
Bias: SHORT · Strong
Entry: 76725.22 – 76823.78
TP1: 76069.96 (-0.9%)
TP2: 75600.27 (-1.5%)
TP3: 74895.73 (-2.4%)
SL: 77713.89 (+1.2%)
Plan: enter only inside the zone, close 50% at TP1, 25% at TP2, 25% at TP3, and move the stop to entry after TP1.
4h bearish stack holds on BTC
Why SHORT? 6/12 signals agree, 0 against.
• 4h trend down (below EMA50 & EMA200)
• 1h trend down (below EMA50 & EMA200)
• Sellers are driving the move (15m ADX 24.5)
BTC is below the EMA50 and EMA200 on the 4h chart, confirming the swing trend is down. The 1h chart shows the same bearish stack and sellers are in control with ADX 24.5 and DI− at 30.7.
Where do you want your invalidation on BTC?
29
·
--
Bajista
Ver traducción
BNB is ignoring the daily range and sliding
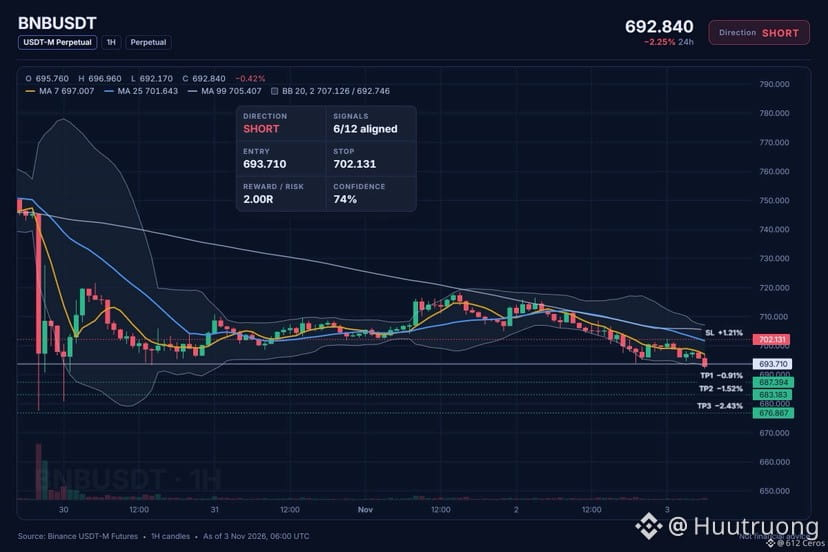
🔴 SHORT $BNB /USDT: expecting price to go DOWN
Bias: SHORT · Strong
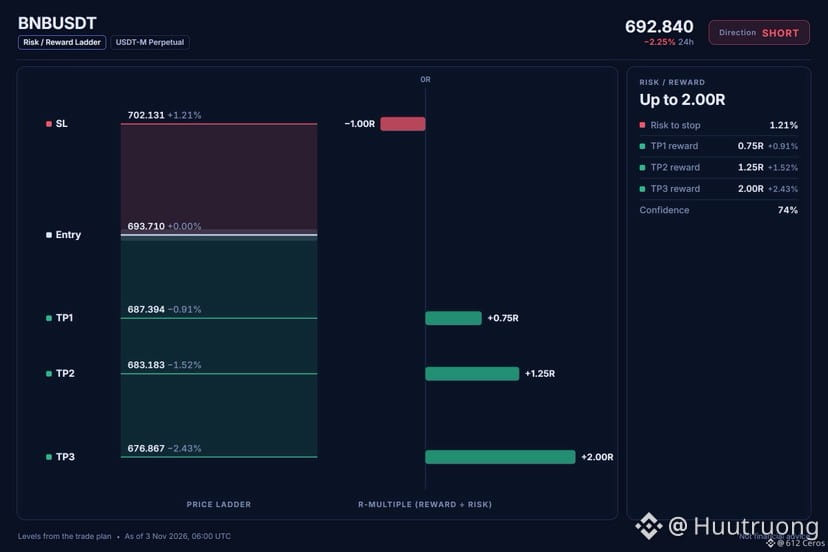
Entry: 693.272 – 694.148
TP1: 687.394 (-0.9%)
TP2: 683.183 (-1.5%)
TP3: 676.867 (-2.4%)
SL: 702.131 (+1.2%)
Plan: enter only inside the zone, close 50% at TP1, 25% at TP2, 25% at TP3, and move the stop to entry after TP1.
Why SHORT? 6/12 signals agree, 0 against.
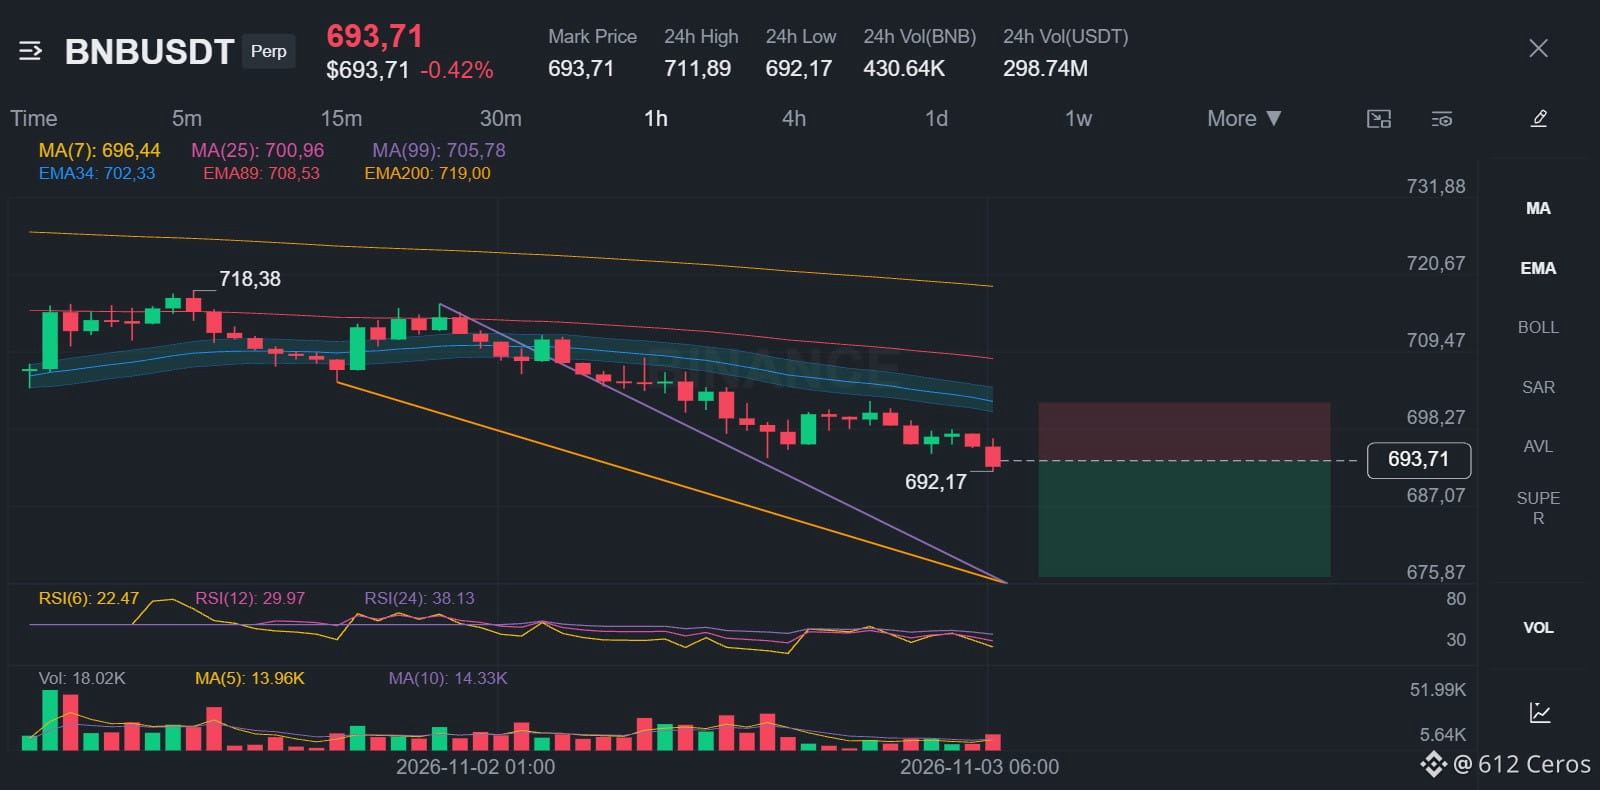
• 4h trend down (below EMA50 & EMA200)
• 1h trend down (below EMA50 & EMA200)
• Sellers are driving the move (15m ADX 29.9)
In plain words:
The 1h price is below both its EMA50 and EMA200, a bearish stack that has held through the recent bounce. Sellers are in control on the 4h trend and the 1h trend, with the 1h RSI at 30.9 showing continued bearish momentum. The 4h RSI is also below 45 at 37.5, confirming the short-term slide. The 15m ADX reads 29.9 with the DI minus at 36.3 far above the DI plus at 12.6, meaning the selling pressure is dominant and driving the move. BTC is trending bearish and the correlation sits at 0.84, so BNB tends to follow that weakness.
Where would you place your own invalidation level?
{spot}(BNBUSDT)
BNB is ignoring the daily range and sliding
🔴 SHORT $BNB /USDT: expecting price to go DOWN
Bias: SHORT · Strong
Entry: 693.272 – 694.148
TP1: 687.394 (-0.9%)
TP2: 683.183 (-1.5%)
TP3: 676.867 (-2.4%)
SL: 702.131 (+1.2%)
Plan: enter only inside the zone, close 50% at TP1, 25% at TP2, 25% at TP3, and move the stop to entry after TP1.
Why SHORT? 6/12 signals agree, 0 against.
• 4h trend down (below EMA50 & EMA200)
• 1h trend down (below EMA50 & EMA200)
• Sellers are driving the move (15m ADX 29.9)
In plain words:
The 1h price is below both its EMA50 and EMA200, a bearish stack that has held through the recent bounce. Sellers are in control on the 4h trend and the 1h trend, with the 1h RSI at 30.9 showing continued bearish momentum. The 4h RSI is also below 45 at 37.5, confirming the short-term slide. The 15m ADX reads 29.9 with the DI minus at 36.3 far above the DI plus at 12.6, meaning the selling pressure is dominant and driving the move. BTC is trending bearish and the correlation sits at 0.84, so BNB tends to follow that weakness.
Where would you place your own invalidation level?
🔴 SHORT $BNB /USDT: expecting price to go DOWN
Bias: SHORT · Strong
Entry: 693.272 – 694.148
TP1: 687.394 (-0.9%)
TP2: 683.183 (-1.5%)
TP3: 676.867 (-2.4%)
SL: 702.131 (+1.2%)
Plan: enter only inside the zone, close 50% at TP1, 25% at TP2, 25% at TP3, and move the stop to entry after TP1.
Why SHORT? 6/12 signals agree, 0 against.
• 4h trend down (below EMA50 & EMA200)
• 1h trend down (below EMA50 & EMA200)
• Sellers are driving the move (15m ADX 29.9)
In plain words:
The 1h price is below both its EMA50 and EMA200, a bearish stack that has held through the recent bounce. Sellers are in control on the 4h trend and the 1h trend, with the 1h RSI at 30.9 showing continued bearish momentum. The 4h RSI is also below 45 at 37.5, confirming the short-term slide. The 15m ADX reads 29.9 with the DI minus at 36.3 far above the DI plus at 12.6, meaning the selling pressure is dominant and driving the move. BTC is trending bearish and the correlation sits at 0.84, so BNB tends to follow that weakness.
Where would you place your own invalidation level?
46
·
--
Bajista
Ver traducción
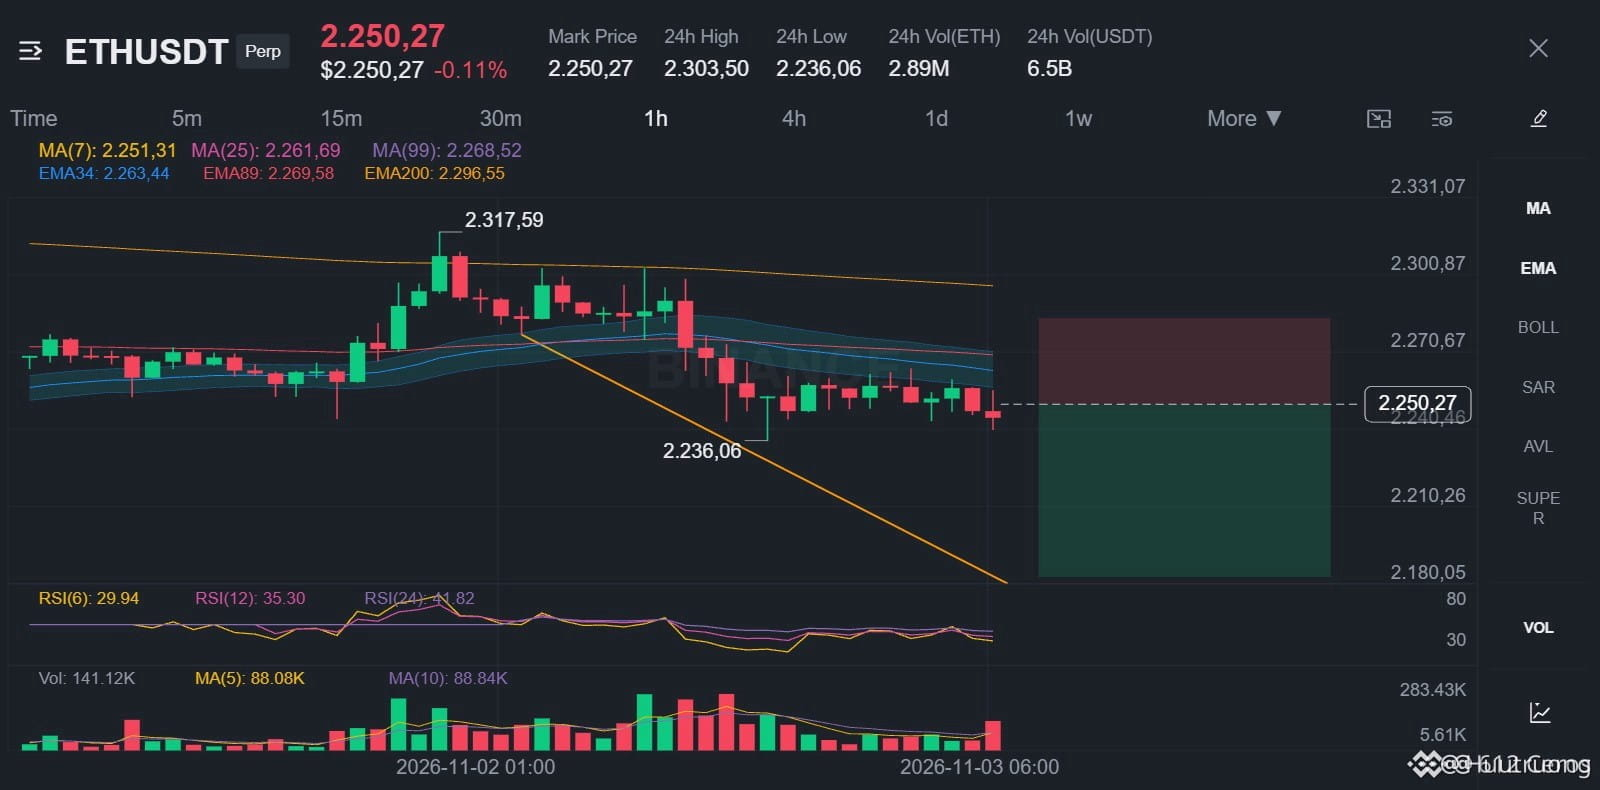
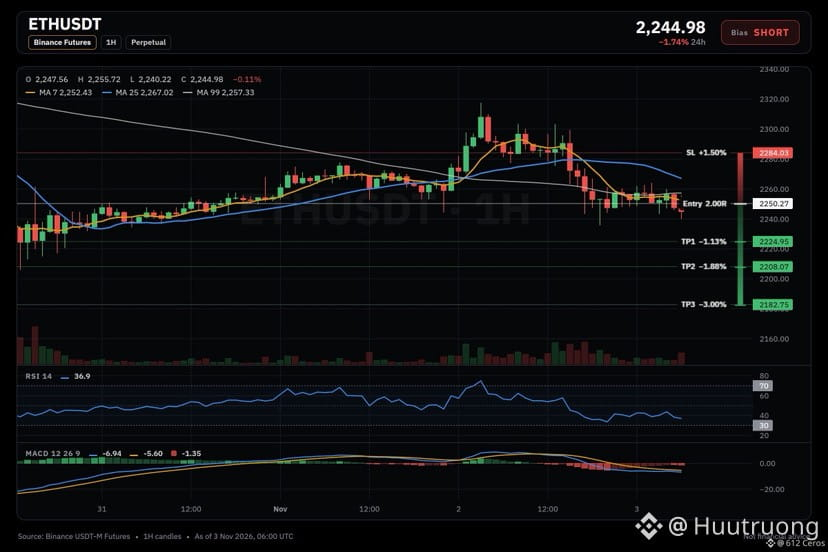
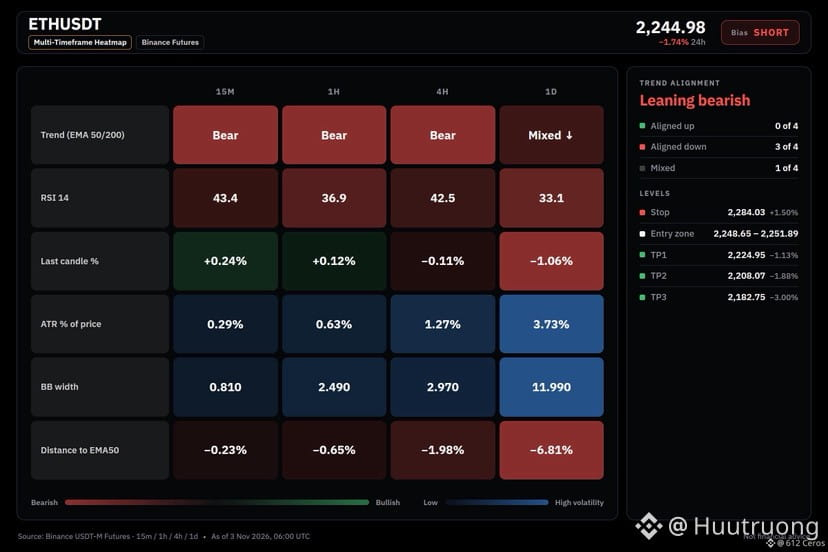
ETH is sliding below its bearish 4h stack
🔴 SHORT $ETH /USDT: expecting price to go DOWN
Bias: SHORT · Leaning
Entry: 2248.65 – 2251.89
TP1: 2224.95 (-1.1%)
TP2: 2208.07 (-1.9%)
TP3: 2182.75 (-3.0%)
SL: 2284.03 (+1.5%)
Plan: enter only inside the zone, close 50% at TP1, 25% at TP2, 25% at TP3, and move the stop to entry after TP1.
Note: moderate conviction only, keep size light.
Why SHORT? 5/12 signals agree, 0 against.
• 4h trend down (below EMA50 & EMA200)
• 1h trend down (below EMA50 & EMA200)
• BTC is falling, this coin follows (corr 0.90)
If it plays out:
Price should keep falling toward 2224.95 and 2208.07 if the 4h trend stays down.
If it fails:
A close above 2284.03 would prove sellers are losing control and I would exit the short.
What level would make you hesitate on this short?
{spot}(ETHUSDT)
ETH is sliding below its bearish 4h stack
🔴 SHORT $ETH /USDT: expecting price to go DOWN
Bias: SHORT · Leaning
Entry: 2248.65 – 2251.89
TP1: 2224.95 (-1.1%)
TP2: 2208.07 (-1.9%)
TP3: 2182.75 (-3.0%)
SL: 2284.03 (+1.5%)
Plan: enter only inside the zone, close 50% at TP1, 25% at TP2, 25% at TP3, and move the stop to entry after TP1.
Note: moderate conviction only, keep size light.
Why SHORT? 5/12 signals agree, 0 against.
• 4h trend down (below EMA50 & EMA200)
• 1h trend down (below EMA50 & EMA200)
• BTC is falling, this coin follows (corr 0.90)
If it plays out:
Price should keep falling toward 2224.95 and 2208.07 if the 4h trend stays down.
If it fails:
A close above 2284.03 would prove sellers are losing control and I would exit the short.
What level would make you hesitate on this short?
🔴 SHORT $ETH /USDT: expecting price to go DOWN
Bias: SHORT · Leaning
Entry: 2248.65 – 2251.89
TP1: 2224.95 (-1.1%)
TP2: 2208.07 (-1.9%)
TP3: 2182.75 (-3.0%)
SL: 2284.03 (+1.5%)
Plan: enter only inside the zone, close 50% at TP1, 25% at TP2, 25% at TP3, and move the stop to entry after TP1.
Note: moderate conviction only, keep size light.
Why SHORT? 5/12 signals agree, 0 against.
• 4h trend down (below EMA50 & EMA200)
• 1h trend down (below EMA50 & EMA200)
• BTC is falling, this coin follows (corr 0.90)
If it plays out:
Price should keep falling toward 2224.95 and 2208.07 if the 4h trend stays down.
If it fails:
A close above 2284.03 would prove sellers are losing control and I would exit the short.
What level would make you hesitate on this short?
56
·
--
Bajista
Ver traducción
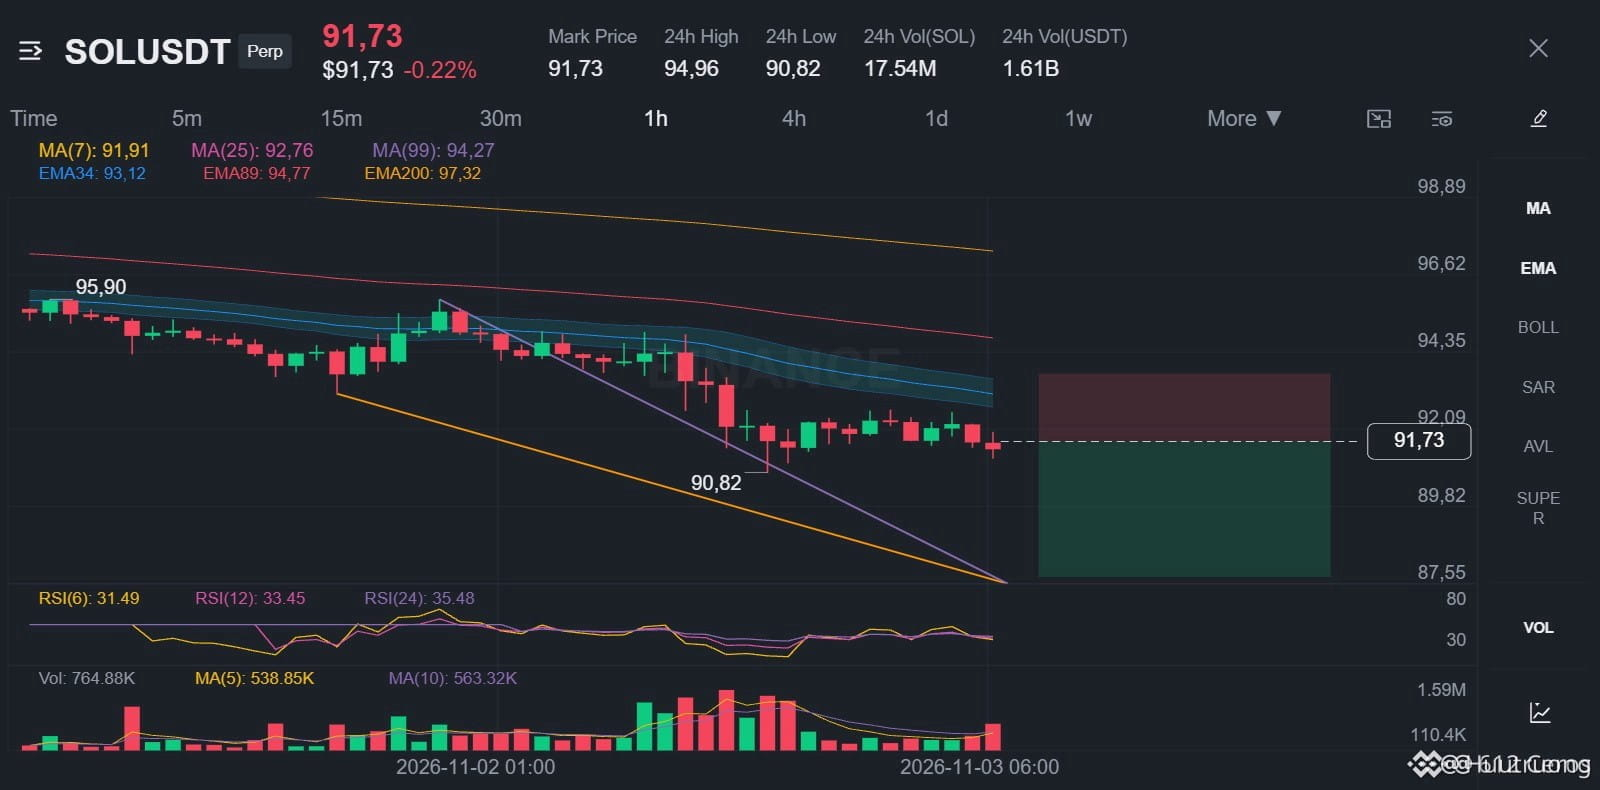
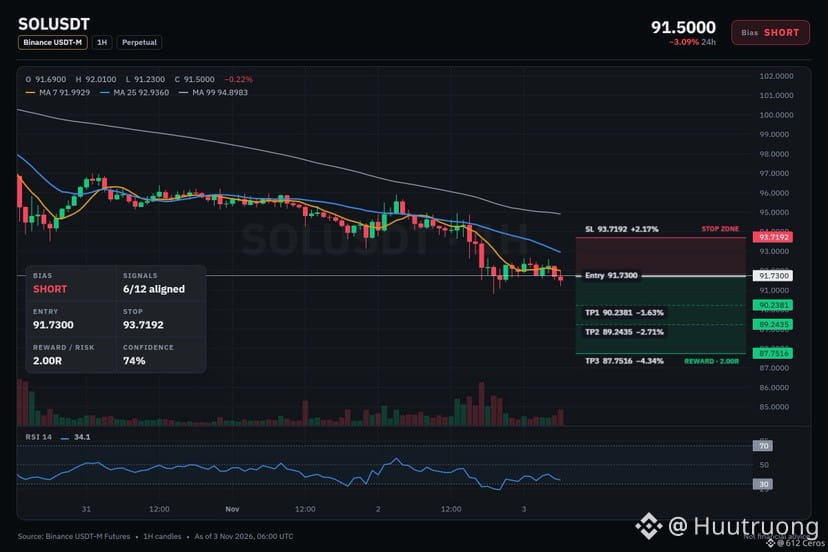
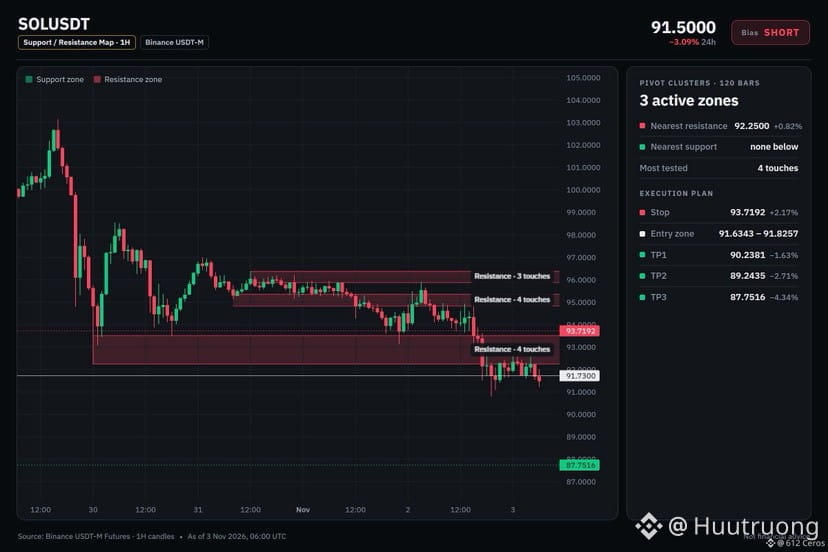
SOL is sliding below stacked EMAs on the 4h.
🔴 SHORT $SOL /USDT: expecting price to go DOWN
Bias: SHORT · Strong
Entry: 91.6343 – 91.8257
TP1: 90.2381 (-1.6%)
TP2: 89.2435 (-2.7%)
TP3: 87.7516 (-4.3%)
SL: 93.7192 (+2.2%)
Plan: enter only inside the zone, close 50% at TP1, 25% at TP2, 25% at TP3, and move the stop to entry after TP1.
Why SHORT? 6/12 signals agree, 0 against.
• 4h trend down (below EMA50 & EMA200)
• 1h trend down (below EMA50 & EMA200)
• Sellers are driving the move (15m ADX 20.4)
The short version:
1. The 4h trend shows price below EMA50 and EMA200, a bearish stack meaning the swing trend is down.
2. The 1h trend also shows price below EMA50 and EMA200, a bearish stack meaning the short-term trend is down.
3. The 1h RSI is 34.1, bearish momentum because it is below 45, so sellers have the momentum.
What level would you use as an invalidation?
{spot}(SOLUSDT)
SOL is sliding below stacked EMAs on the 4h.
🔴 SHORT $SOL /USDT: expecting price to go DOWN
Bias: SHORT · Strong
Entry: 91.6343 – 91.8257
TP1: 90.2381 (-1.6%)
TP2: 89.2435 (-2.7%)
TP3: 87.7516 (-4.3%)
SL: 93.7192 (+2.2%)
Plan: enter only inside the zone, close 50% at TP1, 25% at TP2, 25% at TP3, and move the stop to entry after TP1.
Why SHORT? 6/12 signals agree, 0 against.
• 4h trend down (below EMA50 & EMA200)
• 1h trend down (below EMA50 & EMA200)
• Sellers are driving the move (15m ADX 20.4)
The short version:
1. The 4h trend shows price below EMA50 and EMA200, a bearish stack meaning the swing trend is down.
2. The 1h trend also shows price below EMA50 and EMA200, a bearish stack meaning the short-term trend is down.
3. The 1h RSI is 34.1, bearish momentum because it is below 45, so sellers have the momentum.
What level would you use as an invalidation?
🔴 SHORT $SOL /USDT: expecting price to go DOWN
Bias: SHORT · Strong
Entry: 91.6343 – 91.8257
TP1: 90.2381 (-1.6%)
TP2: 89.2435 (-2.7%)
TP3: 87.7516 (-4.3%)
SL: 93.7192 (+2.2%)
Plan: enter only inside the zone, close 50% at TP1, 25% at TP2, 25% at TP3, and move the stop to entry after TP1.
Why SHORT? 6/12 signals agree, 0 against.
• 4h trend down (below EMA50 & EMA200)
• 1h trend down (below EMA50 & EMA200)
• Sellers are driving the move (15m ADX 20.4)
The short version:
1. The 4h trend shows price below EMA50 and EMA200, a bearish stack meaning the swing trend is down.
2. The 1h trend also shows price below EMA50 and EMA200, a bearish stack meaning the short-term trend is down.
3. The 1h RSI is 34.1, bearish momentum because it is below 45, so sellers have the momentum.
What level would you use as an invalidation?
71
·
--
Bajista
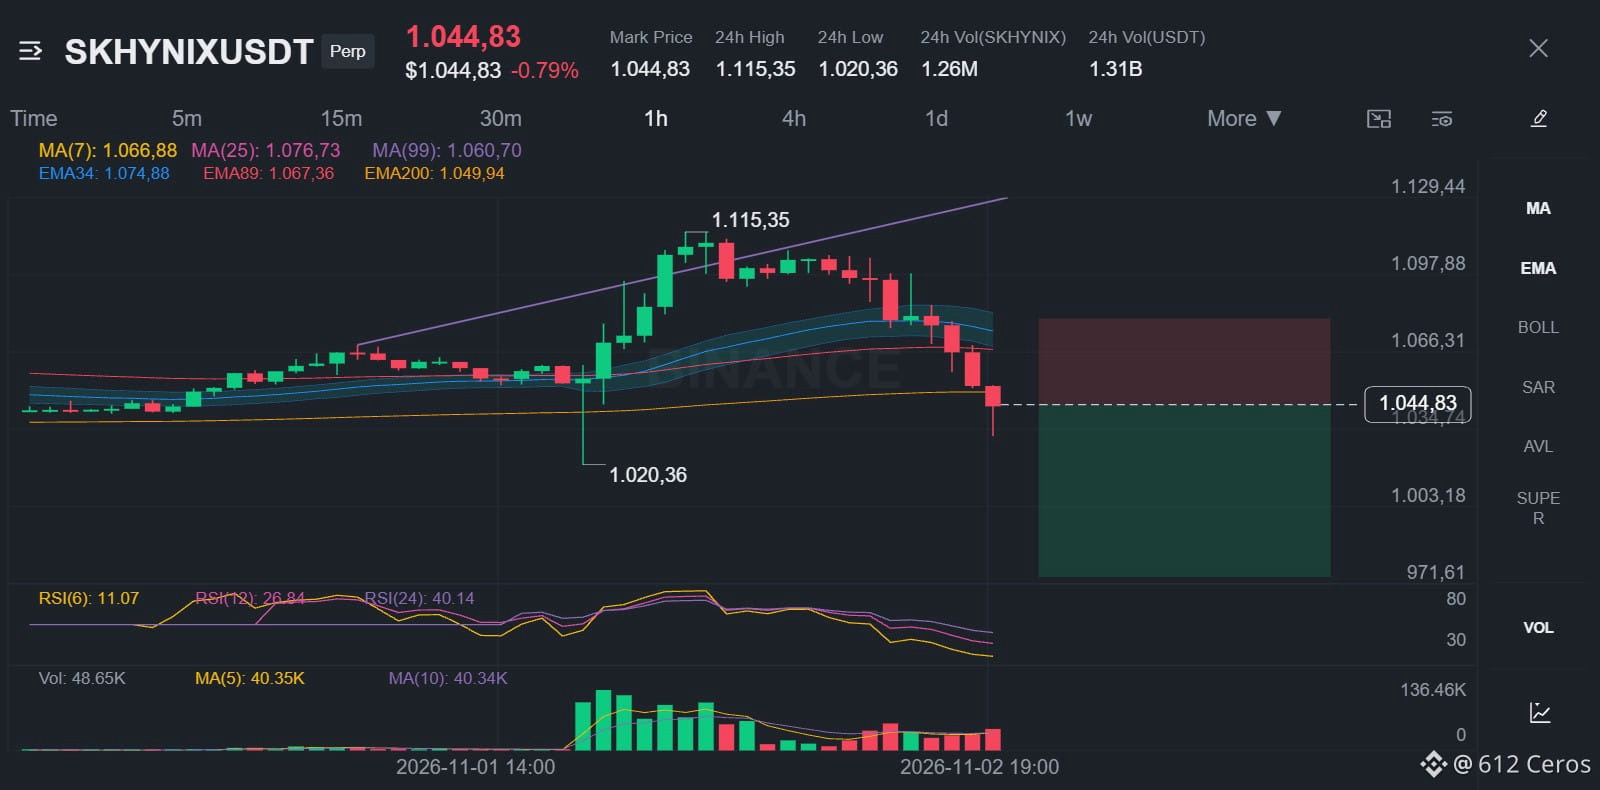
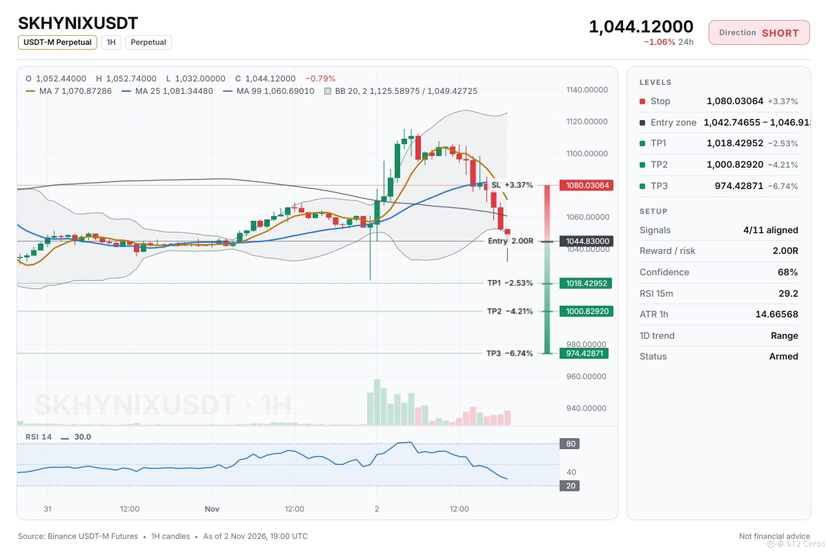
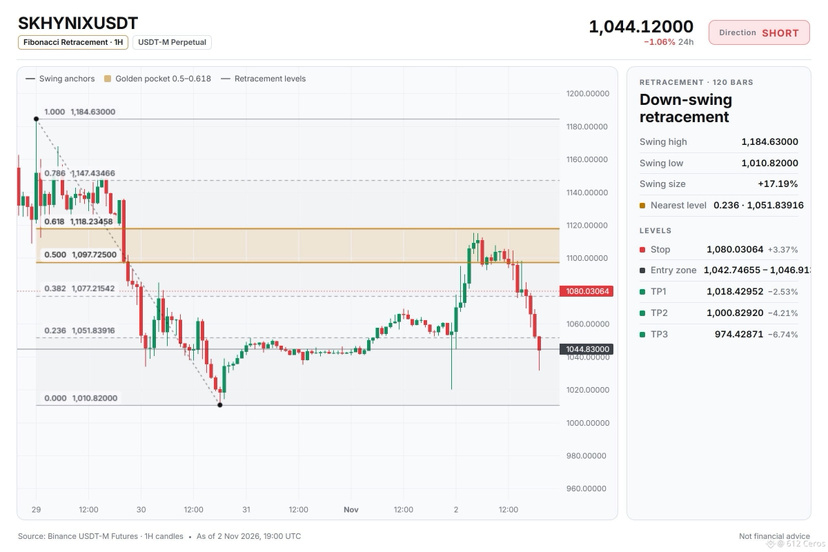
SKHYNIX sigue bajando en una tendencia, así que aquí voy en corto.
🔴 CORTO $SKHYNIX /USDT: espero que el precio BAJE
Sesgo: CORTO · Con inclinación
Entrada: 1042.74655 – 1046.91345
TP1: 1018.42952 (-2.5%)
TP2: 1000.82920 (-4.2%)
TP3: 974.42871 (-6.7%)
SL: 1080.03064 (+3.4%)
Plan: entra solo dentro de la zona, cierra el 50% en TP1, el 25% en TP2 y el 25% en TP3, y mueve el stop al precio de entrada después de TP1.
Nota: convicción moderada; mantén un tamaño de posición reducido.
¿Por qué CORTO? 4/11 señales están de acuerdo, 0 en contra.
• Tendencia bajista en 4h (por debajo de EMA50 y EMA200)
• Los vendedores impulsan el movimiento (ADX de 15m: 40.4)
• Los vendedores tienen el impulso (RSI de 4h: 43.7)
Plan A:
Si sigue cayendo más allá de la entrada, el precio en 1h podría avanzar hacia el primer objetivo, ya que la tendencia de 4h muestra una estructura bajista y los vendedores tienen el control.
Plan B (invalidación):
Si el precio vuelve a superar el stop, la configuración es incorrecta y saldré en el nivel de invalidación.
¿Dónde colocarías tu nivel frente a esta posición corta?
{future}(SKHYNIXUSDT)
SKHYNIX sigue bajando en una tendencia, así que aquí voy en corto.
🔴 CORTO $SKHYNIX /USDT: espero que el precio BAJE
Sesgo: CORTO · Con inclinación
Entrada: 1042.74655 – 1046.91345
TP1: 1018.42952 (-2.5%)
TP2: 1000.82920 (-4.2%)
TP3: 974.42871 (-6.7%)
SL: 1080.03064 (+3.4%)
Plan: entra solo dentro de la zona, cierra el 50% en TP1, el 25% en TP2 y el 25% en TP3, y mueve el stop al precio de entrada después de TP1.
Nota: convicción moderada; mantén un tamaño de posición reducido.
¿Por qué CORTO? 4/11 señales están de acuerdo, 0 en contra.
• Tendencia bajista en 4h (por debajo de EMA50 y EMA200)
• Los vendedores impulsan el movimiento (ADX de 15m: 40.4)
• Los vendedores tienen el impulso (RSI de 4h: 43.7)
Plan A:
Si sigue cayendo más allá de la entrada, el precio en 1h podría avanzar hacia el primer objetivo, ya que la tendencia de 4h muestra una estructura bajista y los vendedores tienen el control.
Plan B (invalidación):
Si el precio vuelve a superar el stop, la configuración es incorrecta y saldré en el nivel de invalidación.
¿Dónde colocarías tu nivel frente a esta posición corta?
🔴 CORTO $SKHYNIX /USDT: espero que el precio BAJE
Sesgo: CORTO · Con inclinación
Entrada: 1042.74655 – 1046.91345
TP1: 1018.42952 (-2.5%)
TP2: 1000.82920 (-4.2%)
TP3: 974.42871 (-6.7%)
SL: 1080.03064 (+3.4%)
Plan: entra solo dentro de la zona, cierra el 50% en TP1, el 25% en TP2 y el 25% en TP3, y mueve el stop al precio de entrada después de TP1.
Nota: convicción moderada; mantén un tamaño de posición reducido.
¿Por qué CORTO? 4/11 señales están de acuerdo, 0 en contra.
• Tendencia bajista en 4h (por debajo de EMA50 y EMA200)
• Los vendedores impulsan el movimiento (ADX de 15m: 40.4)
• Los vendedores tienen el impulso (RSI de 4h: 43.7)
Plan A:
Si sigue cayendo más allá de la entrada, el precio en 1h podría avanzar hacia el primer objetivo, ya que la tendencia de 4h muestra una estructura bajista y los vendedores tienen el control.
Plan B (invalidación):
Si el precio vuelve a superar el stop, la configuración es incorrecta y saldré en el nivel de invalidación.
¿Dónde colocarías tu nivel frente a esta posición corta?
57
·
--
Bajista
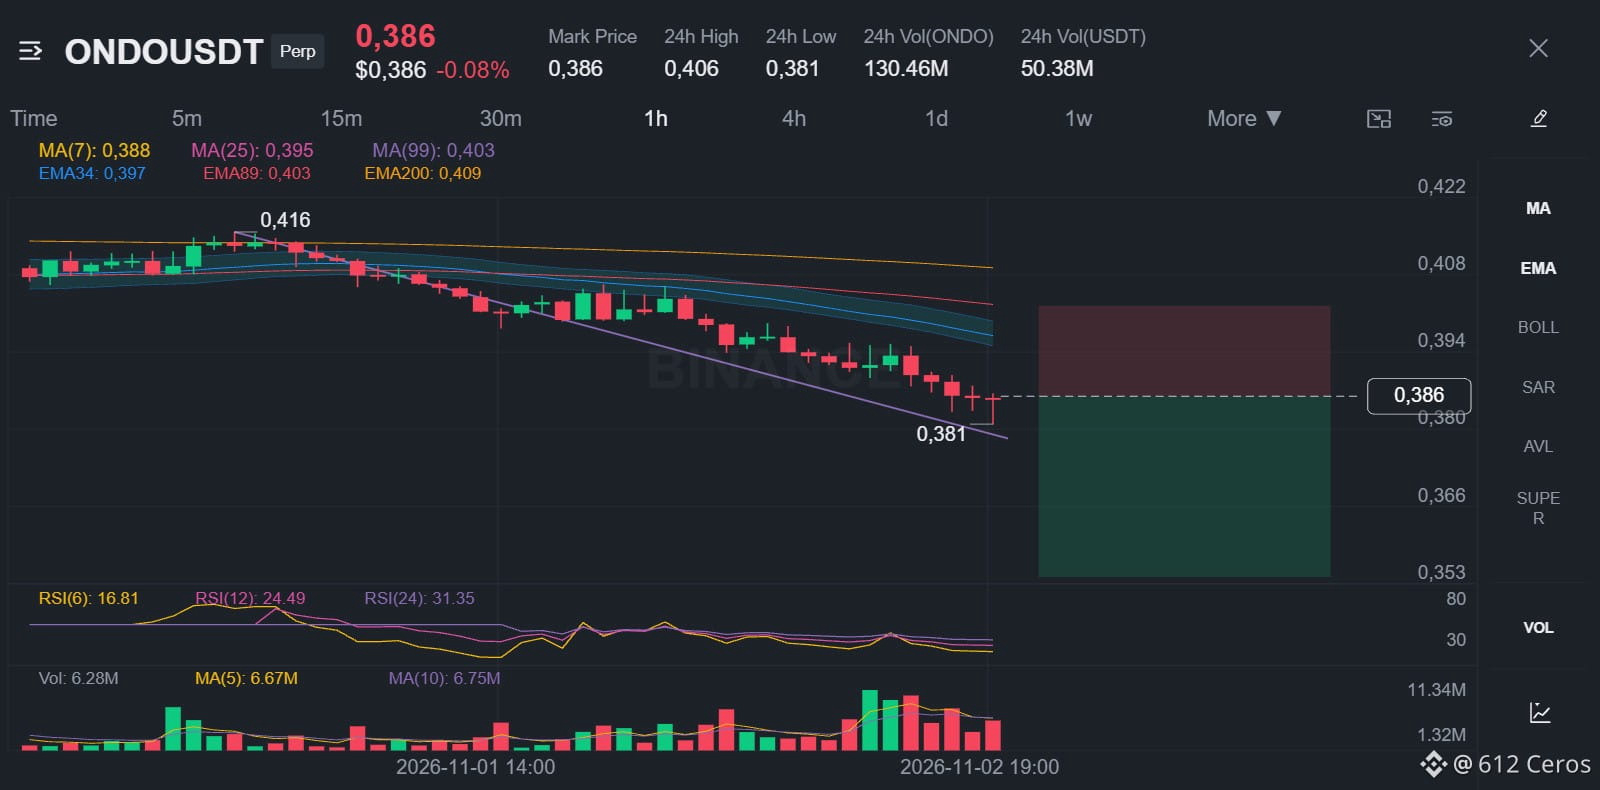
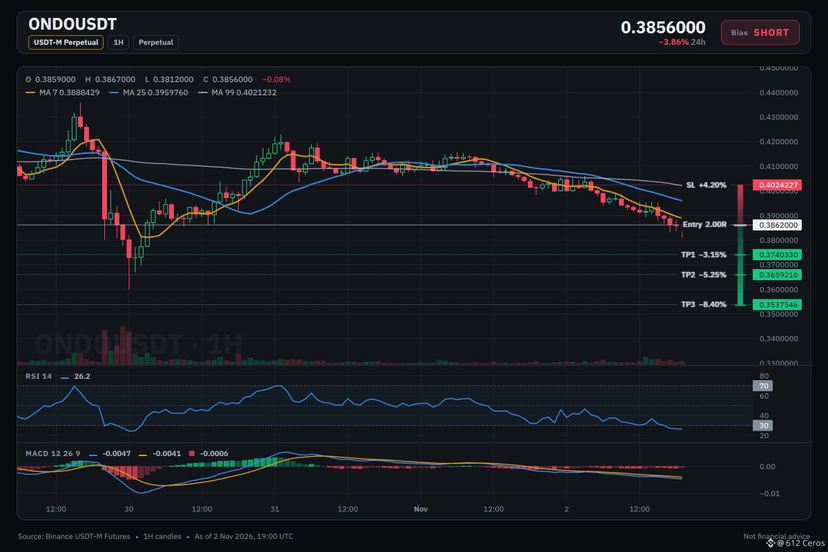
ONDO está girando a la baja para abrir una posición corta mientras BTC lo arrastra.
🔴 CORTO $ONDO /USDT: se espera que el precio BAJE
Sesgo: CORTO · Fuerte
Entrada: 0.3855041 – 0.3868959
TP1: 0.3740330 (-3.2%)
TP2: 0.3659216 (-5.3%)
TP3: 0.3537546 (-8.4%)
SL: 0.4024227 (+4.2%)
Plan: entrar solo dentro de la zona, cerrar el 50% en TP1, el 25% en TP2 y el 25% en TP3, y mover el stop al precio de entrada después de TP1.
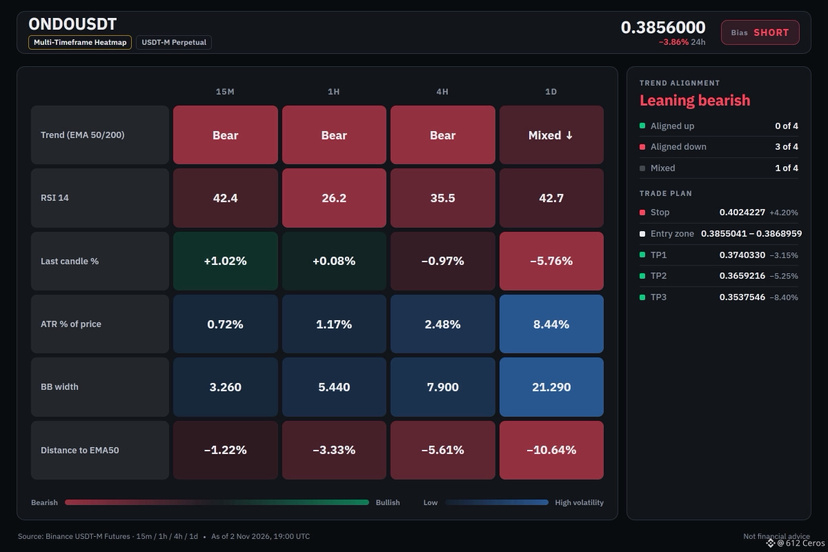
¿Por qué CORTO? Lista de verificación de ONDO: 7/12 están de acuerdo, 0 en contra.
• Tendencia de 4 h bajista (por debajo de EMA50 y EMA200)
• Tendencia de 1 h bajista (por debajo de EMA50 y EMA200)
• Los vendedores impulsan el movimiento (ADX de 15 min: 29.7)
Atención: La idea queda invalidada si el precio alcanza el stop en 0.4024227
En resumen: La tendencia de 4 h es bajista y BTC está cayendo, lo que significa que la configuración cuenta con una tendencia más fuerte a su favor, pero la tendencia diaria se mueve en un rango mixto, así que el panorama general no está claro.
¿Dónde abrirías tu posición corta en ONDO?
{spot}(ONDOUSDT)
ONDO está girando a la baja para abrir una posición corta mientras BTC lo arrastra.
🔴 CORTO $ONDO /USDT: se espera que el precio BAJE
Sesgo: CORTO · Fuerte
Entrada: 0.3855041 – 0.3868959
TP1: 0.3740330 (-3.2%)
TP2: 0.3659216 (-5.3%)
TP3: 0.3537546 (-8.4%)
SL: 0.4024227 (+4.2%)
Plan: entrar solo dentro de la zona, cerrar el 50% en TP1, el 25% en TP2 y el 25% en TP3, y mover el stop al precio de entrada después de TP1.
¿Por qué CORTO? Lista de verificación de ONDO: 7/12 están de acuerdo, 0 en contra.
• Tendencia de 4 h bajista (por debajo de EMA50 y EMA200)
• Tendencia de 1 h bajista (por debajo de EMA50 y EMA200)
• Los vendedores impulsan el movimiento (ADX de 15 min: 29.7)
Atención: La idea queda invalidada si el precio alcanza el stop en 0.4024227
En resumen: La tendencia de 4 h es bajista y BTC está cayendo, lo que significa que la configuración cuenta con una tendencia más fuerte a su favor, pero la tendencia diaria se mueve en un rango mixto, así que el panorama general no está claro.
¿Dónde abrirías tu posición corta en ONDO?
🔴 CORTO $ONDO /USDT: se espera que el precio BAJE
Sesgo: CORTO · Fuerte
Entrada: 0.3855041 – 0.3868959
TP1: 0.3740330 (-3.2%)
TP2: 0.3659216 (-5.3%)
TP3: 0.3537546 (-8.4%)
SL: 0.4024227 (+4.2%)
Plan: entrar solo dentro de la zona, cerrar el 50% en TP1, el 25% en TP2 y el 25% en TP3, y mover el stop al precio de entrada después de TP1.
¿Por qué CORTO? Lista de verificación de ONDO: 7/12 están de acuerdo, 0 en contra.
• Tendencia de 4 h bajista (por debajo de EMA50 y EMA200)
• Tendencia de 1 h bajista (por debajo de EMA50 y EMA200)
• Los vendedores impulsan el movimiento (ADX de 15 min: 29.7)
Atención: La idea queda invalidada si el precio alcanza el stop en 0.4024227
En resumen: La tendencia de 4 h es bajista y BTC está cayendo, lo que significa que la configuración cuenta con una tendencia más fuerte a su favor, pero la tendencia diaria se mueve en un rango mixto, así que el panorama general no está claro.
¿Dónde abrirías tu posición corta en ONDO?
28
Inicia sesión para explorar más contenidos
Únete a usuarios globales de criptomonedas en Binance Square
⚡️ Obtén información útil y actualizada sobre criptos.
💬 Avalado por el mayor exchange de criptomonedas en el mundo.
👍 Descubre perspectivas reales de creadores verificados.
Email/número de teléfono
Temas populares
BinanceIncidentReport
502 vistas
63 están debatiendo
Incidente de seguridad de Binance del 29 de octubre de 2026: conclusiones iniciales y actualización de la respuesta
Binance Blog
·75 me gusta
·166.7k vistas
BinanceReopensWithdrawalsForMoreAssets
80,635 vistas
1,396 están debatiendo
BinanceHourlyDepositsExceedWithdrawals
35,598 vistas
584 están debatiendo